Master plasmid fundamentals, CRISPR techniques, AAV serotype selection, and antibody applications. Written by scientists, for scientists.
Subscribe
ByBalázs Csoma, Hungarian Research Network CRISPR nucleases are remarkably precise molecular tools for cutting DNA. But “remarkably precise” does not mean “perfectly specific.” In reality, CRISPR nucleases occasionally make mistakes and cleave DNA sequences that only resemble ...
Deaminet 2026, held in Palm Springs in late January, brought together researchers studying deaminase enzymes across disciplines: from structural biologists resolving APOBEC proteins at atomic resolution, to cancer biologists dissecting mutational processes, to medical ...
Do you have a green thumb — or, perhaps, are you one of those people who kills every plant they touch? The whole trouble with houseplants is they can’t bark, meow, or cry when they need something. But what if we could equip plants with a way to warn us about concerning growing ...
Every few months we highlight some of the new plasmids, antibodies, viral preps, and more in the repository through our Hot Plasmids articles. This month, check out hot new AAV packaging plasmids, CRISPR libraries, and more!
As 2025 closed, we received a request that perfectly embodies why Addgene exists: a researcher in Laos needed a unique set of plasmids to advance their research. Thanks to five different labs across the U.S. who deposited their plasmids with Addgene to share with the rest of the ...
The genome-editing tool CRISPR is famously RNA-guided... except when it’s not. Turns out, carefully designed RNA-DNA hybrid strands work just as well—or maybe even better—at guiding Cas nucleases to specific genomic targets.
Throughout its 20-year history, Addgene’s mission has been to empower scientists to advance discoveries by reducing barriers, facilitating access to high-quality research materials, tools, and resources, while also fostering scientific collaboration. The first request through ...
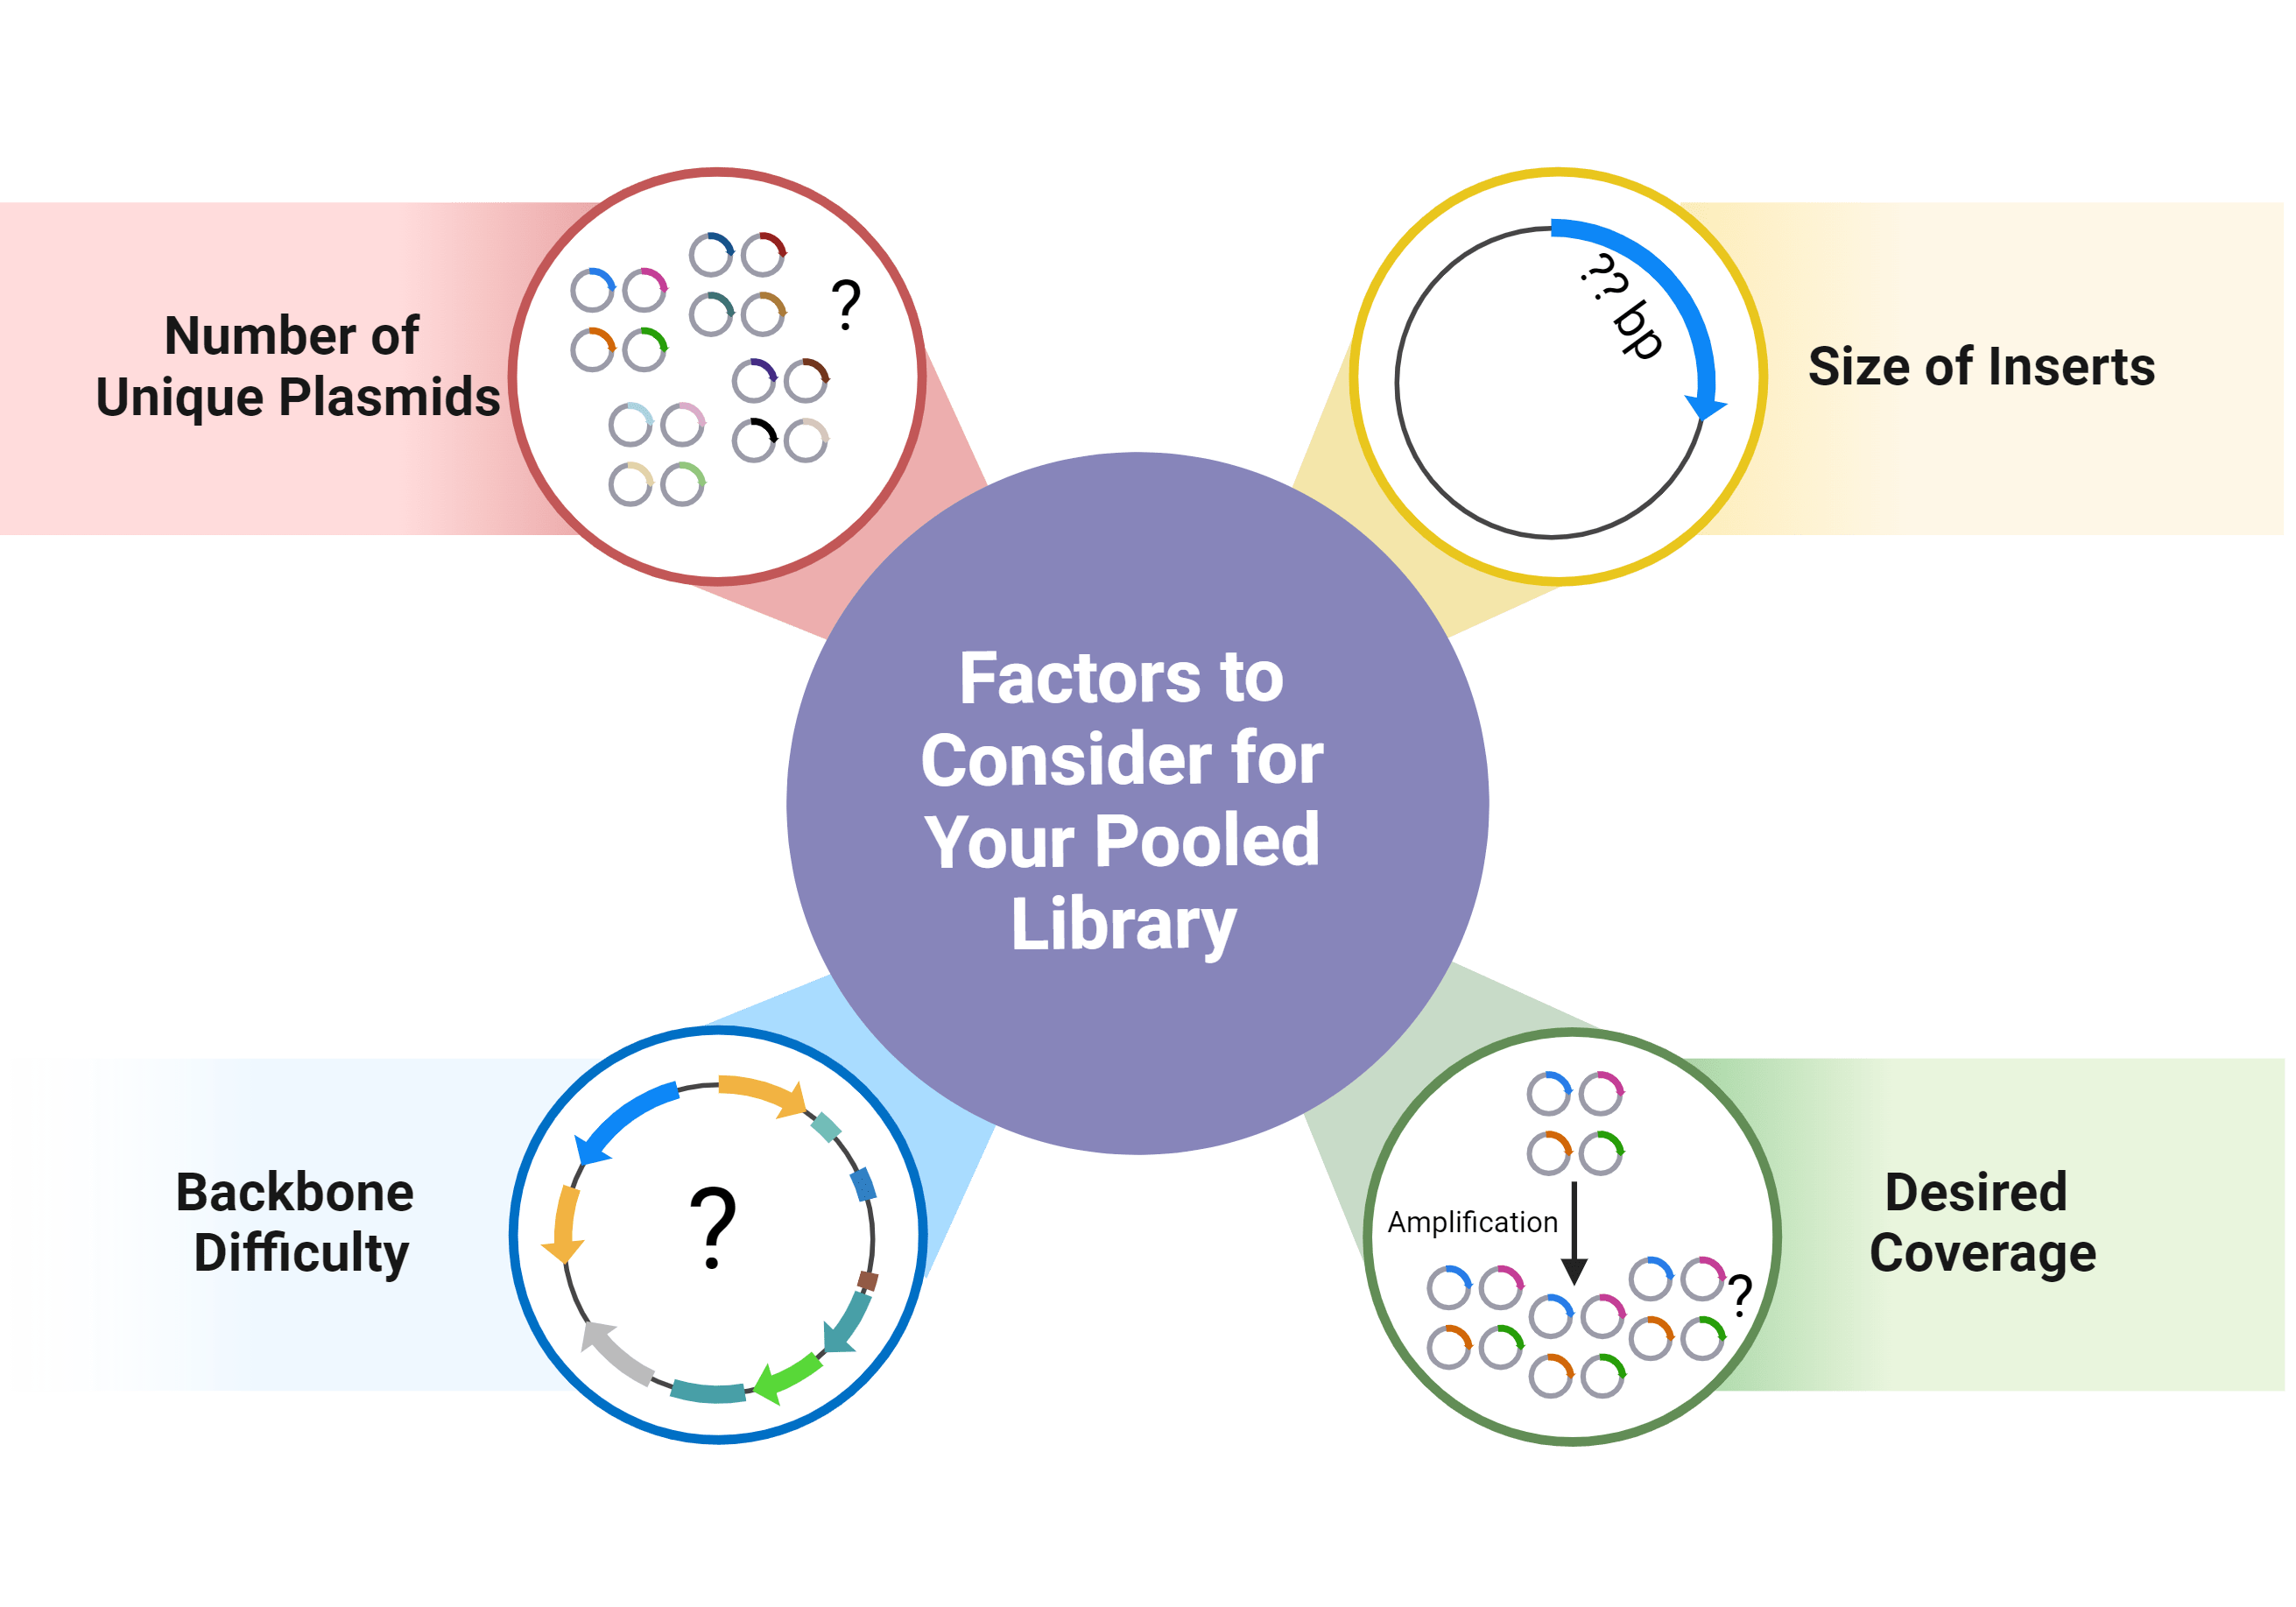
Who doesn’t love a library? A traditional library might contain thousands or millions of different books. Addgene’s pooled libraries are a little different: each is a collection of plasmids that share the same backbone and differ only in a small region. This makes them useful ...
Every few months we highlight some of the new plasmids, antibodies, viral preps, and more in the repository through our Hot Plasmids articles.
This post was written by Professor Mark Howarth, investigator at the University of Cambridge. His research focuses on protein innovations for therapeutic and vaccine design. We all want tools that expand what we can achieve, but are simple to pick up and work well the first ...
Studying proteins in their natural context is one of the biggest challenges in biology. From tumor suppressors to growth factors, some of the most clinically-relevant proteins are also the hardest to study. One common strategy is protein overexpression — boosting levels so ...
It was huge news earlier this year: the first patient in the world, an infant, was successfully treated with a CRISPR gene editing therapy personalized to his genetic mutation. “Baby KJ” was diagnosed with a rare and dangerous metabolic disease shortly after his birth. Within a ...
It takes a village! While you usually hear this phrase when discussing raising children, it can also be applied to research. Sharing knowledge and tools is the best way to help propel research forward and have the biggest impact. We should know — Addgene has built its foundation ...
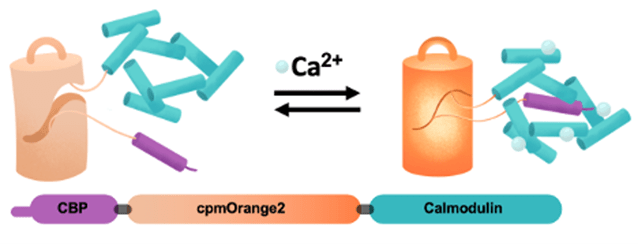
This post was written by Abhi Aggarwal, from University of Calgary. Over the past few decades, genetically encoded calcium indicators (GECIs) have become a vital tool in neuroscience research. These fluorescent proteins light up in response to calcium, which is more than just ...
This post was written by Alyssa Shepard and Angelo Nicolaci, a PhD student at Moffitt Cancer Center. Engineering usually calls to mind building things, lots of math, and maybe heavy machinery. But not all engineering is at a large scale — some is done on much smaller equipment ...
This blog post was written by Dr. Kutubuddin Molla, investigator at ICAR-Central National Rice Research Institute. When it comes to genome editing, CRISPR is a name that resonates with nearly every biologist, academic, and researcher. Among the most well-known CRISPR-associated ...
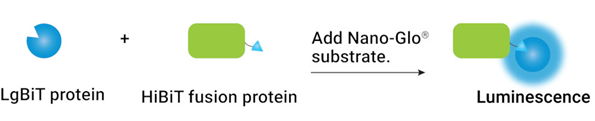
For most people, the most familiar source of bioluminescence is the firefly. Along with charming nighttime displays, these insects have contributed an important tool to the scientific community: luciferases, which have become common genetic reporters and alternatives to ...
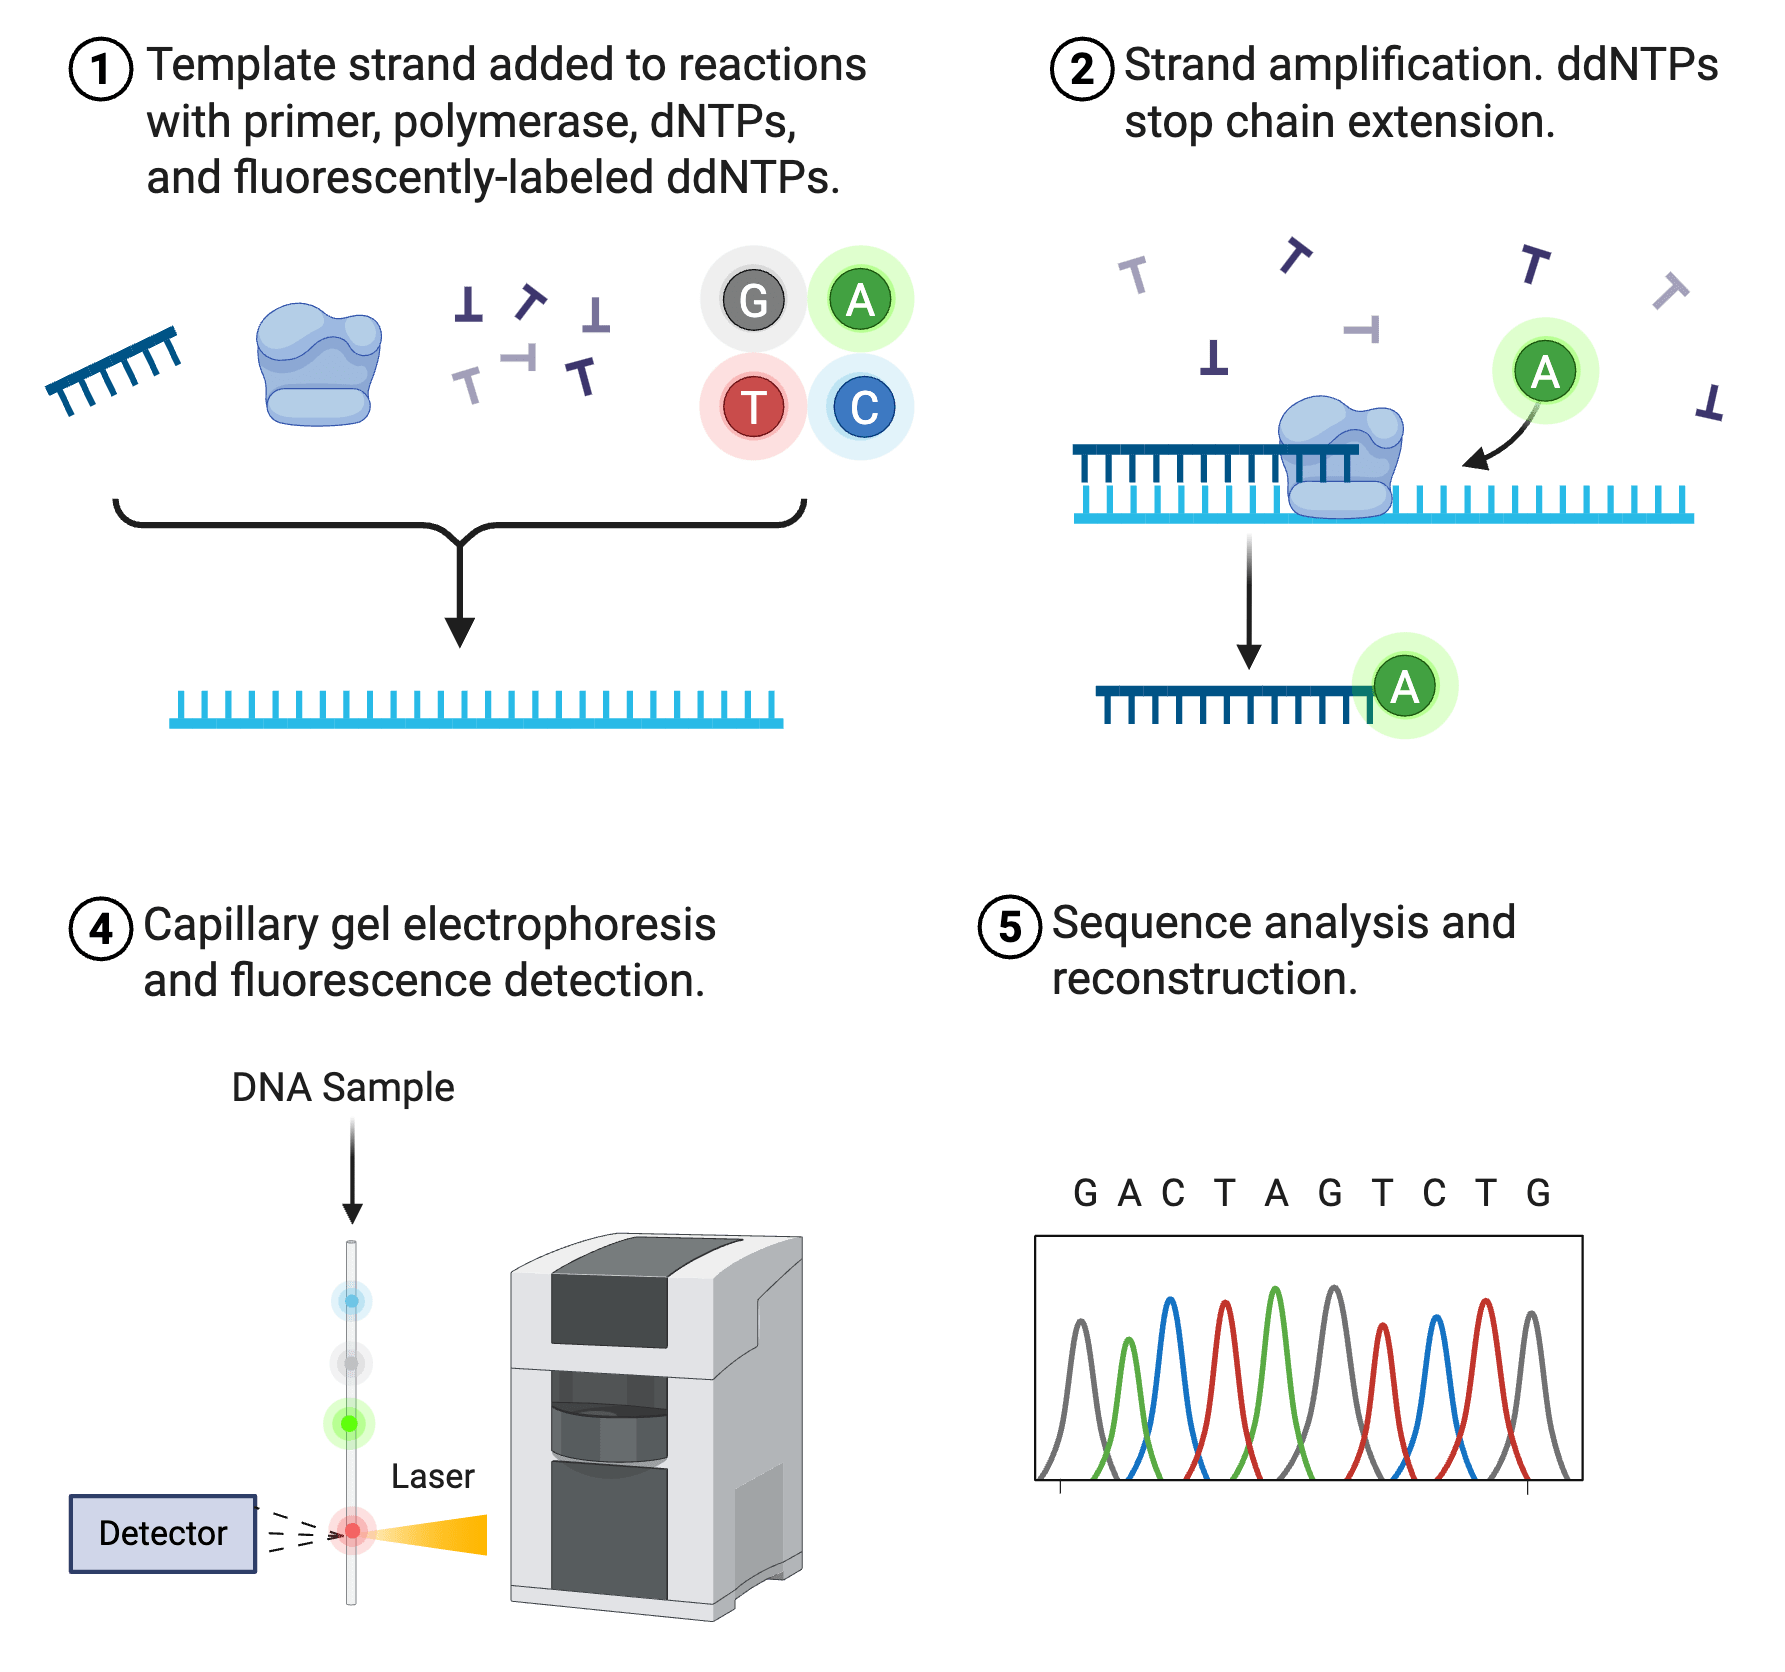
Previously, we provided a general overview of the QC process at Addgene. All plasmids go through this same initial QC process using an Illumina MiSeq, but that’s not the only technology Addgene uses to ensure accuracy of deposited plasmids. To resolve QC issues, assembly issues, ...
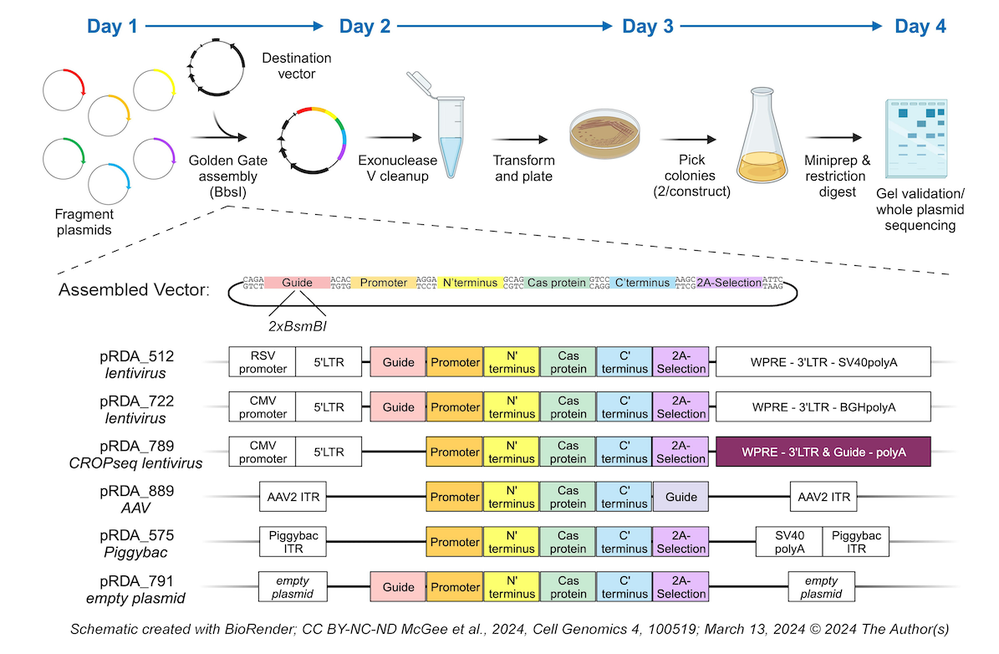
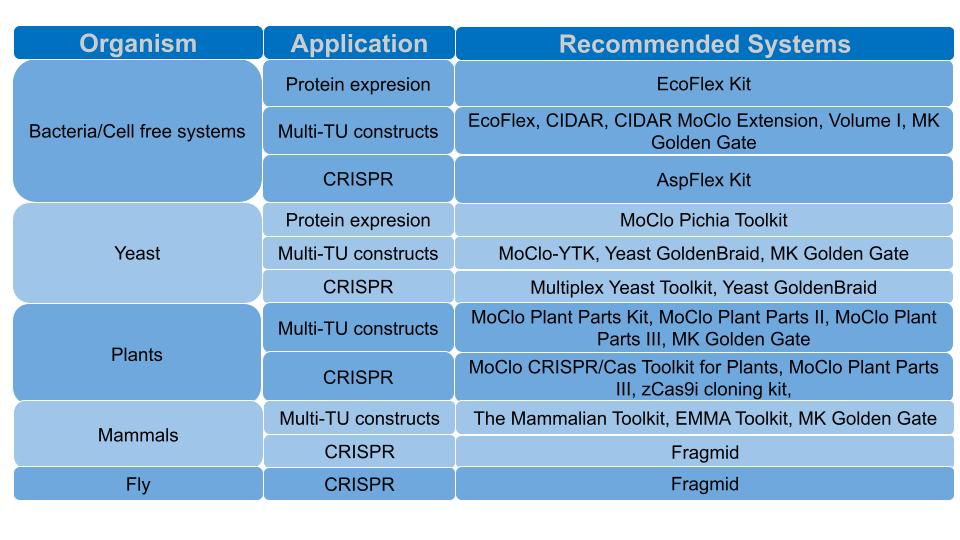
This post was written by Alfonso Timoneda, with significant contributions from Robert Hurt and Mohamed Soufi. So you’ve learned about the Modular Cloning (MoClo) system and what it can do for you, and you’ve chosen one of the MoClo kits available through Addgene that suits your ...
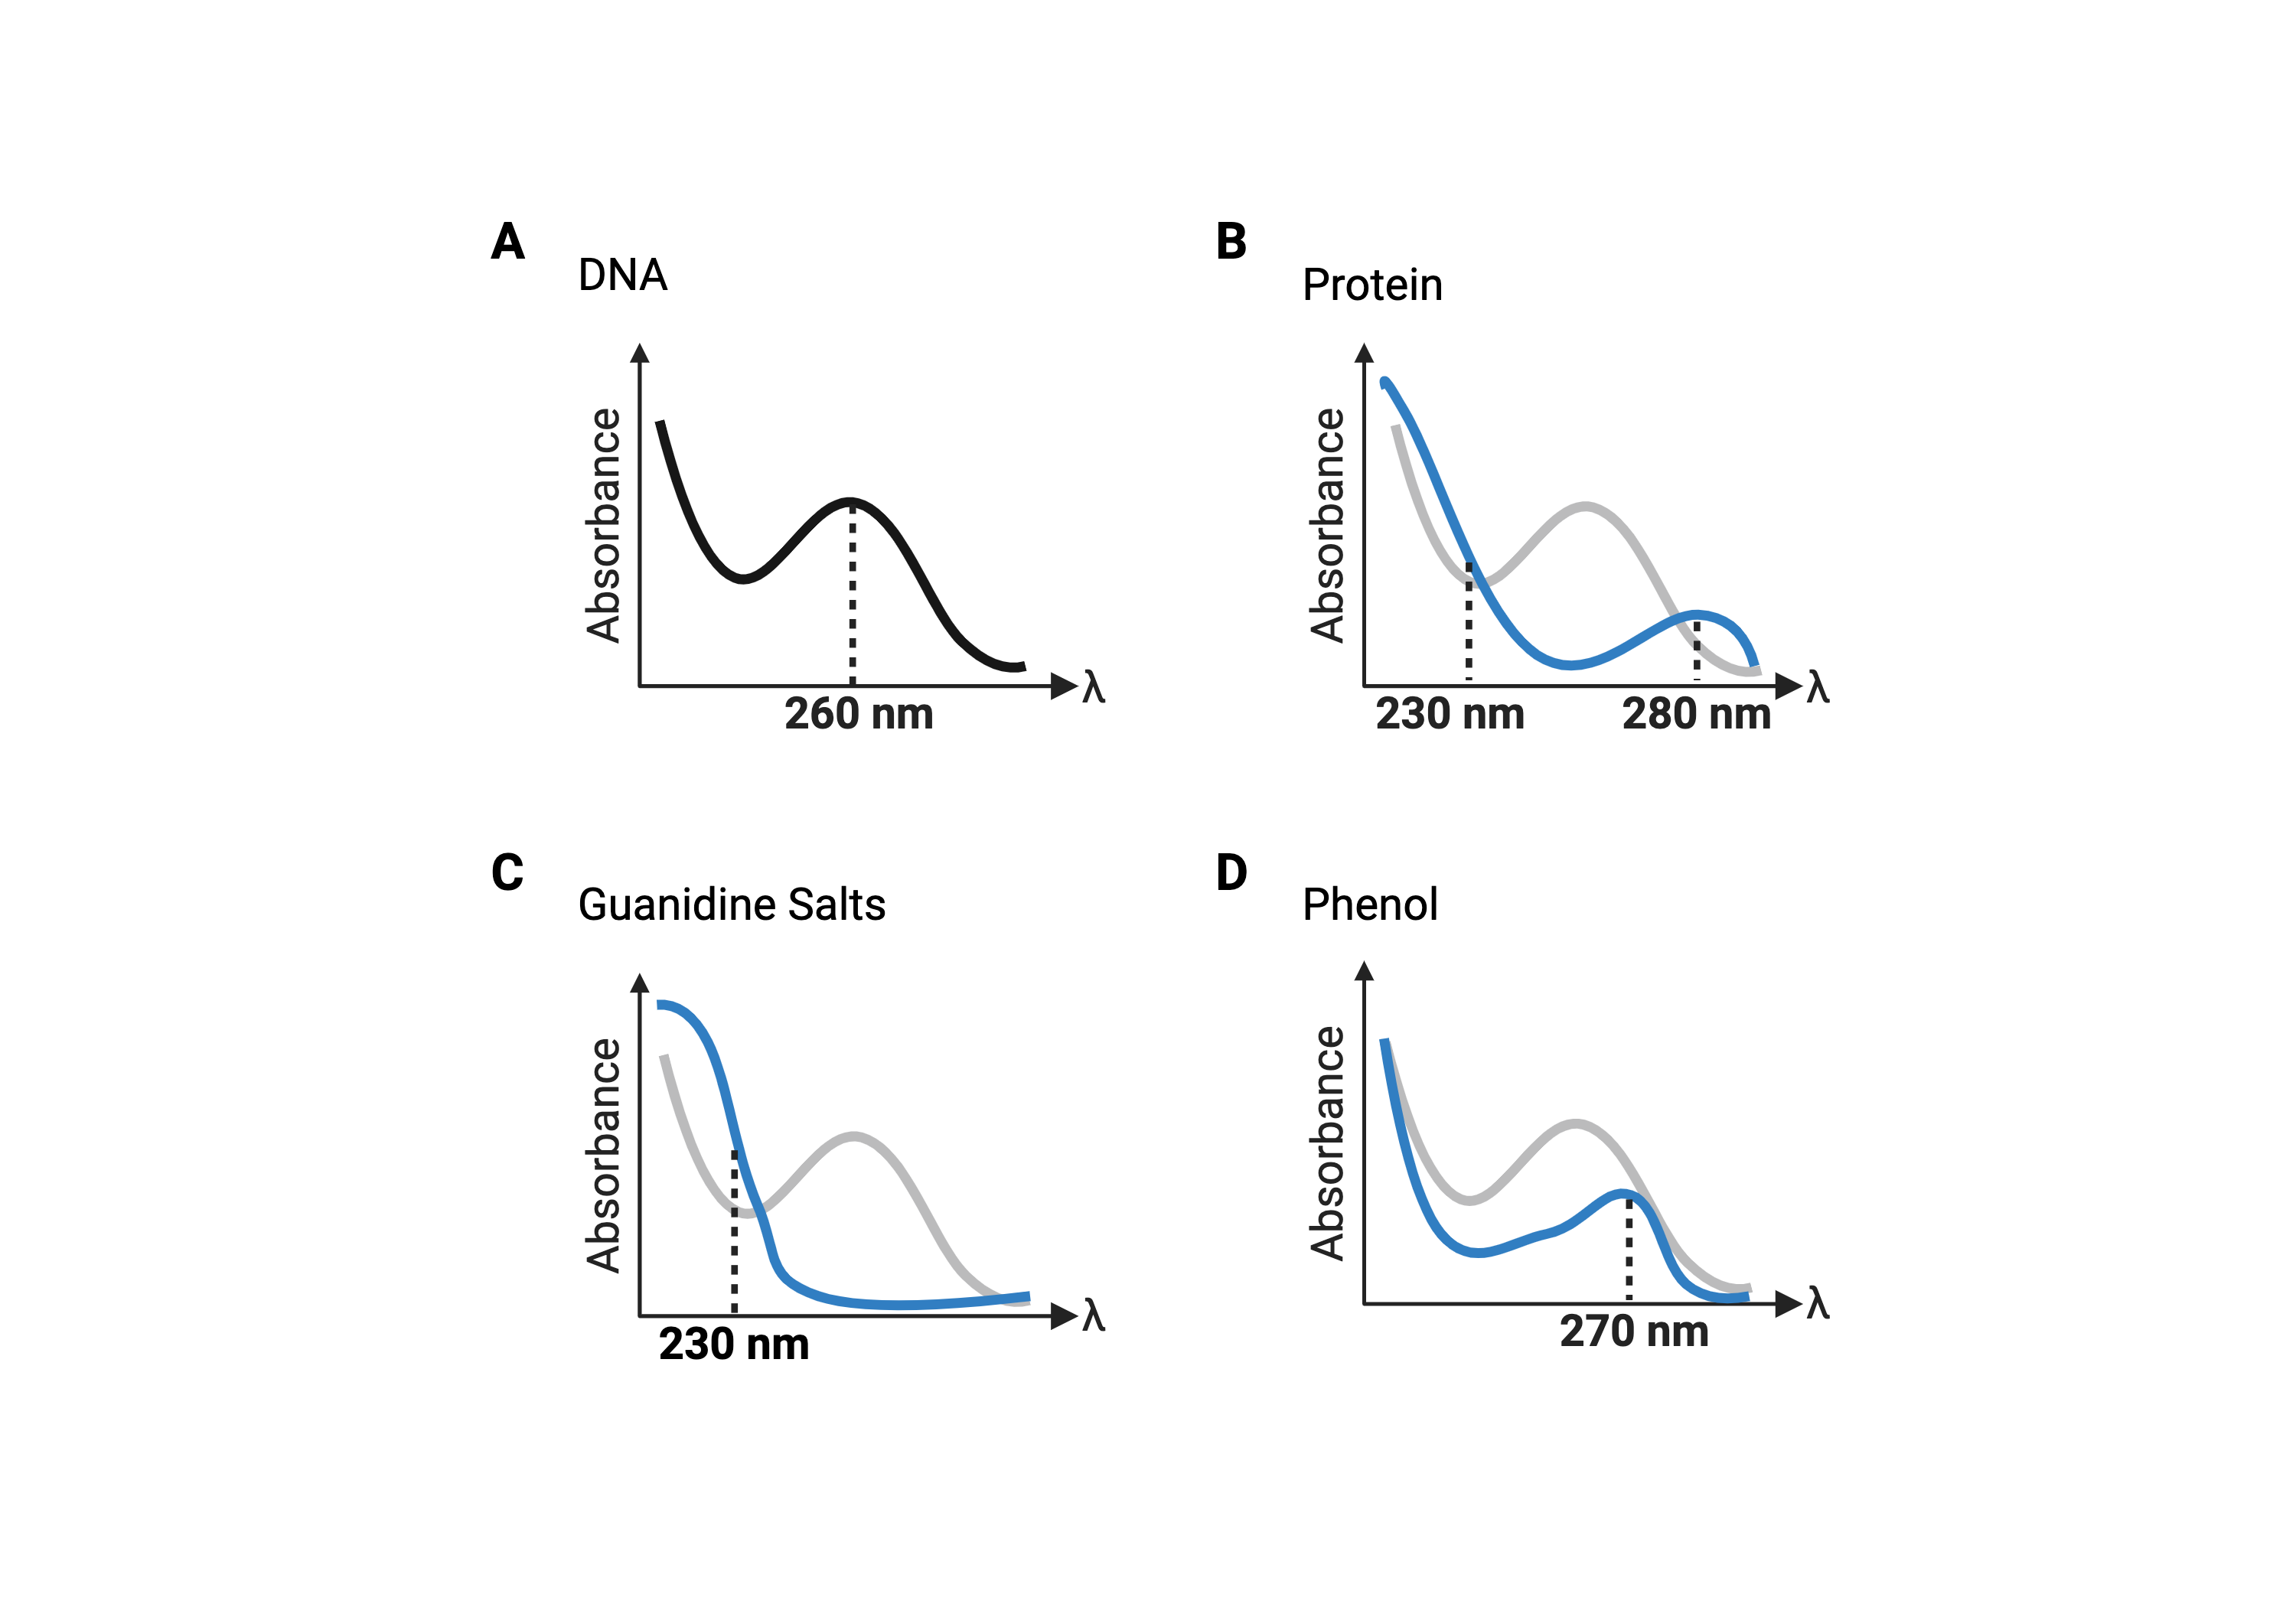
You have just purified your plasmid and are ready to move on to your downstream application — but wait! Do you know how much plasmid DNA you have or how pure your sample really is?
We all know the timeline for publishing research papers can be long and unpredictable. Fortunately, you can submit plasmids at any point in that process and we provide an option to keep your deposit on hold from public access until the article is published. This policy gives us ...
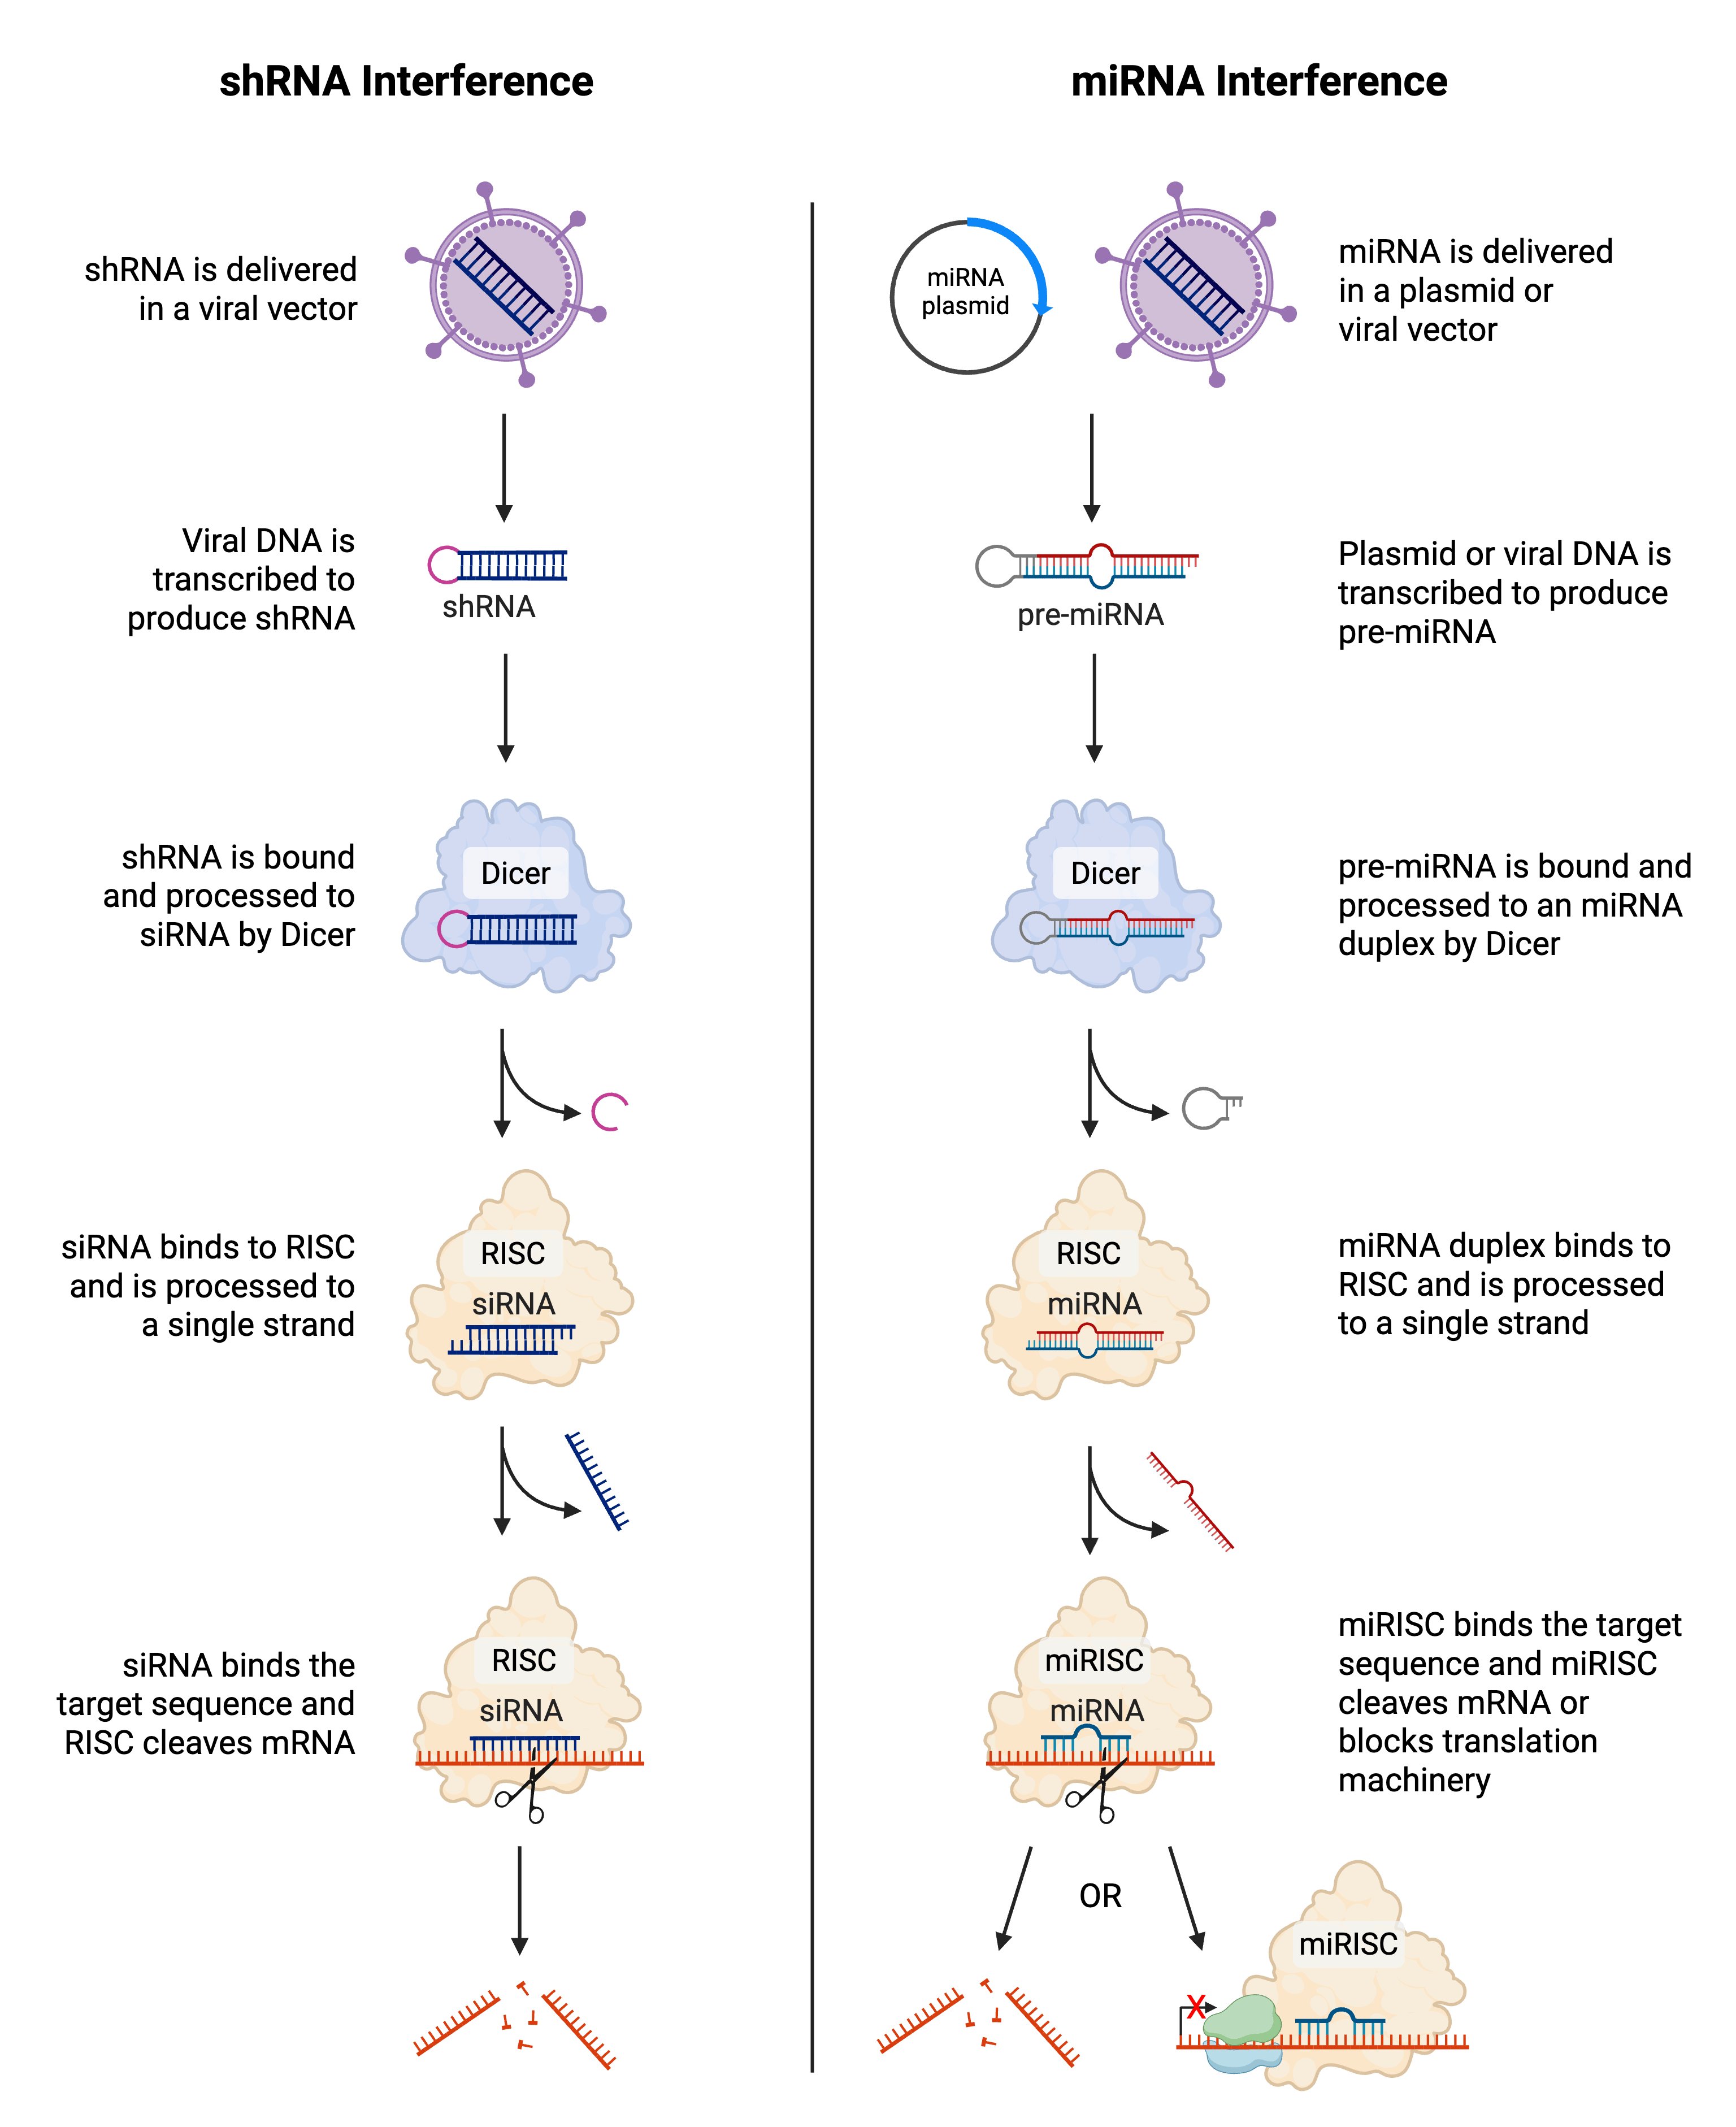
An oldie but a goodie — a phrase used to refer to something that has fallen out of fashion but is still useful and most importantly, effective. In the research world, there is a myriad of tools this could be applied to. When it comes to altering gene expression, CRISPR ...
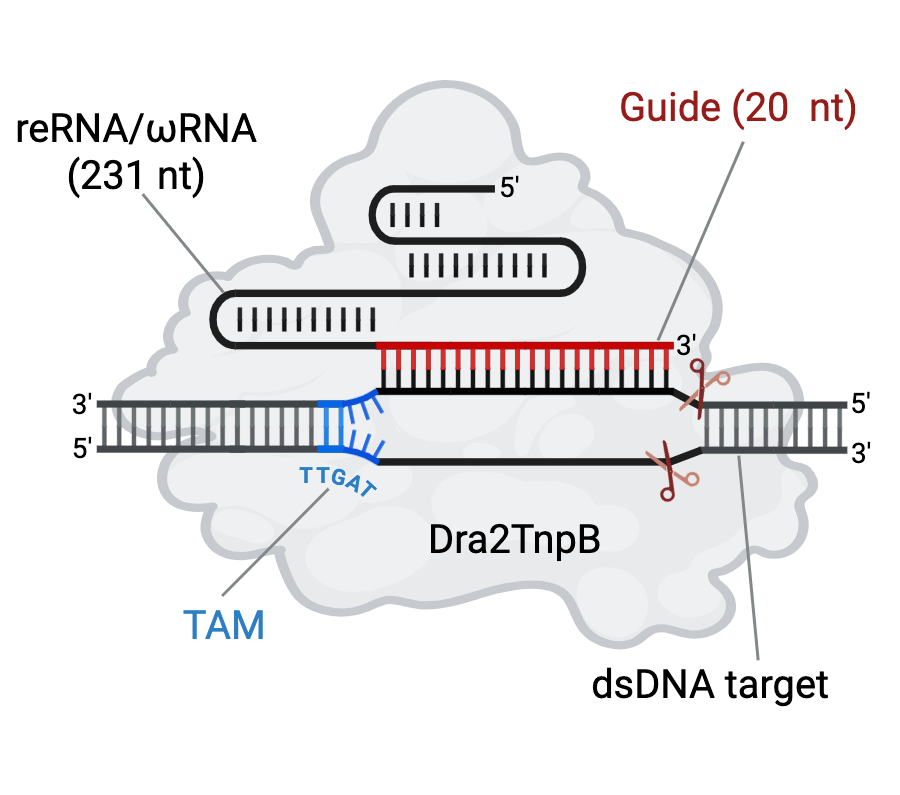
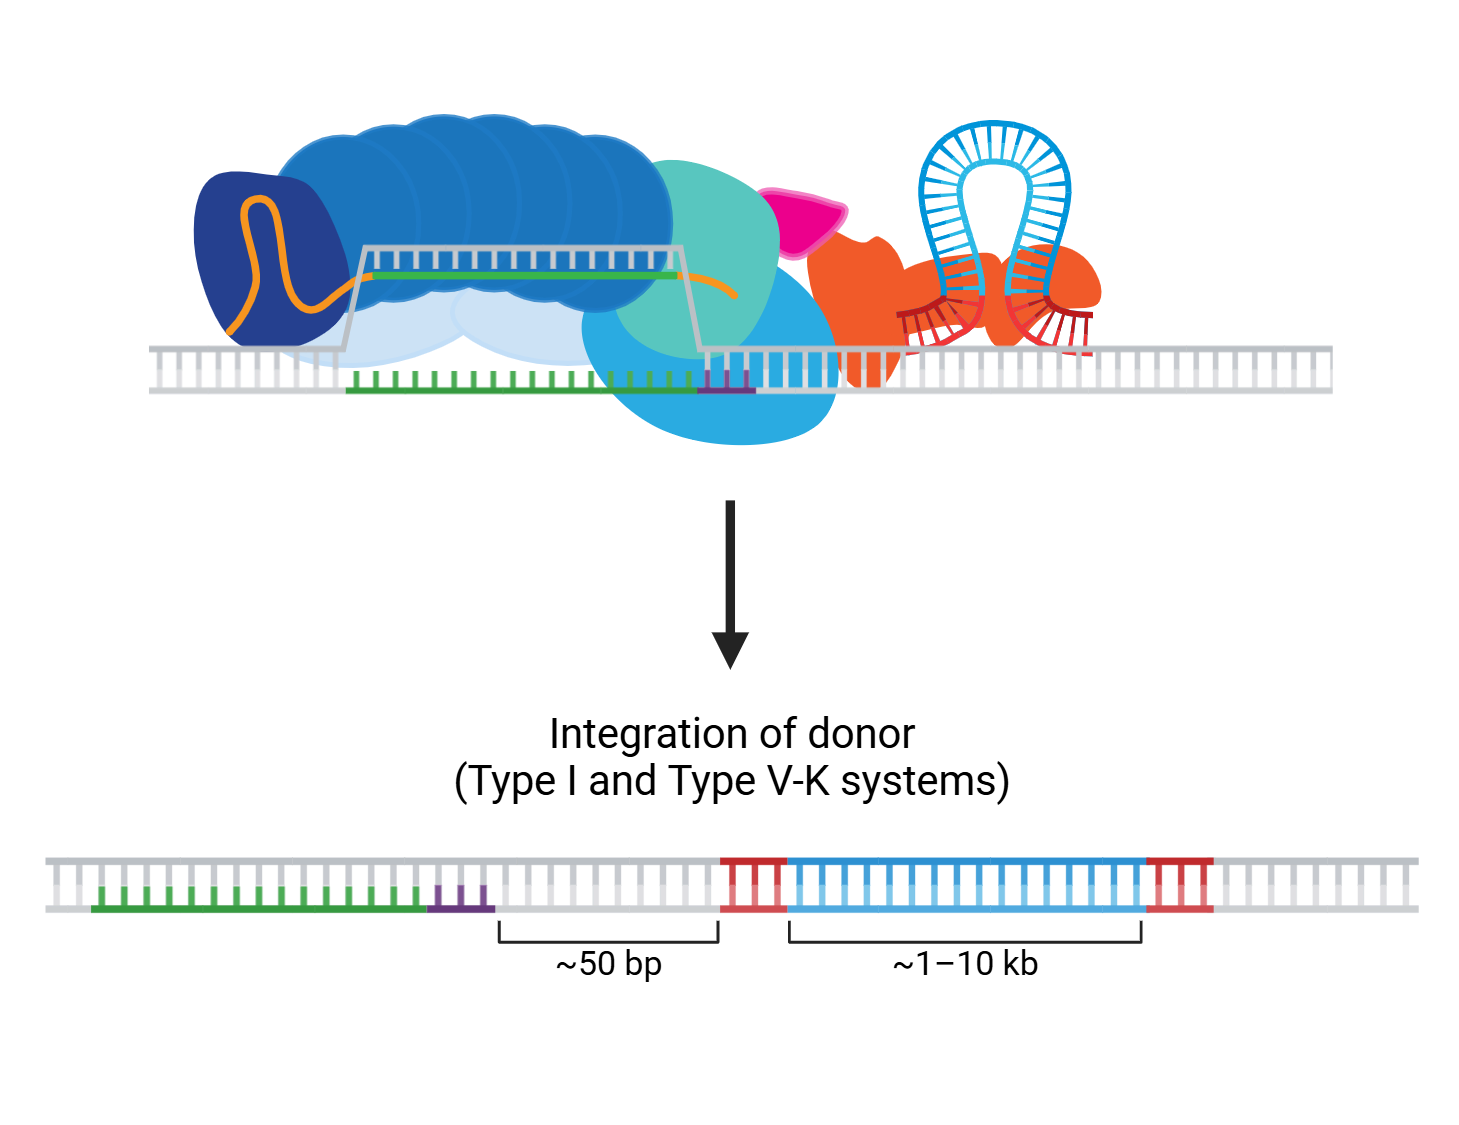
These days, it hardly seems like we finish writing about one dual CRISPR-transposon system before another exciting new advance emerges! The programmability and targeting power of CRISPR combined with the large sequence capacity of transposons open whole new worlds to explore. ...
Every few months we highlight some of the new plasmids, antibodies, and viral preps in the repository through our Hot Plasmids articles.
CoPurifying plasmid DNA from bacterial cultures is a core protocol in molecular biology. And whilekit-free plasmid purification is always an option, let’s be honest — kits are quick, easy, and don’t involve phenol-chloroform.
I fell in love with biology because of an image that was honestly quite boring.
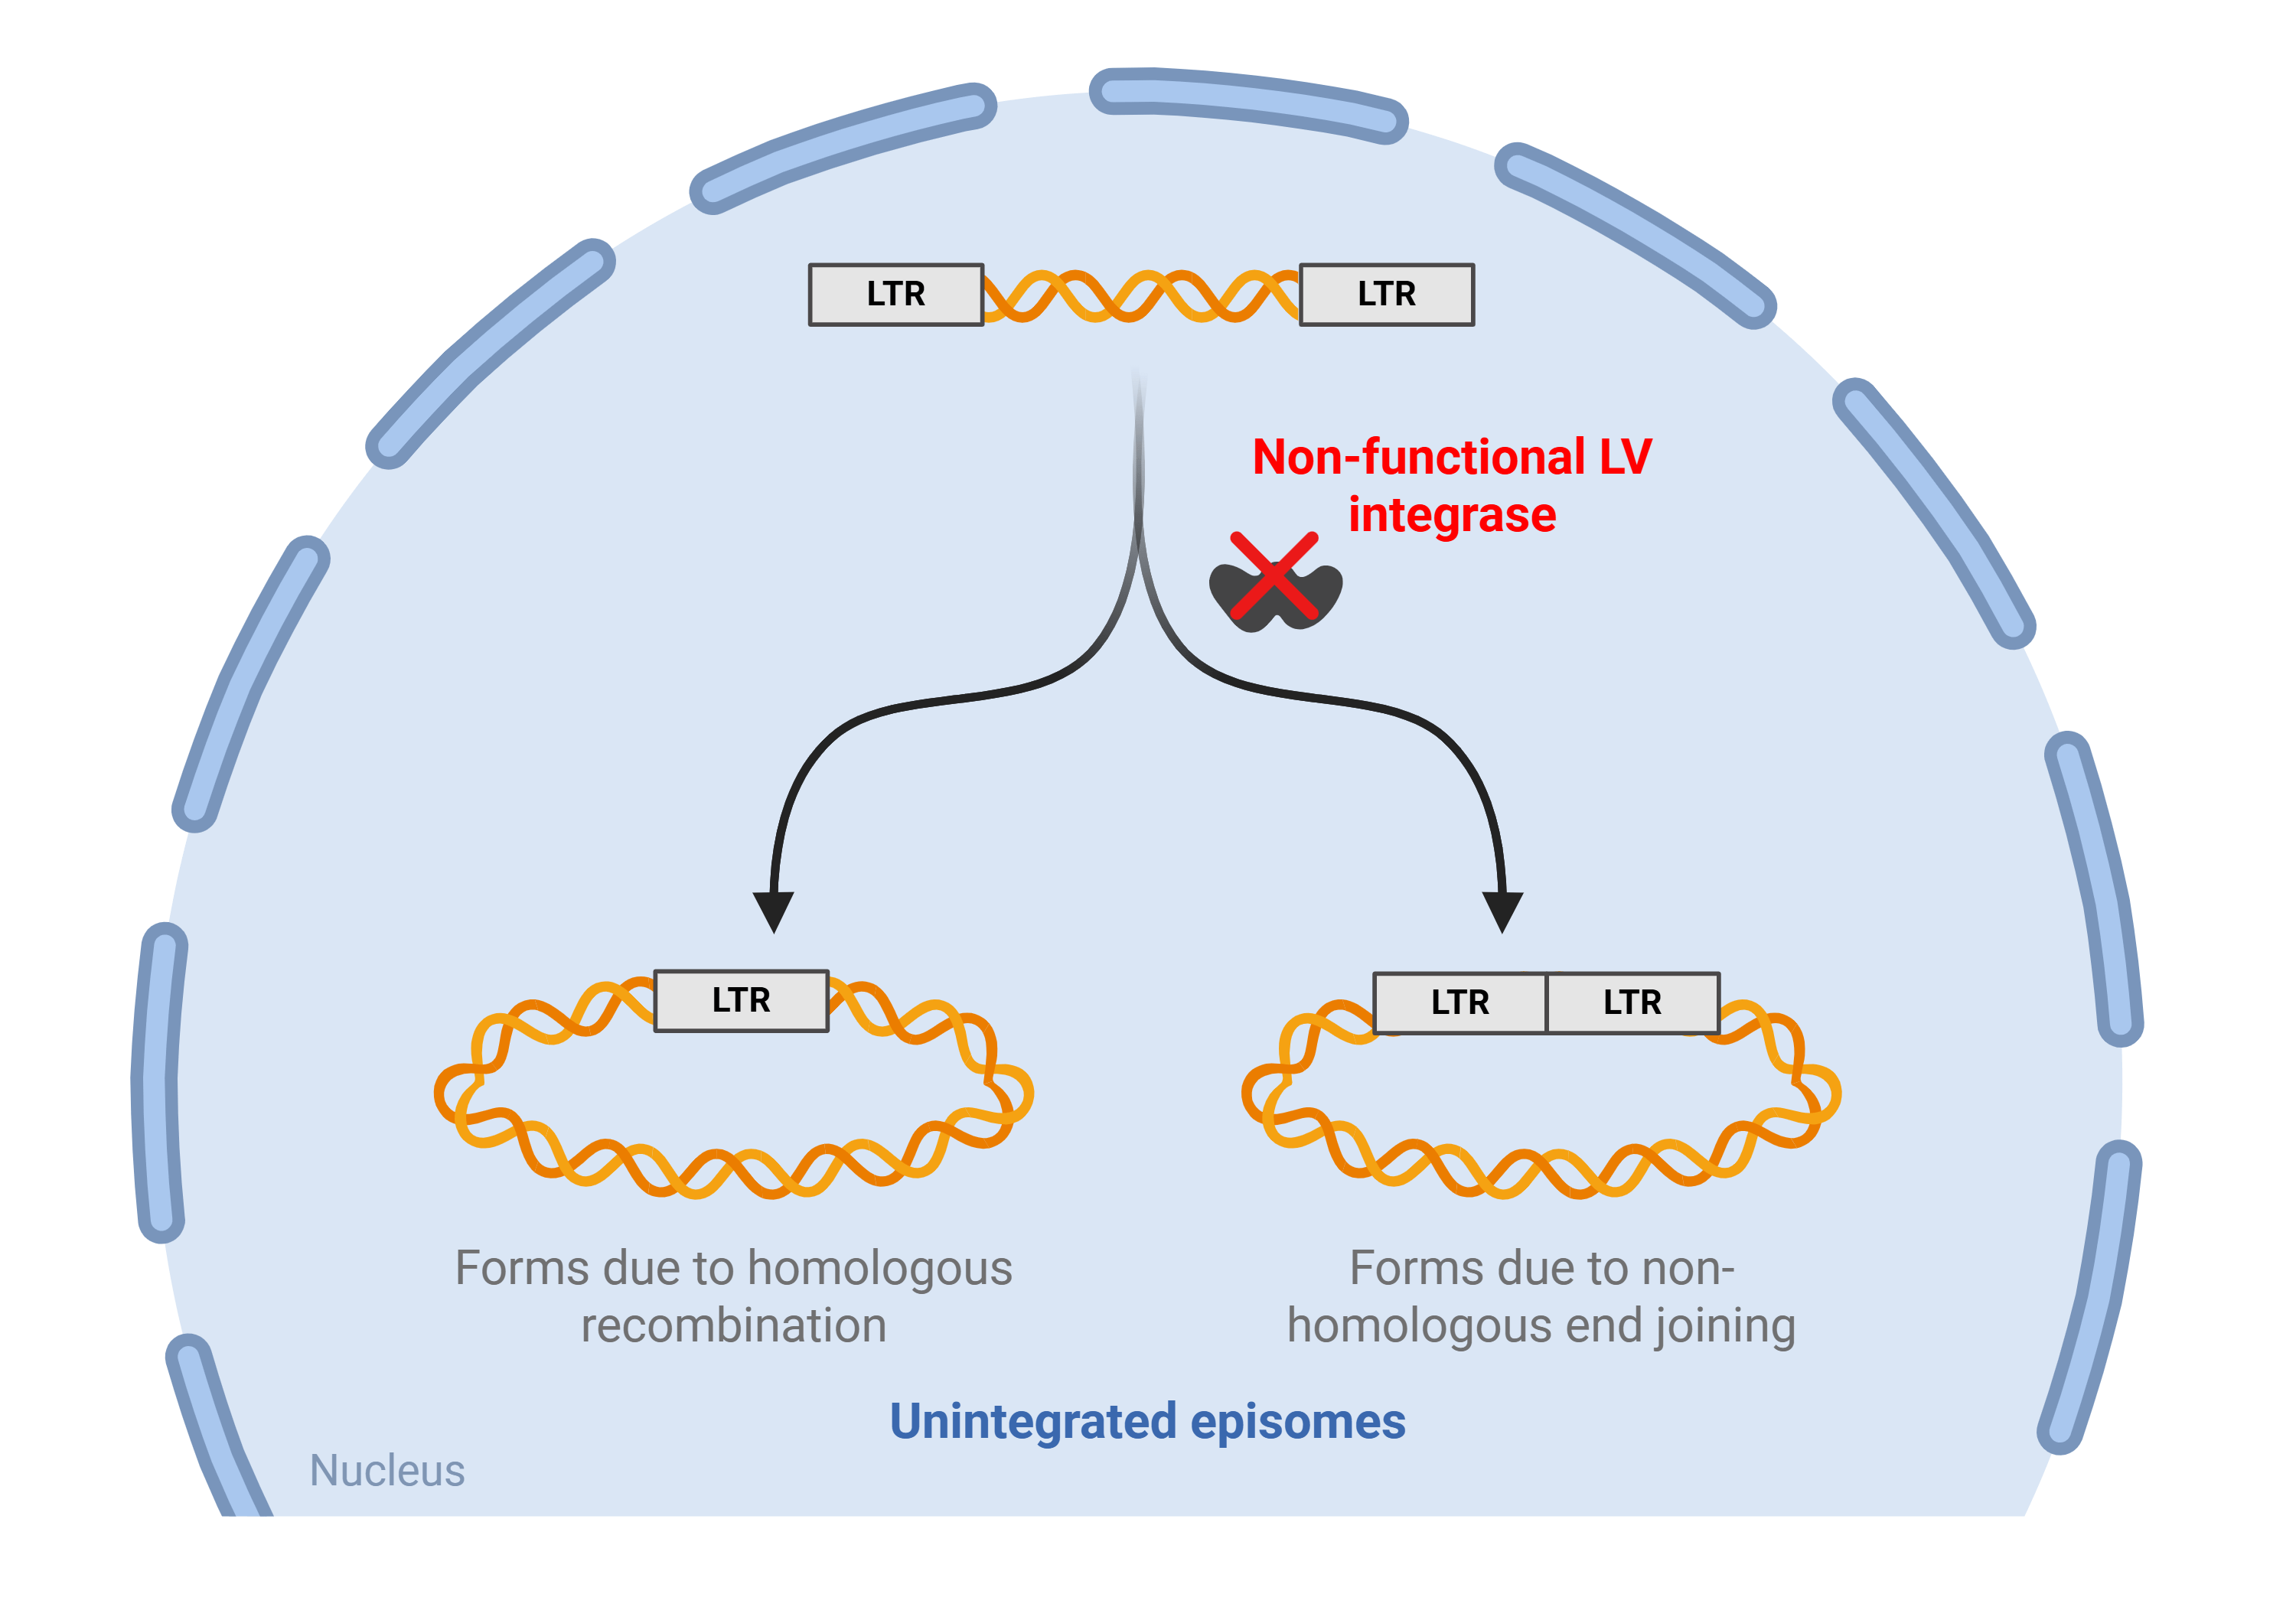
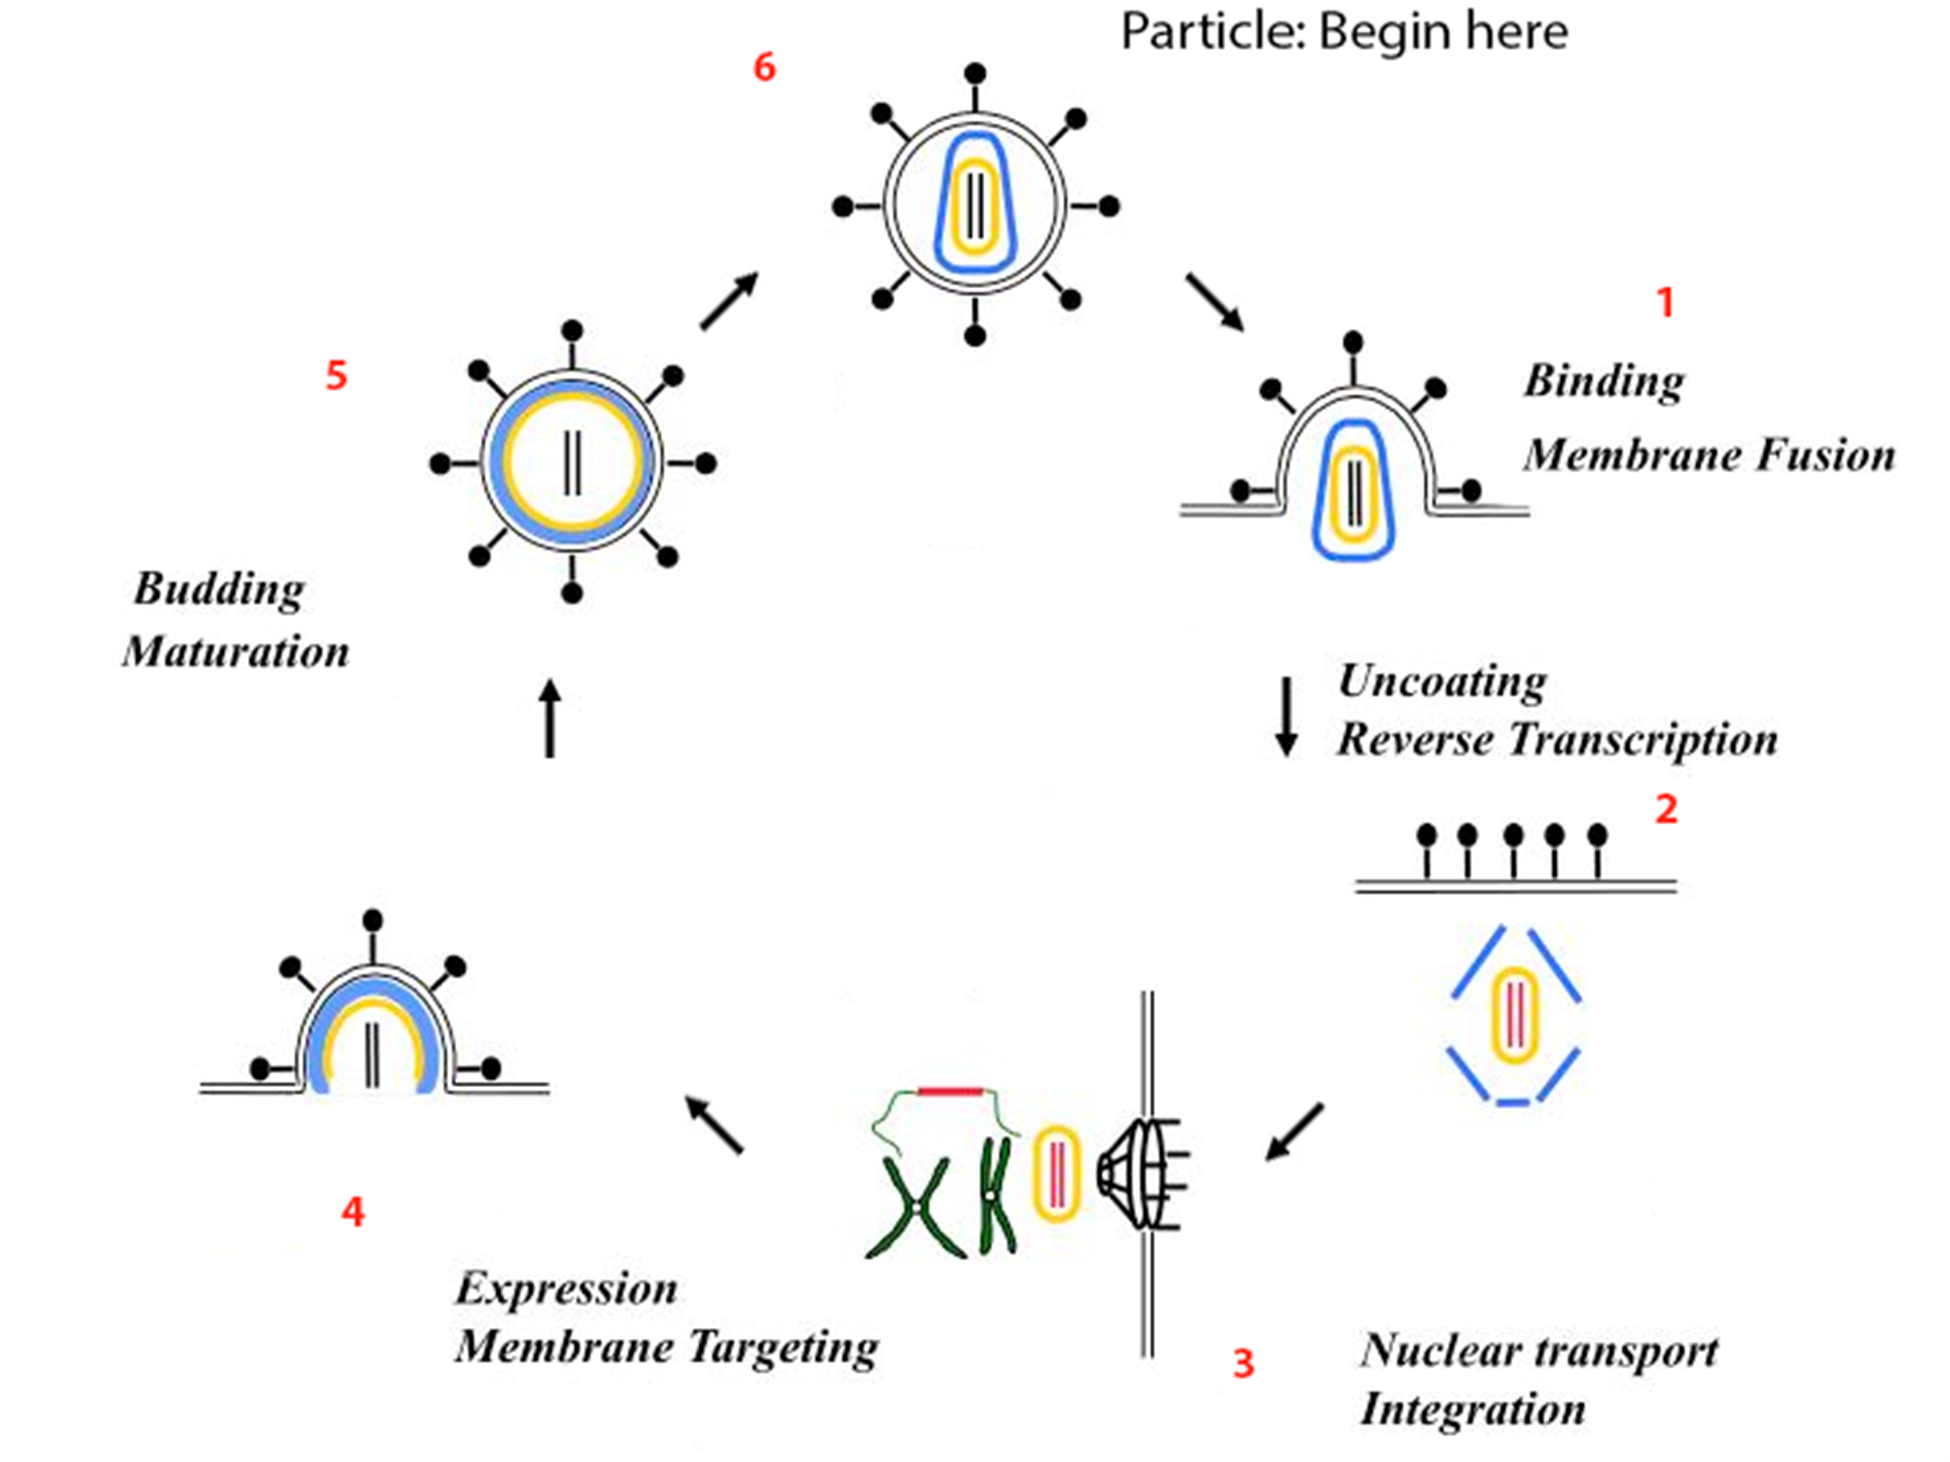
Lentiviral vectors have been a staple in molecular biology for over three decades. Widely used across various research applications, they have become indispensable tools for manipulating cells and organisms. They can be used for a variety of research purposes
Nobody’s perfect! This is a platitude I’m sure we have all heard. It’s a truth that extends to both people and the tools we use. Scientists utilize an array of tools that rely on DNA amplification and manipulation to produce and edit plasmids. These are prone to error — both ...
Addgene’s viral vector services allow scientists to conduct experiments faster, skipping the preparation steps of production, purification, and titering. Our newest viral vector service, AAV Packaged on Request has seen a fantastic response from the research community. Customers ...
The recent sweeping cuts to science funding, limitations to facilities and indirect costs, and increased tariffs present an unprecedented challenge to the scientific research ecosystem, not just in the United States but around the world. As an organization that directly ...
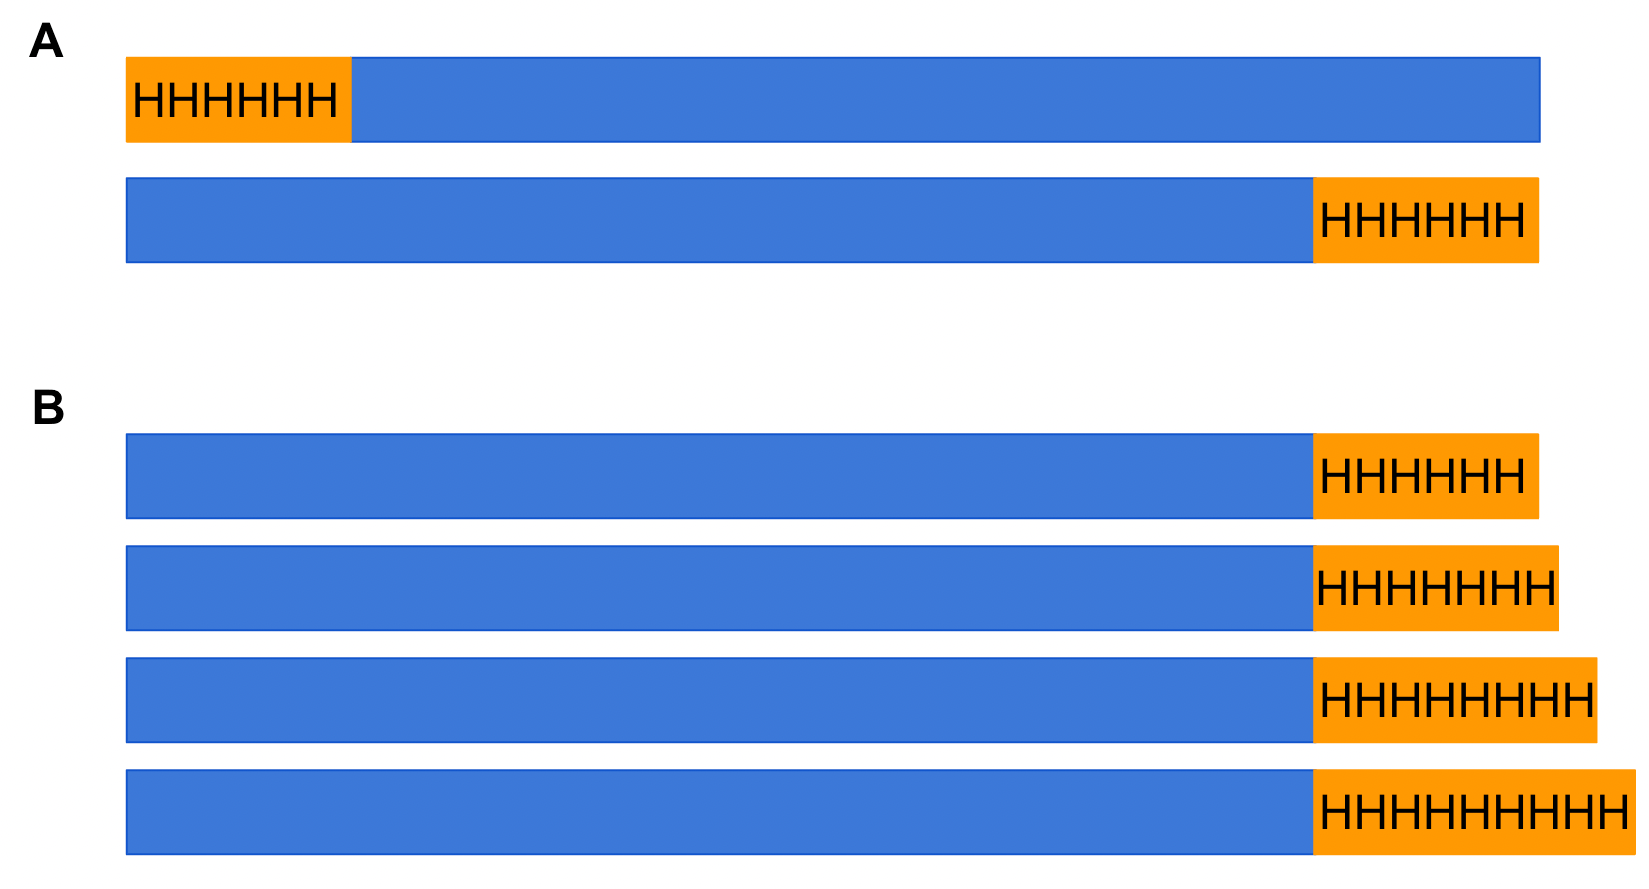
Ah, the notorious western blot: we meet again. So useful, yet so finicky to design and optimize. Today we’ll cover the normalization and loading controls needed for relative quantification of a western blot — and why you might want to be careful relying on so called ...
In our last post, we talked about the first base transversion editors: CGBEs, or C → G Base Editors. CGBEs first convert a cytosine (C) to uracil (U), just like Cytosine Base Editors (CBEs). But unlike CBEs, CGBEs then excise the U to create an abasic (empty) DNA site using ...
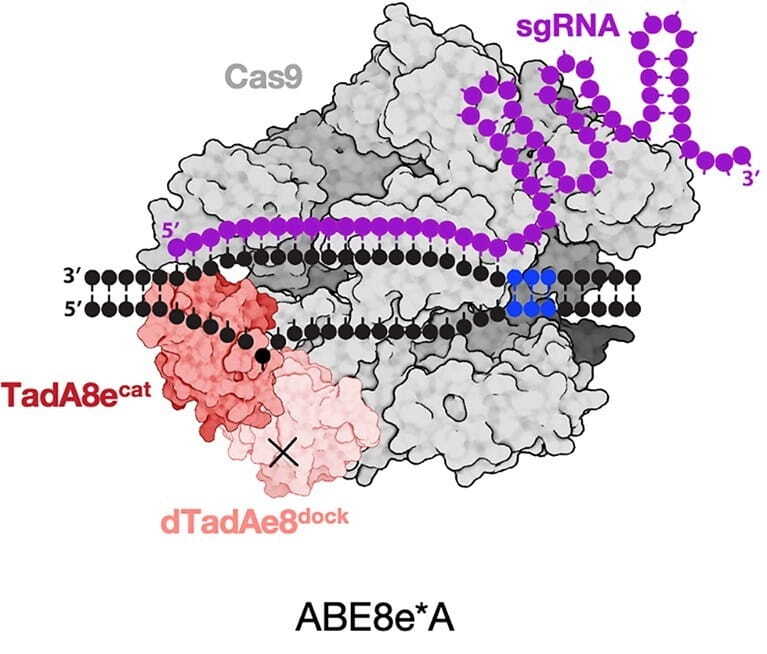
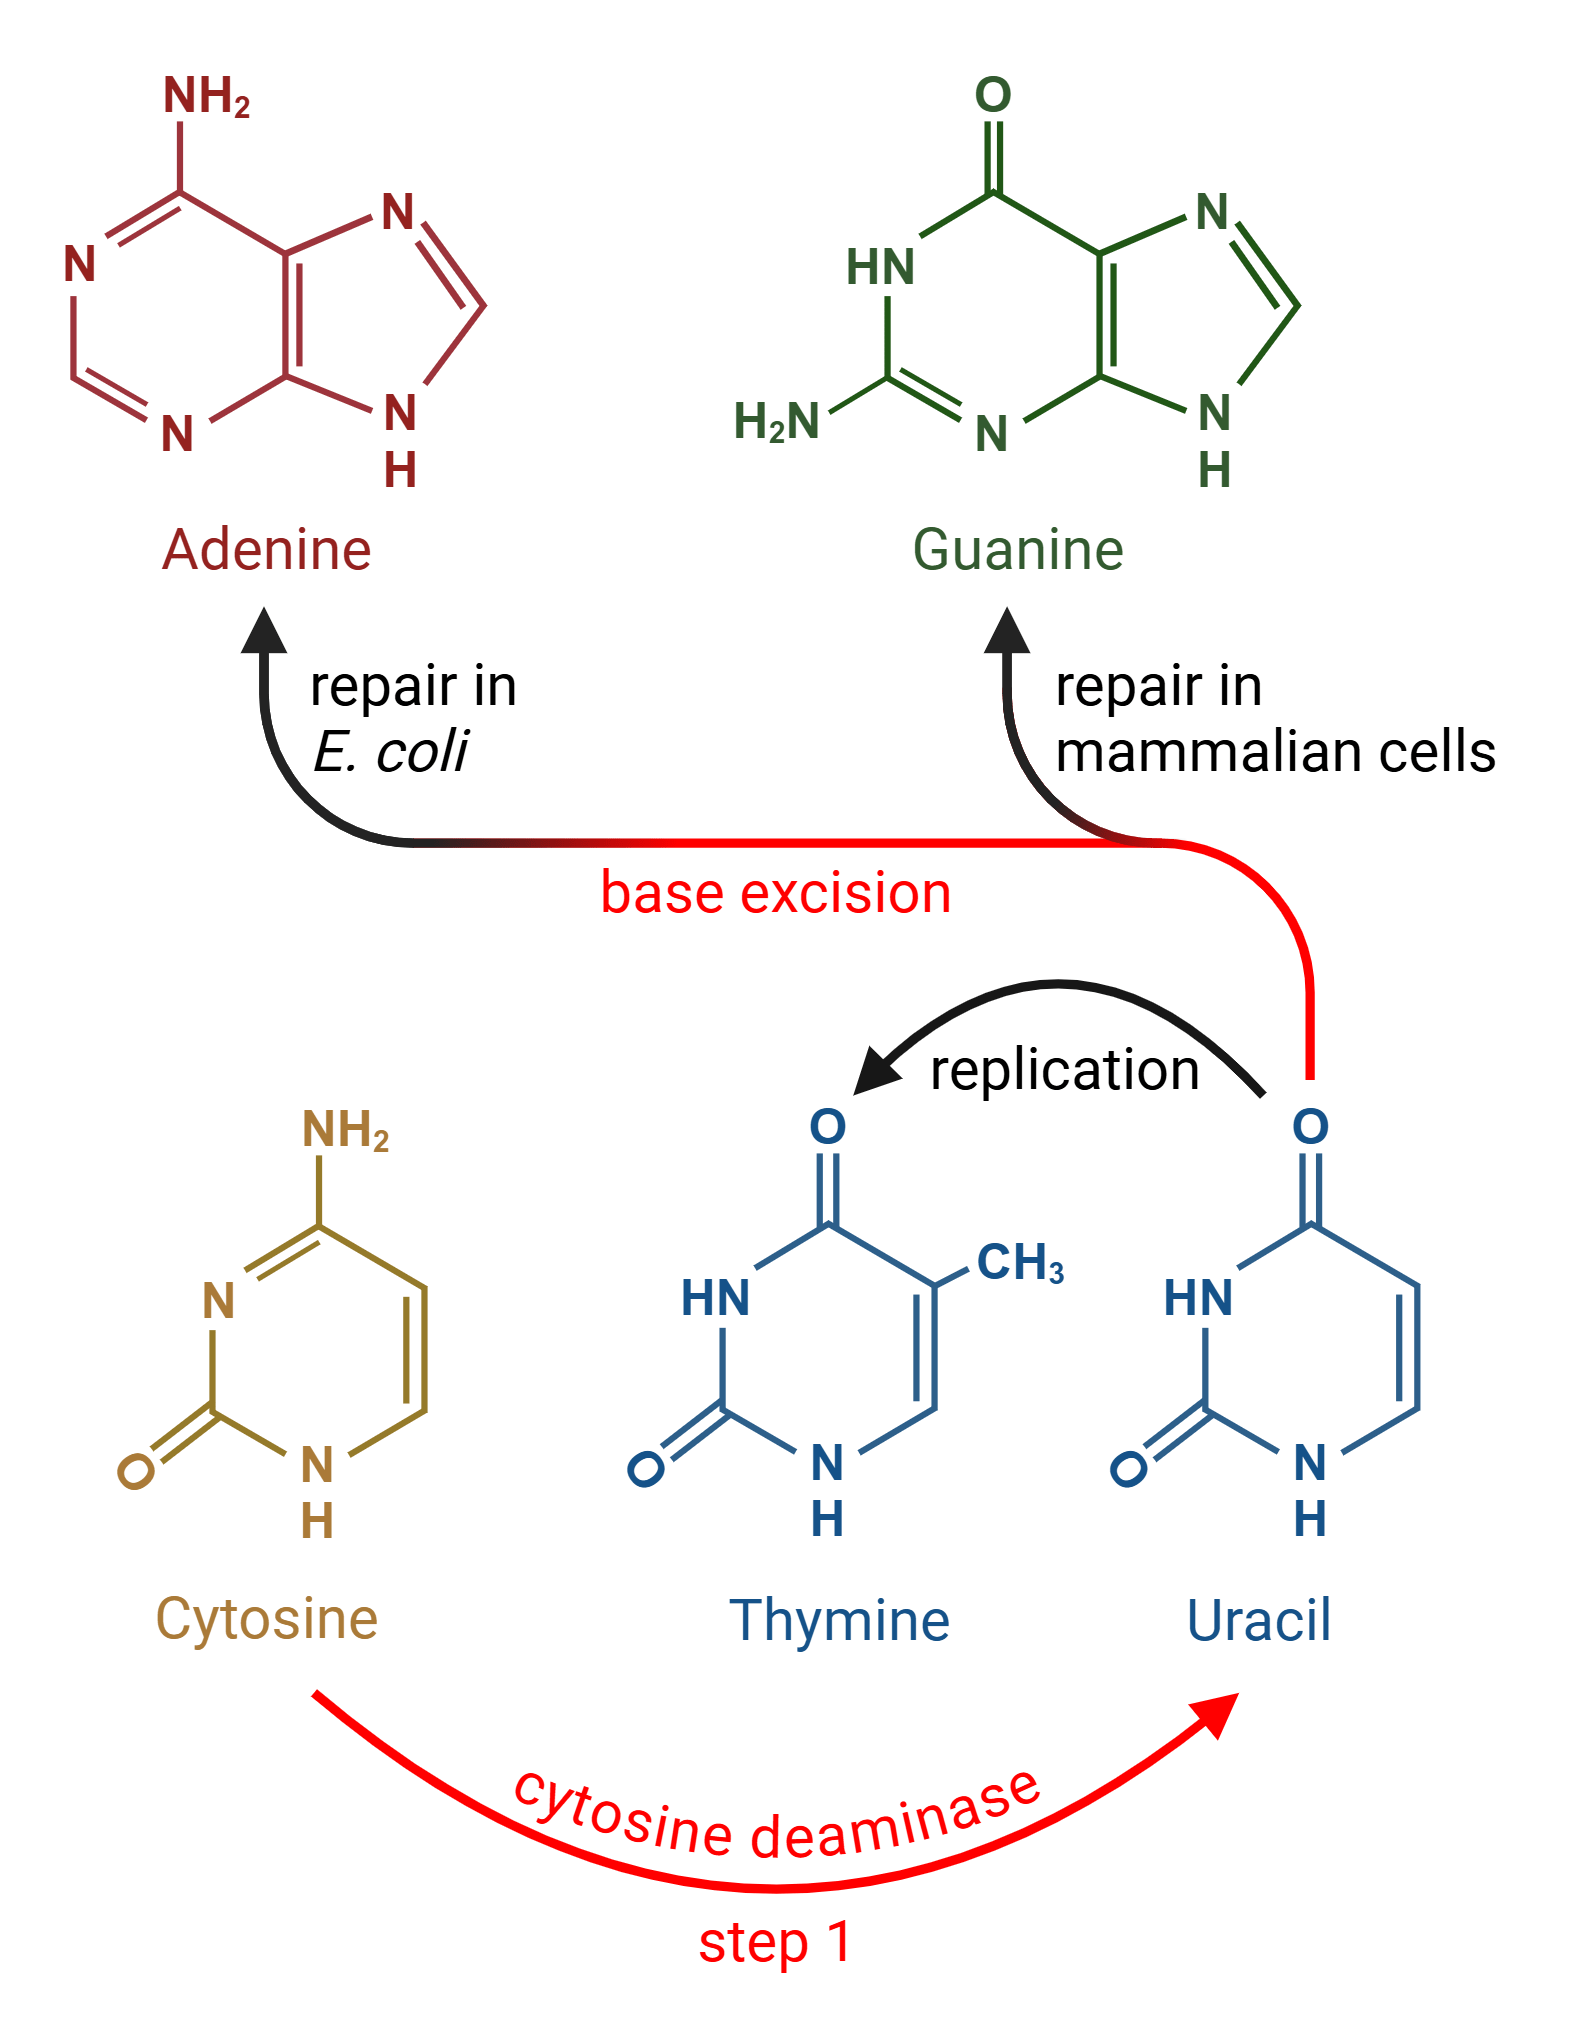
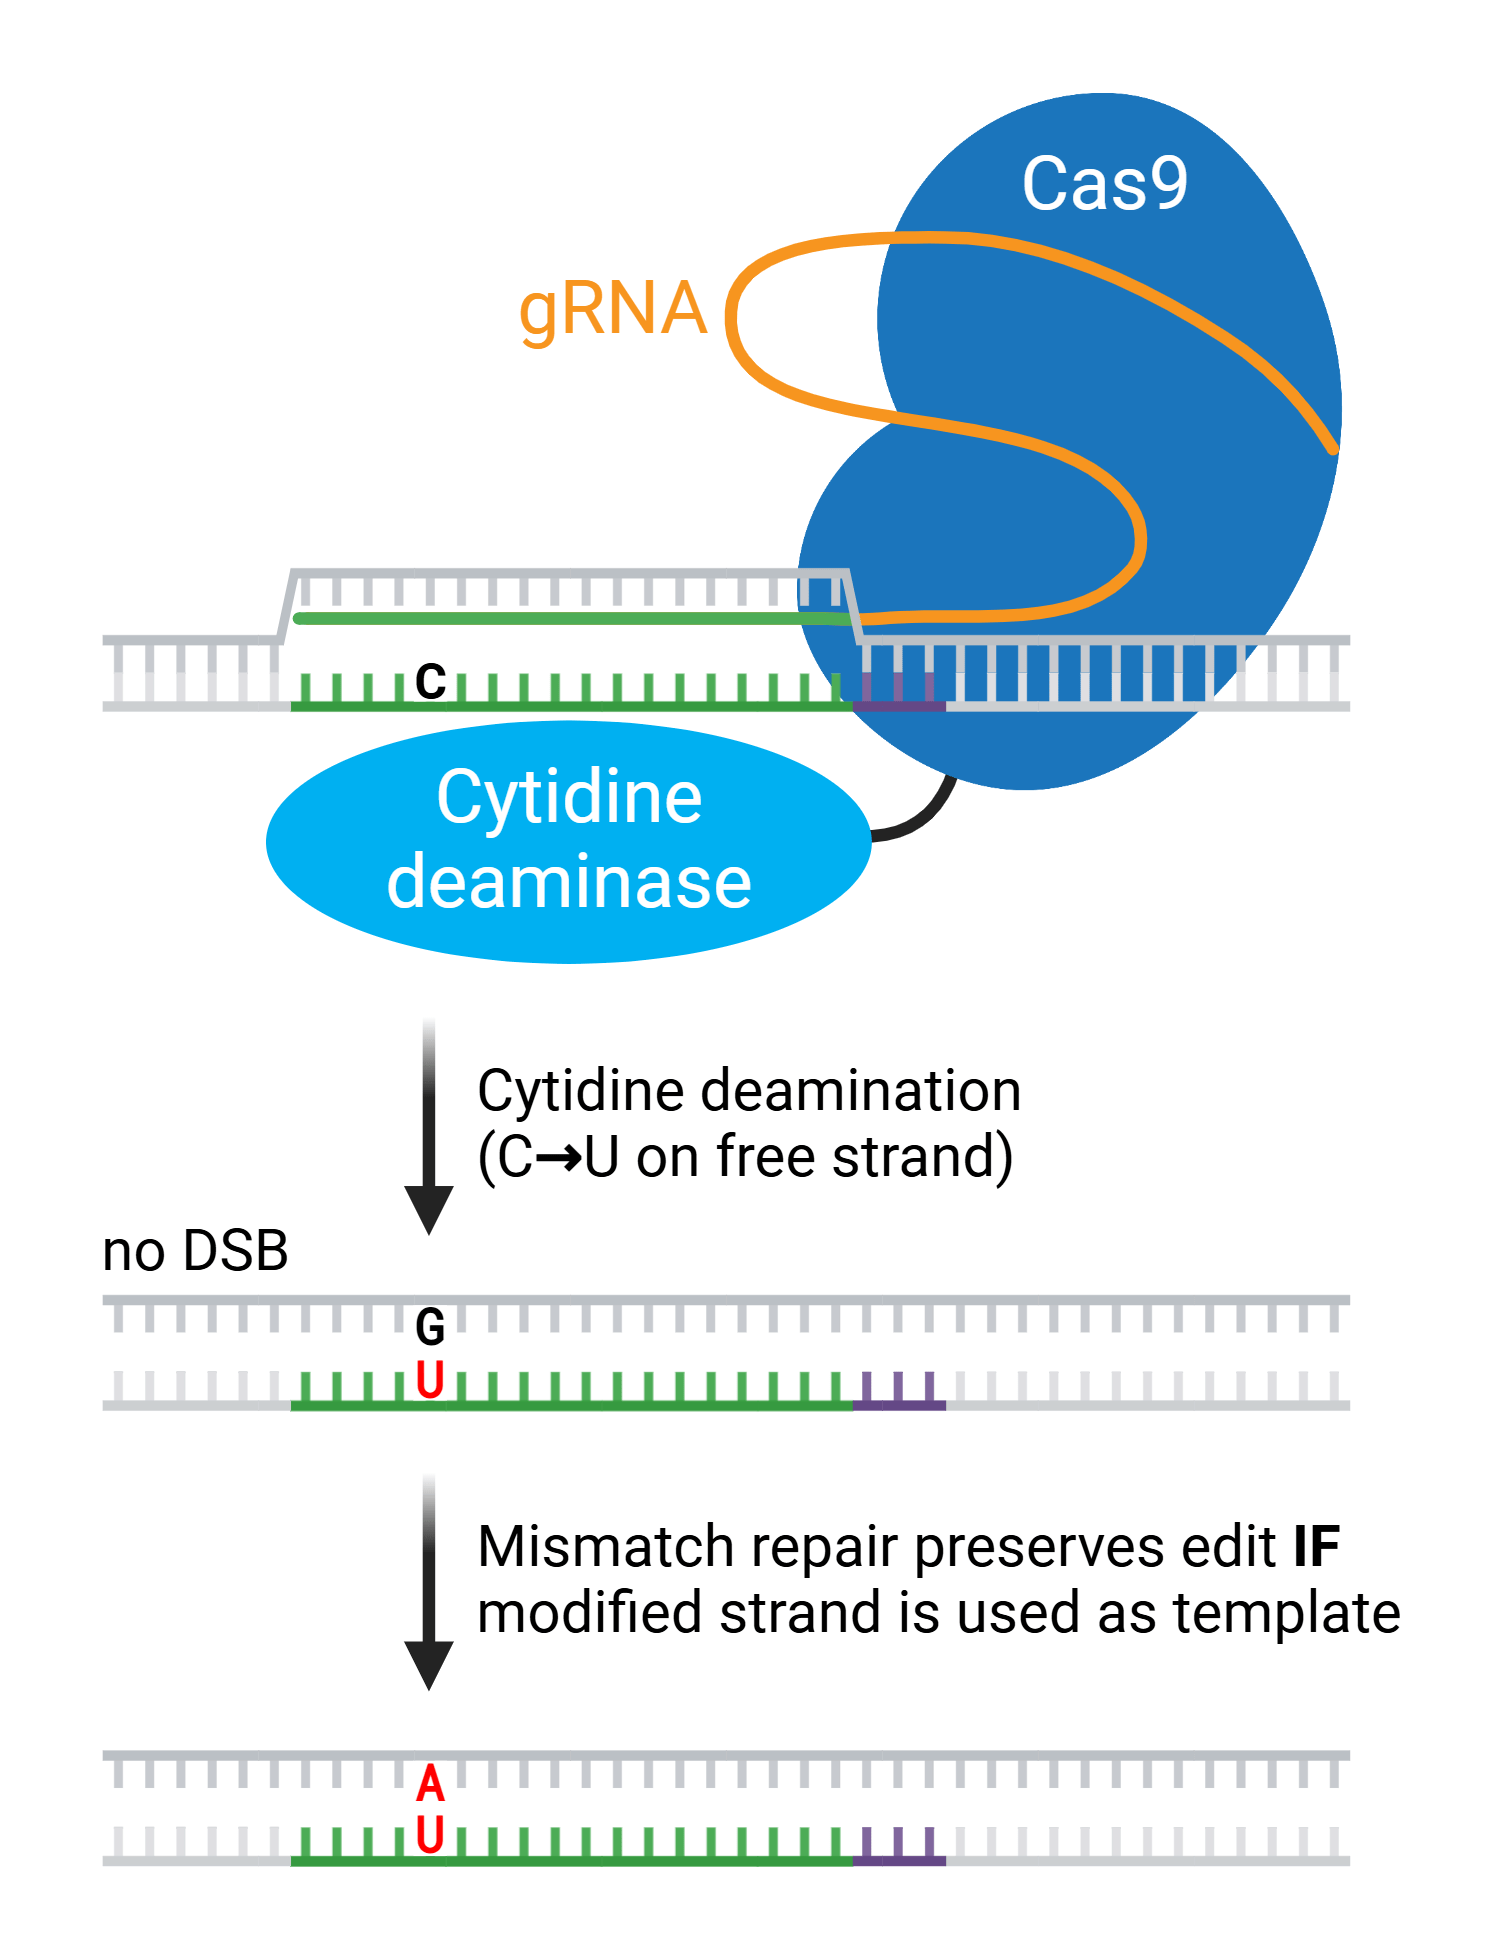
The first base editors revolutionized CRISPR gene editing. Cytosine base editors (CBEs) and adenine base editors (ABEs) chemically modify target bases without breaking the DNA backbone, making them efficient and precise tools for altering DNA sequences. These first base editors ...
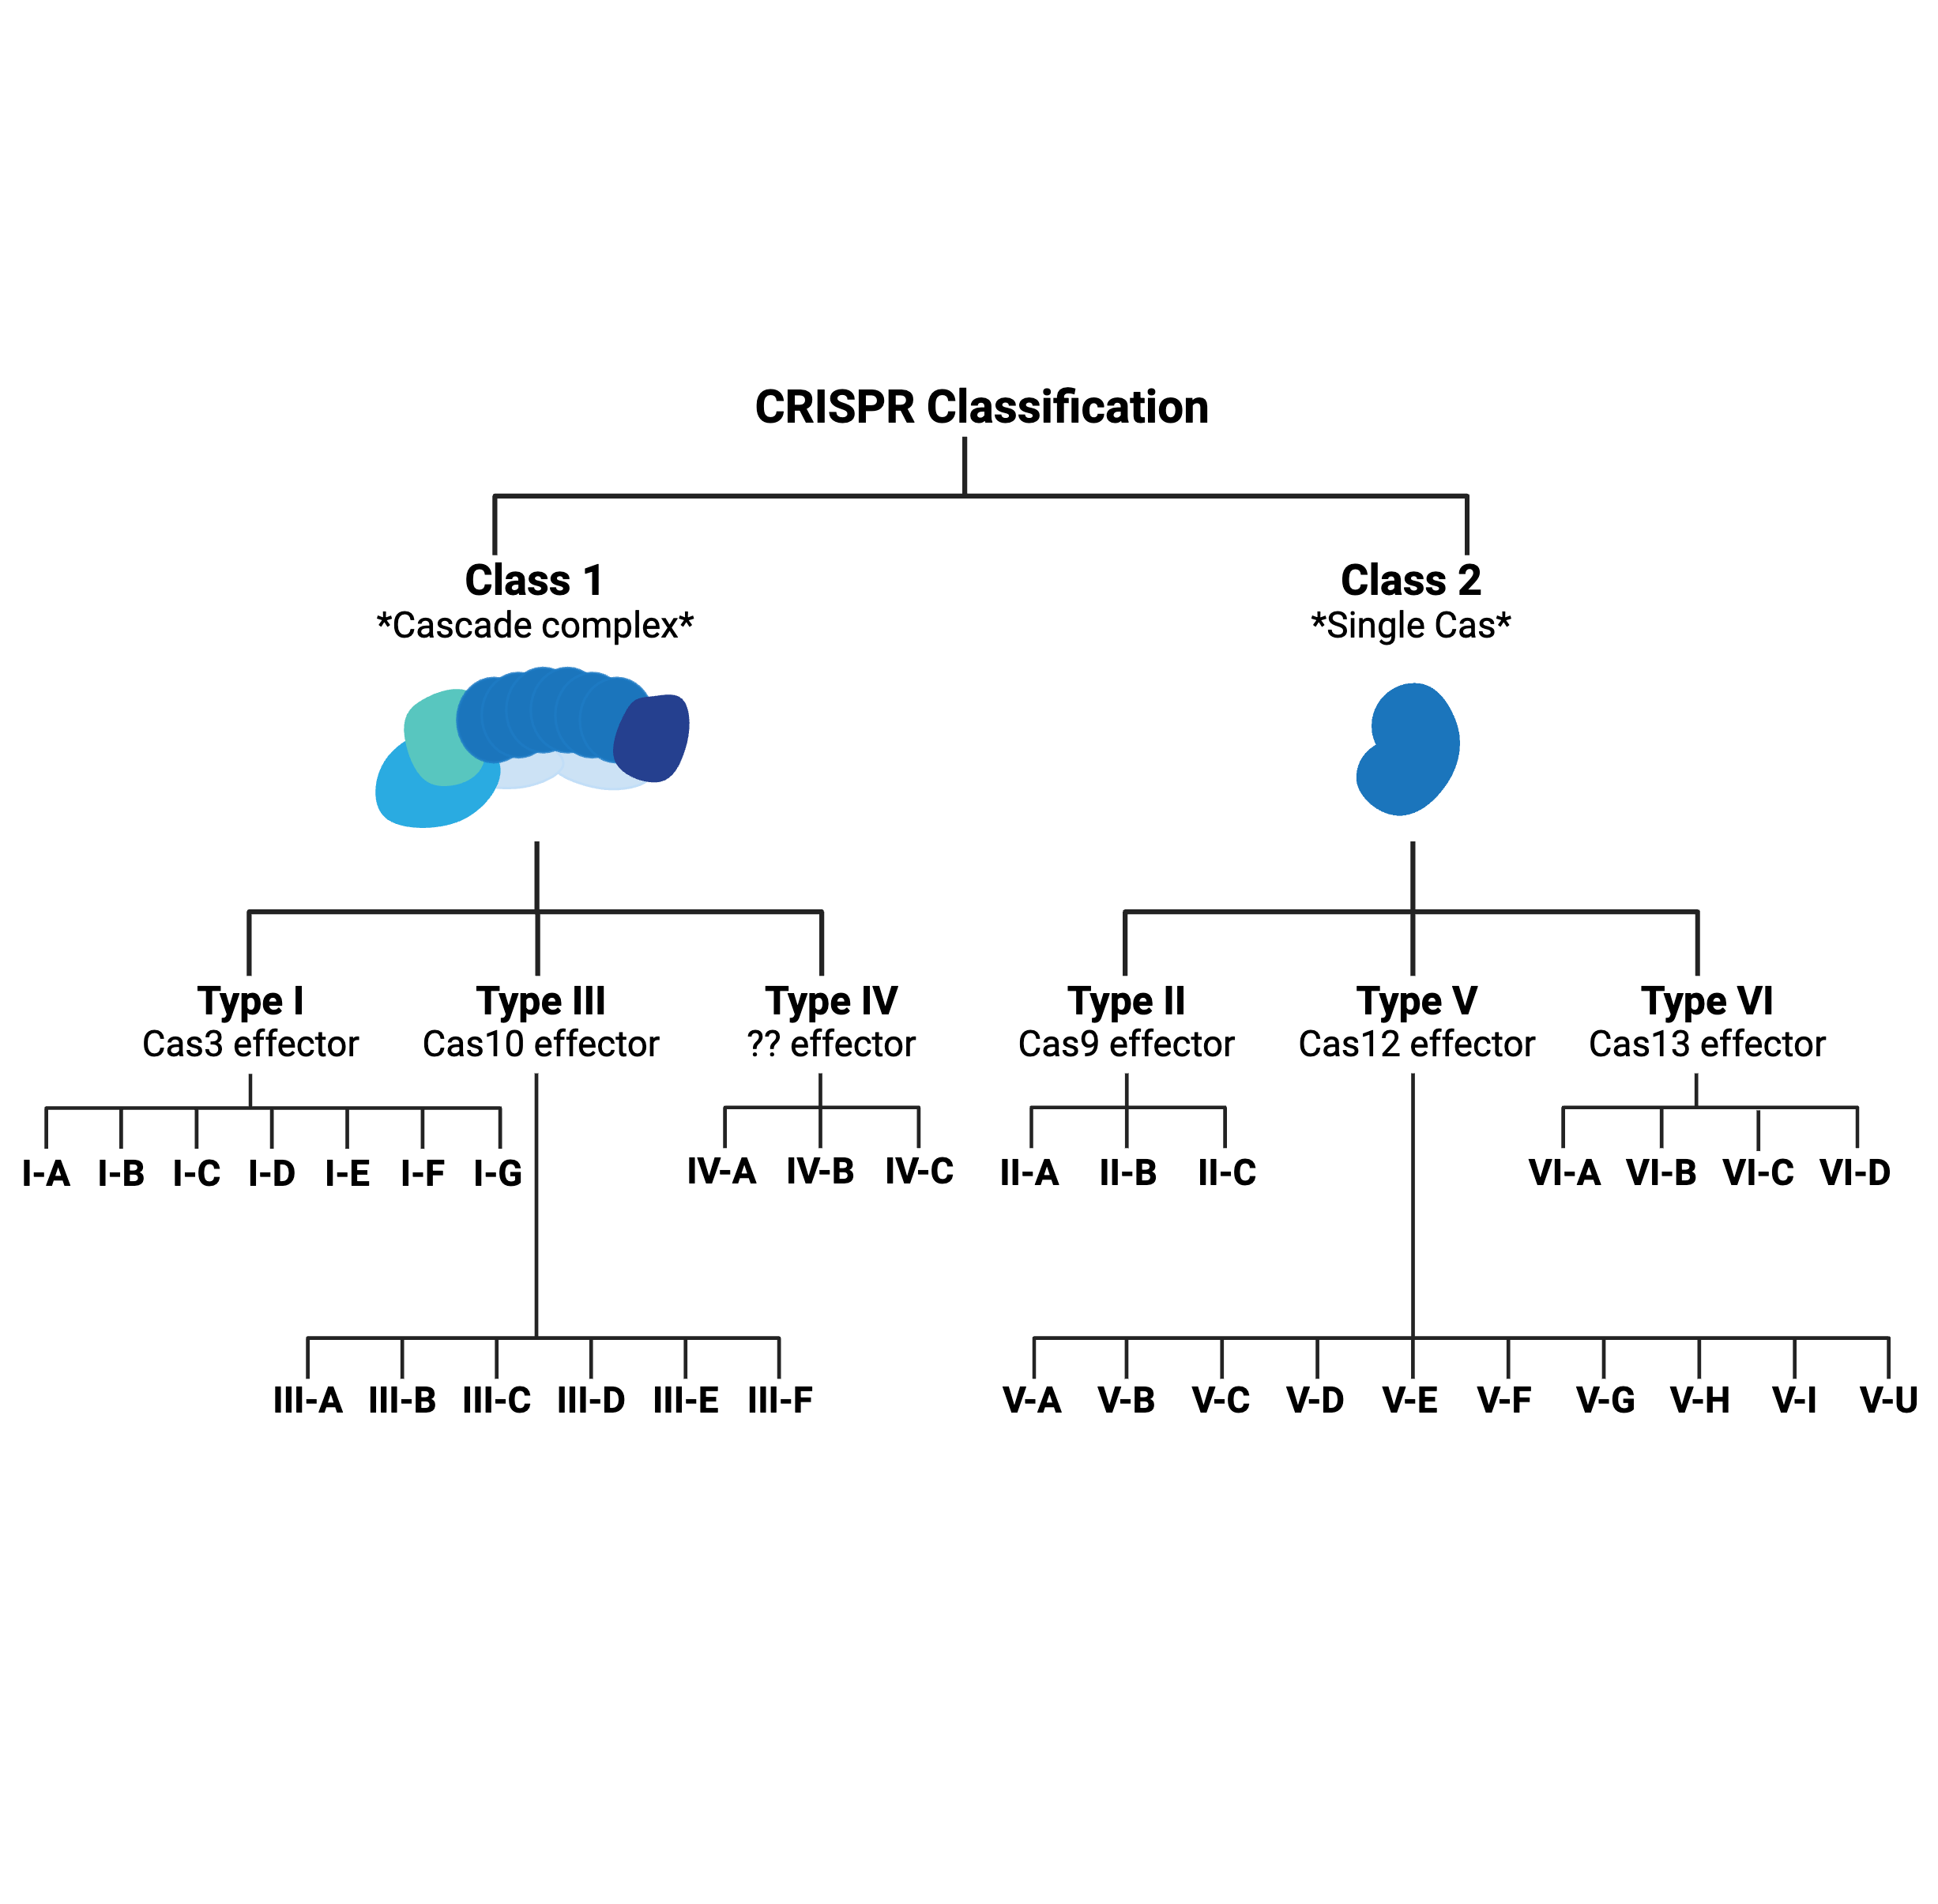
What’s in a type? That which we call CRISPR, by any other name would…probably still edit genomes.
Every few months, we highlight some of the new plasmids, antibodies, and viral preps in the repository through our Hot Plasmids articles.
Twenty years of accelerating scientific discovery. Over 150,000 plasmids empowering researchers worldwide. Countless breakthroughs enabled by shared resources. As we step into 2025, these milestones remind us of the extraordinary impact that happens when scientists come together ...
Early CRISPR applications were often limited by the low editing efficiency of homology-directed repair (HDR), the pathway for resolving DNA double-strand breaks (DSBs) preferred by researchers. Compared to non-homologous end joining (NHEJ), HDR occurs at a relatively low ...
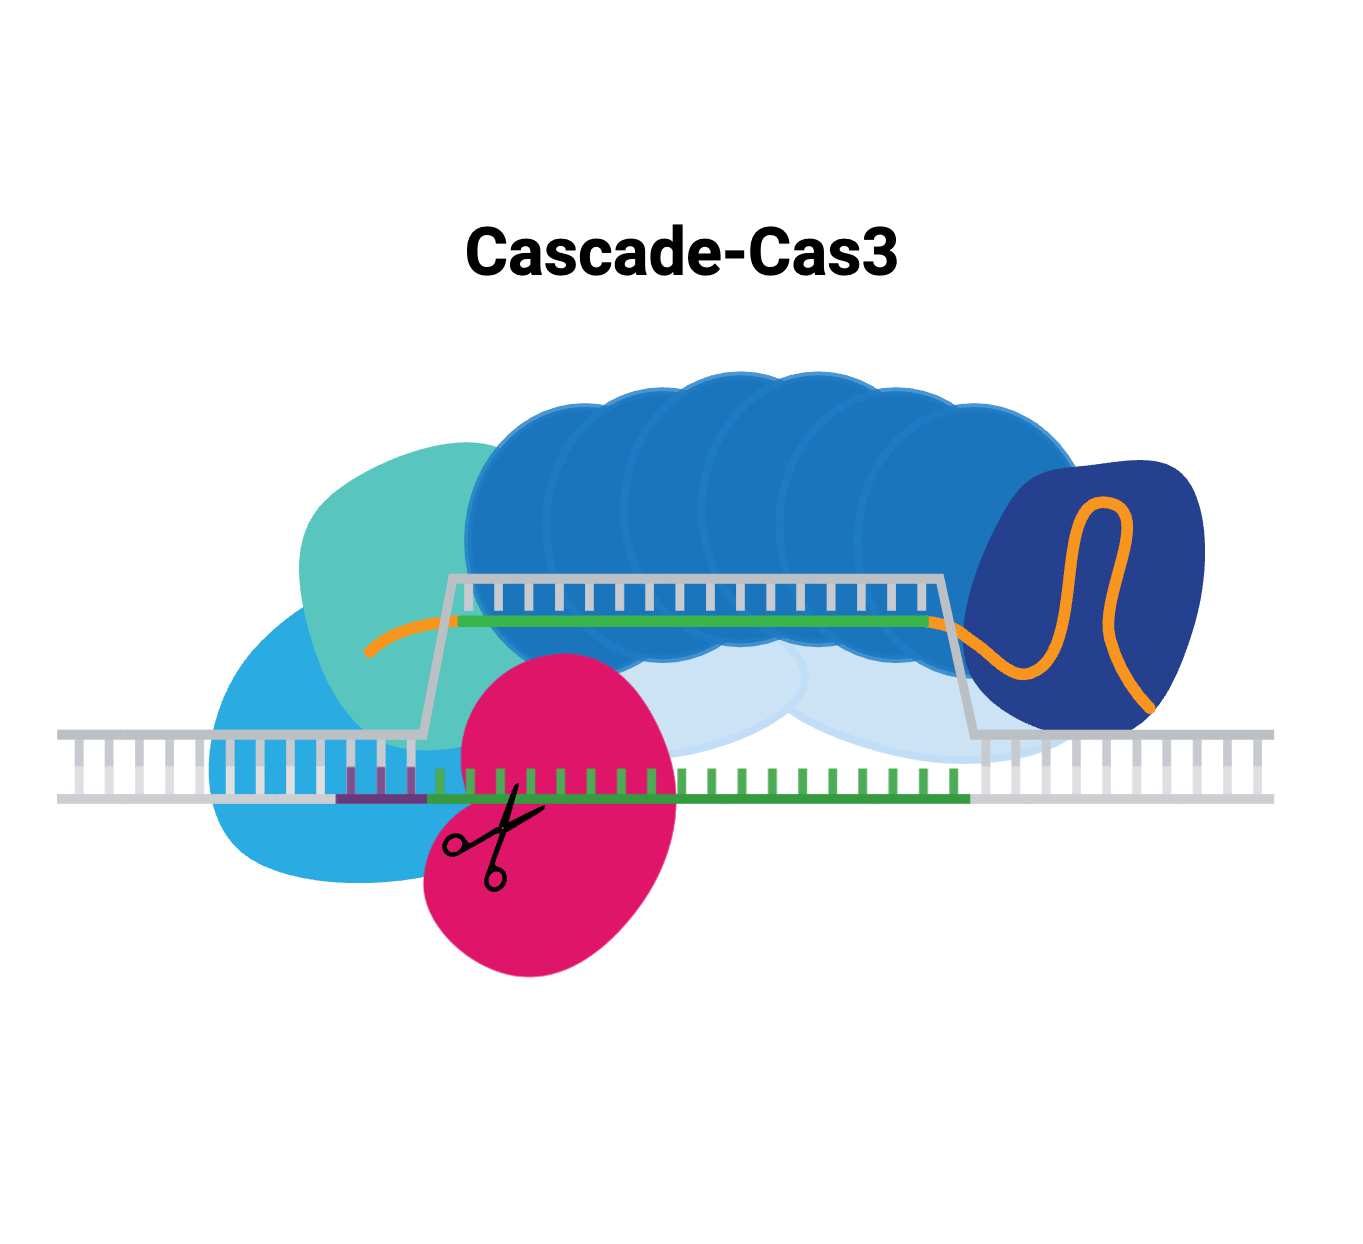
The versatility of CRISPR allows you to play with DNA in a number of ways, from small edits that change single base pairs, to chromosomal inversions and large deletions. Many of these methods rely on Cas9 or a derivative of Cas9, but the ever-expanding repertoire of CRISPR has ...
If you're an international researcher who uses plasmids containing genes from rabies and vesicular stomatitis virus, you may have noticed it’s been easier to order these plasmids. This is because in 2024 certain export control exceptions were made by the US Bureau of Industry ...
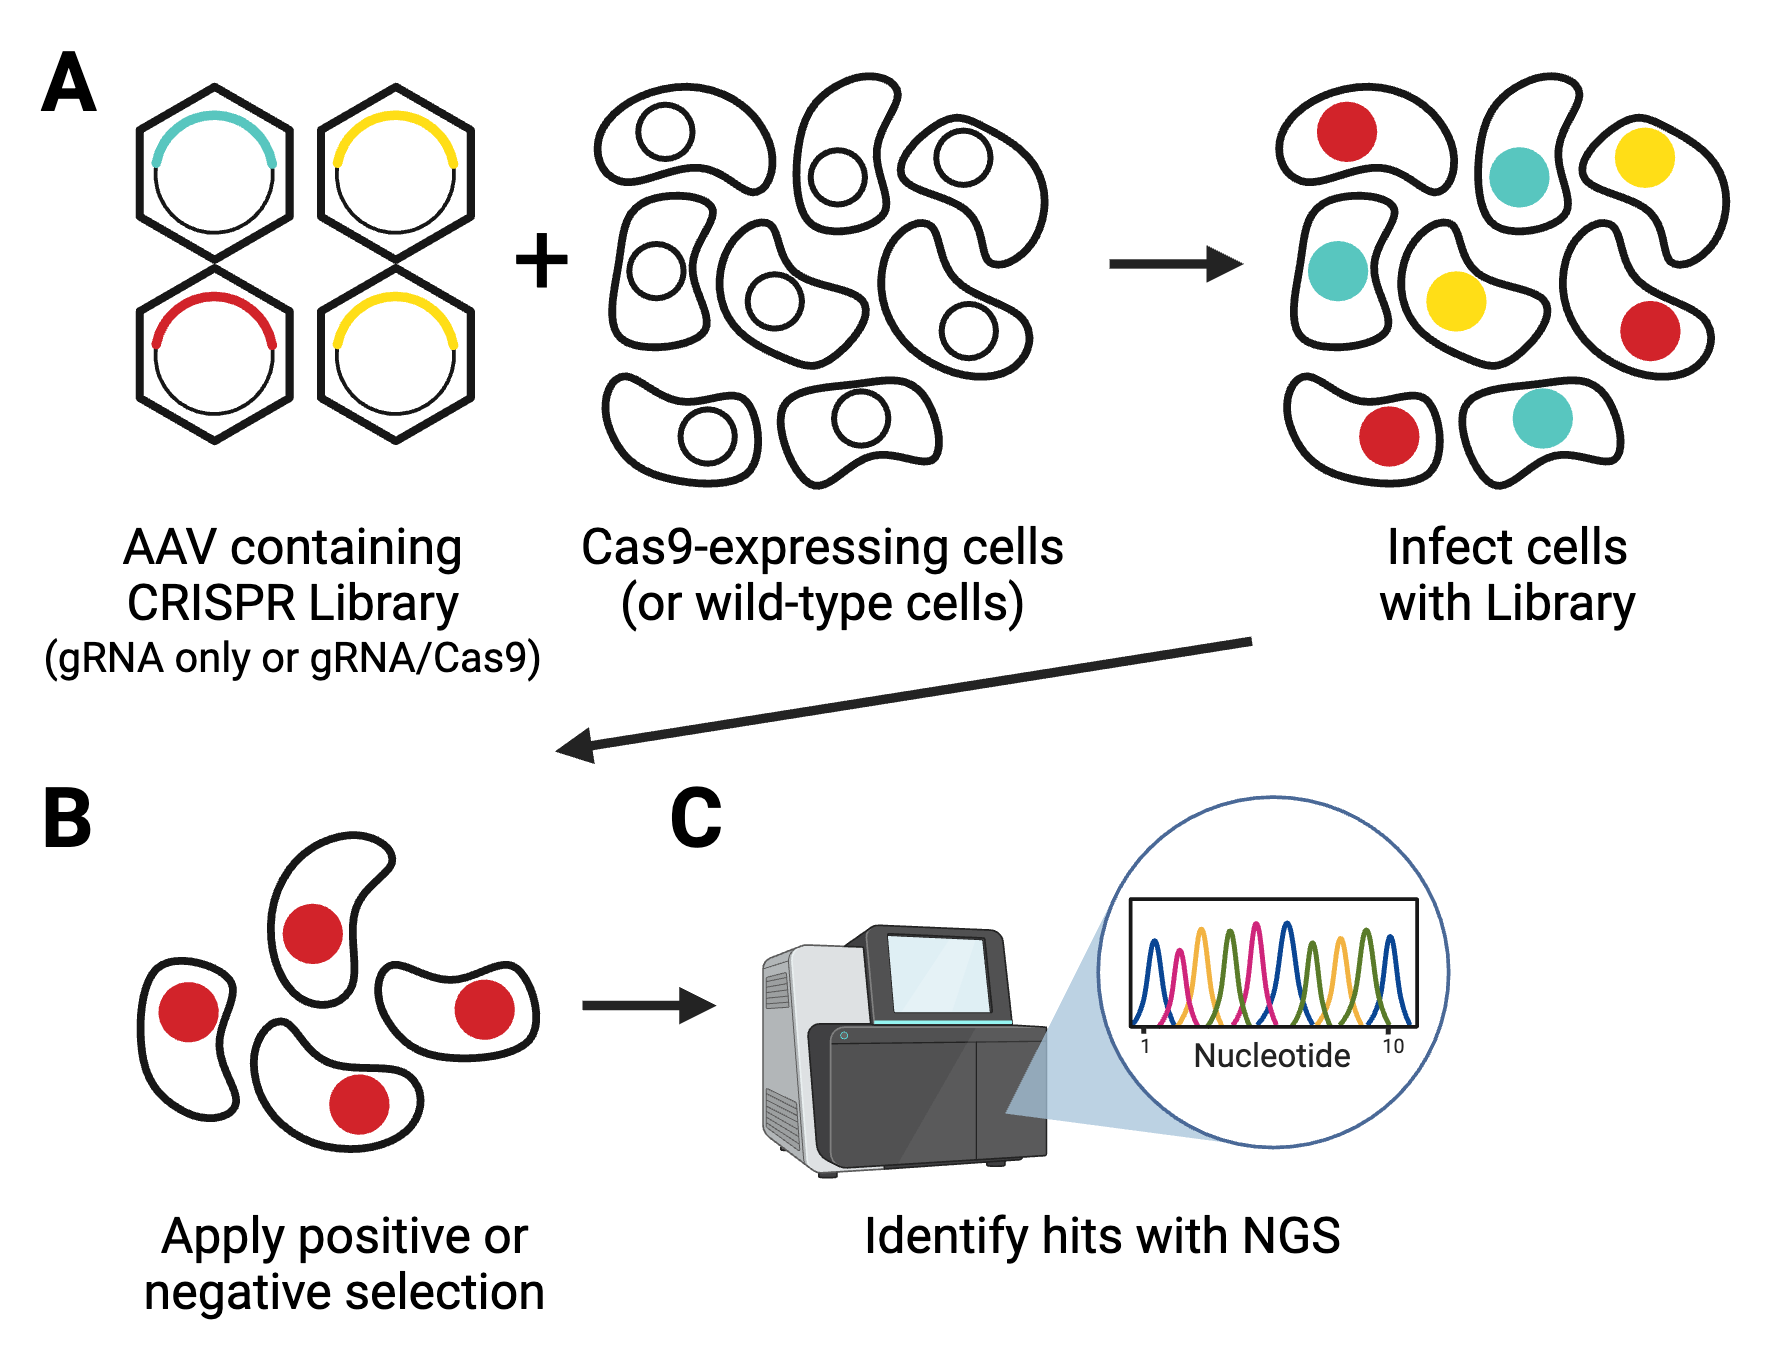
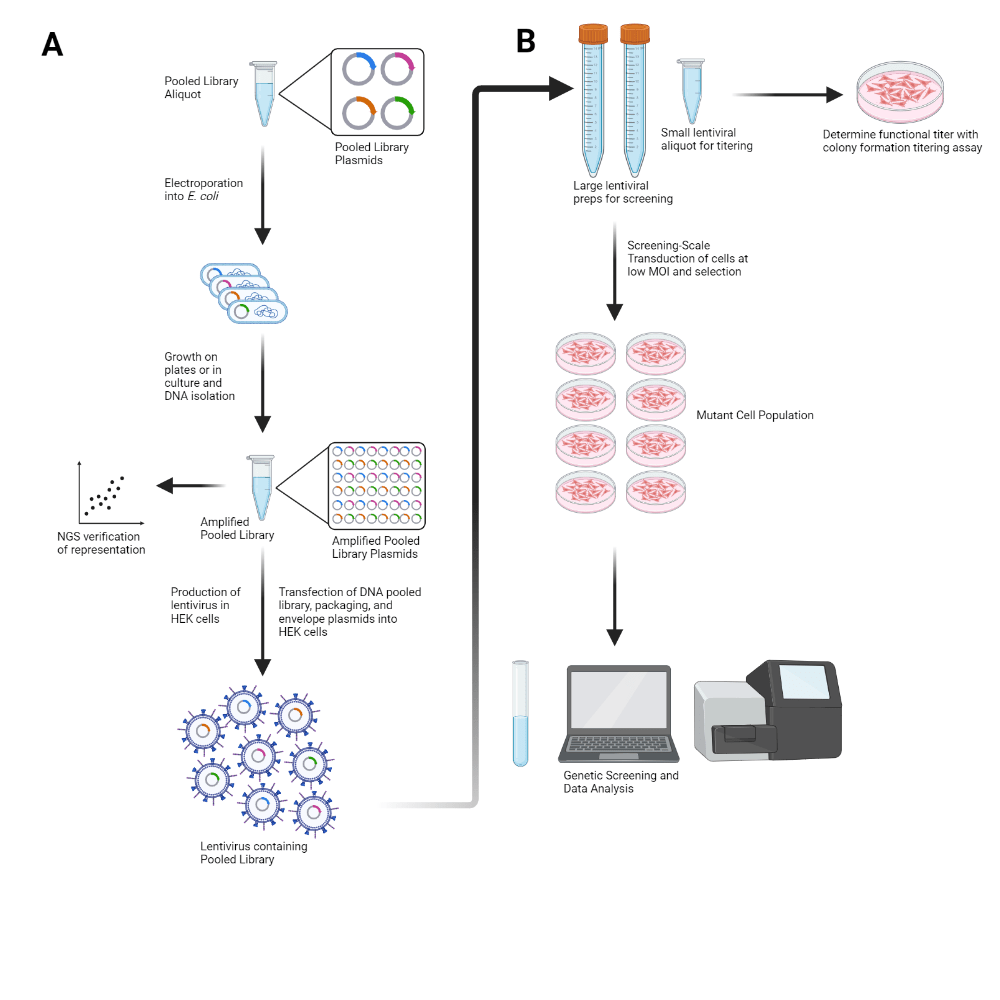
Forward genetics screens are a valuable part of the molecular biology toolbox to identify new target genes for drug discovery or to understand the intricacies of molecular pathways. These screens have gotten larger, easier, and more comprehensive thanks to the consistent ...
Bundling up for winter? The weather outside might be frightful, but browsing the 49 new preps available in the Addgene viral vector repository with a nice cup of hot chocolate is absolutely delightful. Grab a hot beverage and a blanket, then scroll on for some wintery delights!
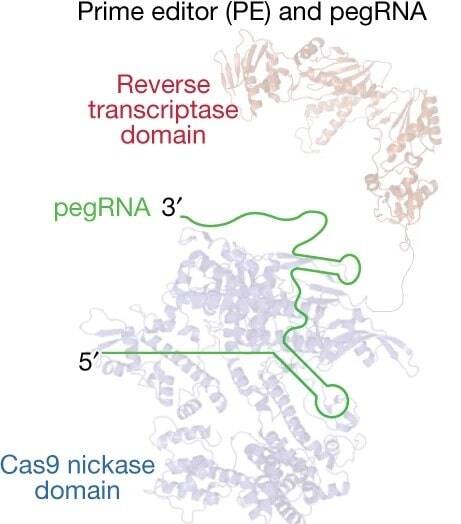
We recently updated our blog post on Prime Editing, and that meant rereading many of the original papers reporting various prime editing tools. These papers are chock full of great tips to guide your experimental design, especially the design of the RNA sequences you’ll use in ...
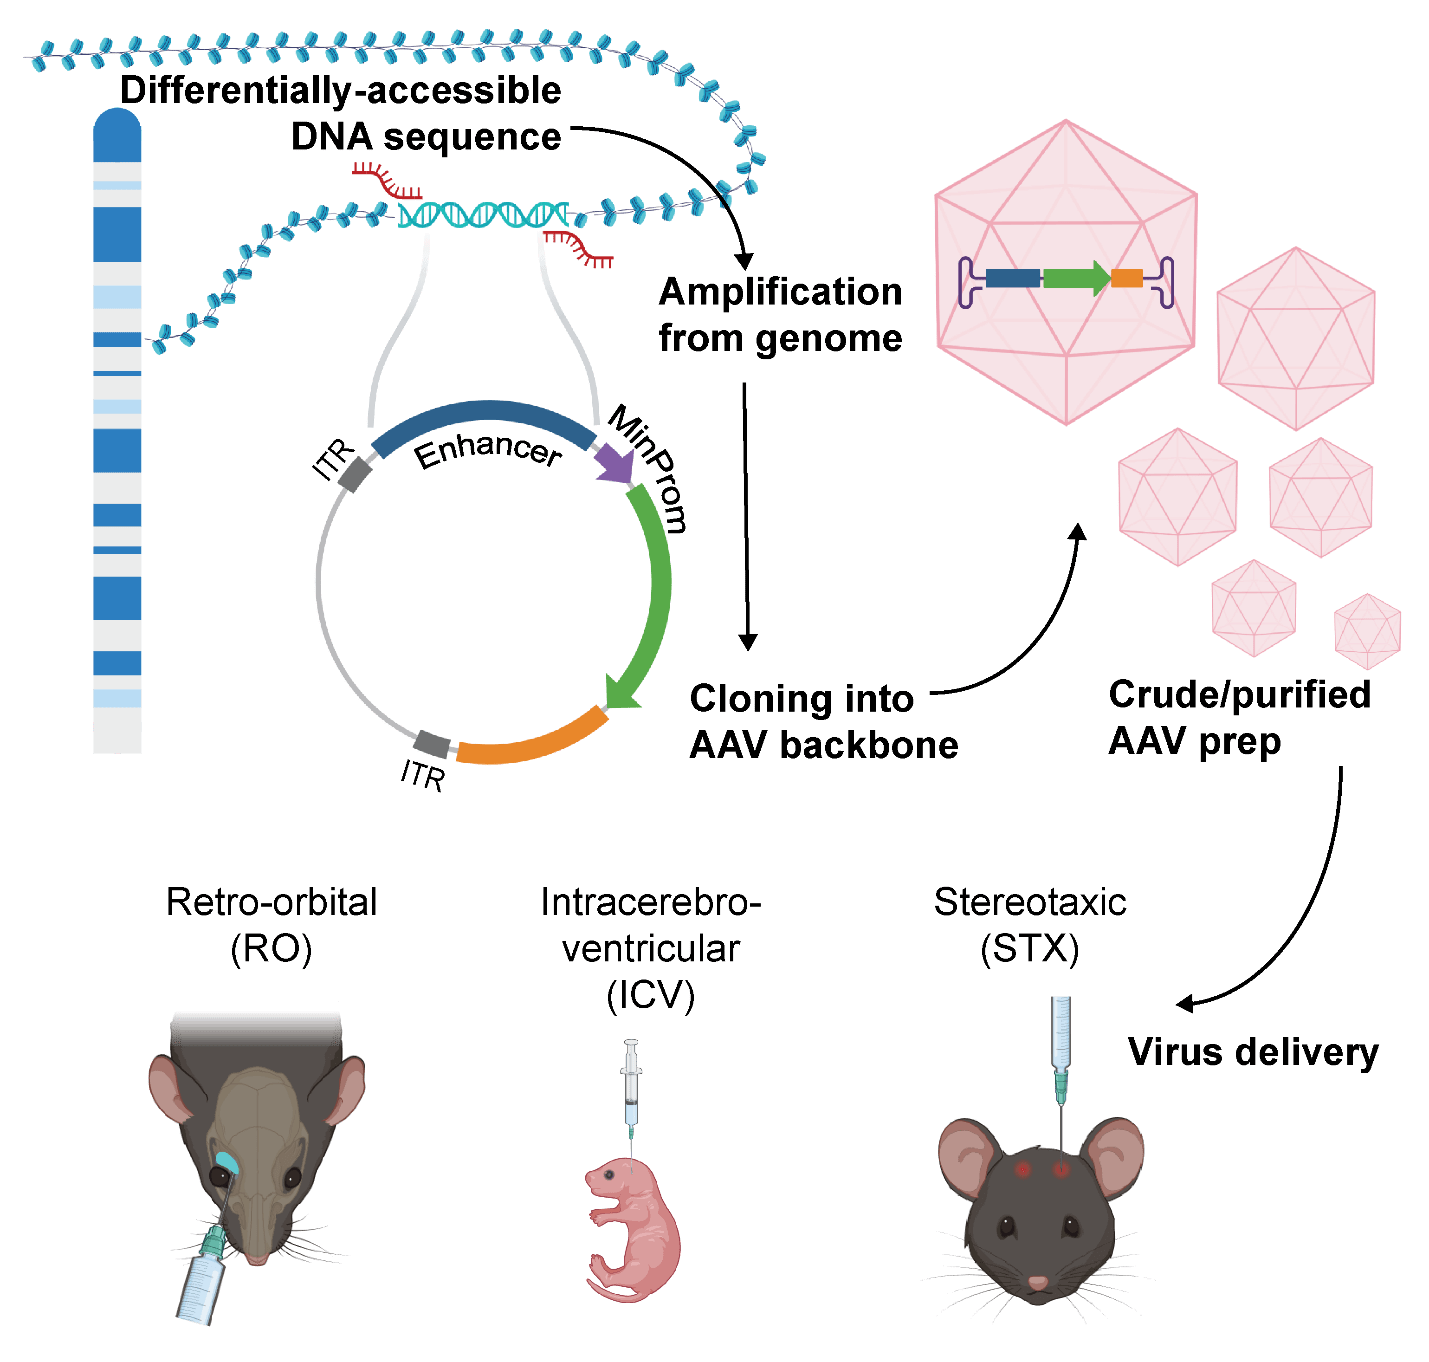
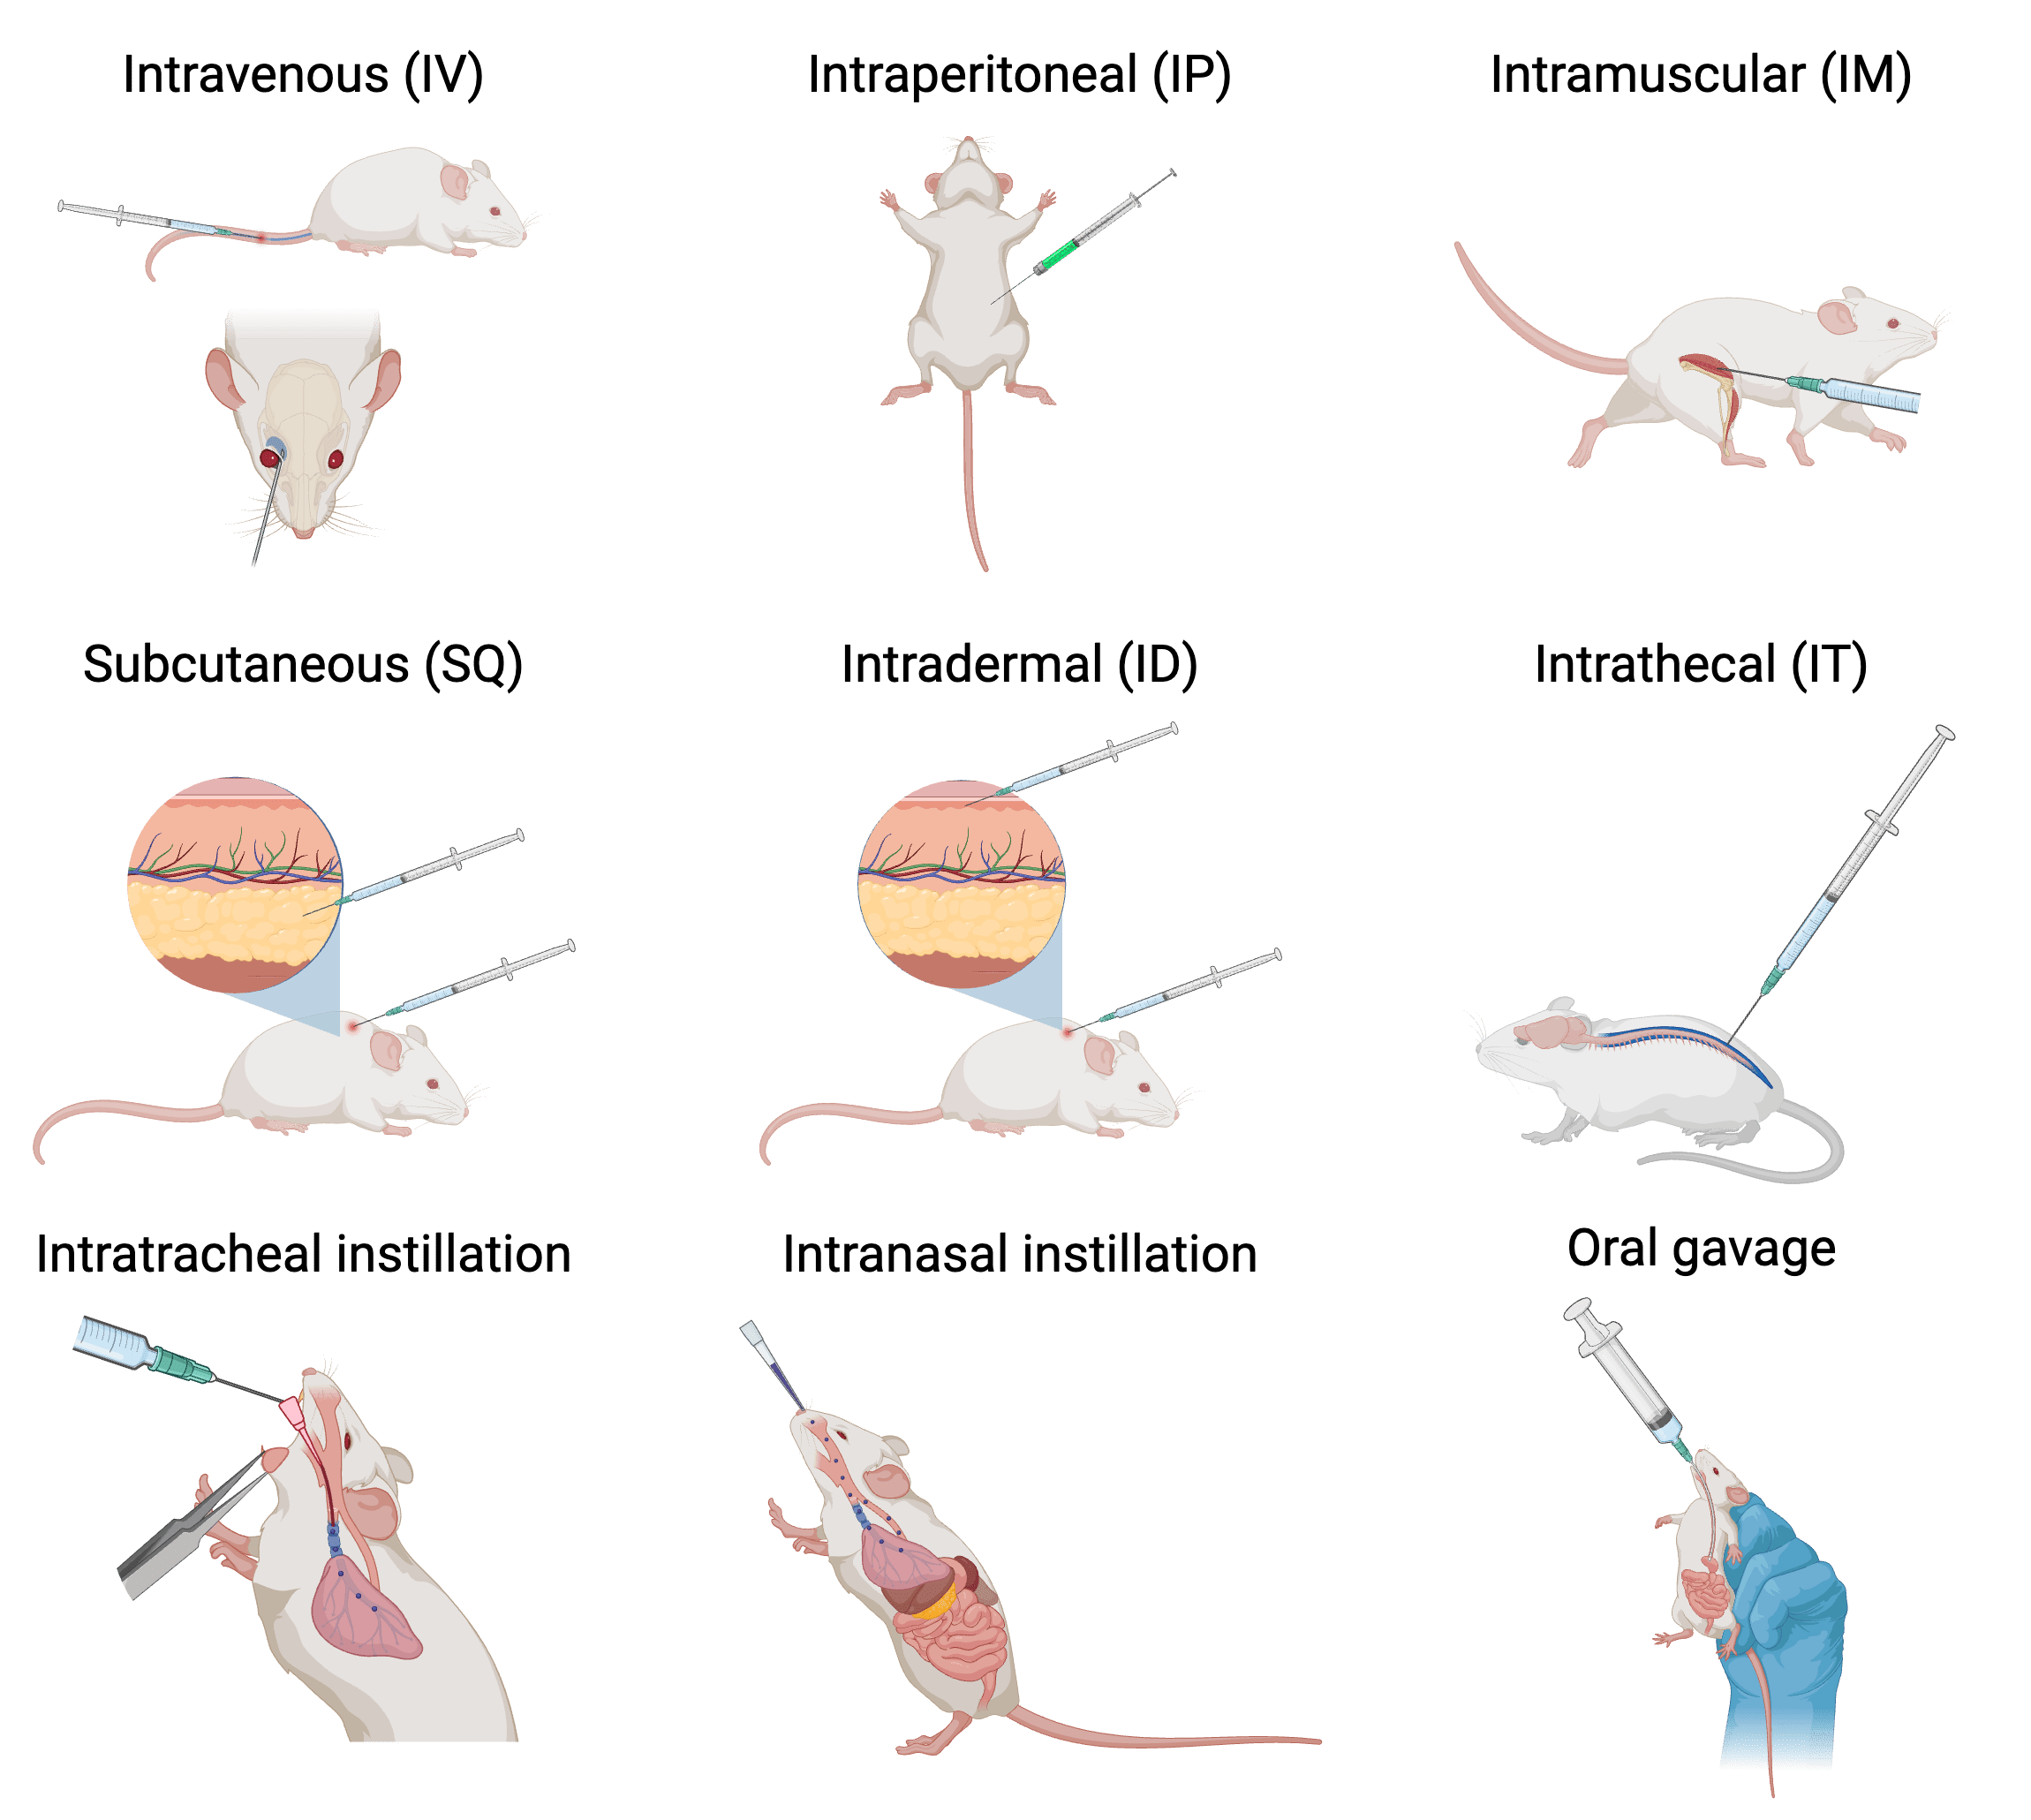
Injections in mice are a day-to-day task for many labs. Deciding which type of injection to use depends on a number of factors. You have to weigh the pros and cons of various methods and choose what is best for you — and the mice. While not an exhaustive list, these can include ...
One of the most pivotal decisions many PhDs face when transitioning from academia to industry is whether to stay hands-on in the lab or pivot to a managerial role. For those contemplating the leap into management, the journey can be as exciting as it is challenging.
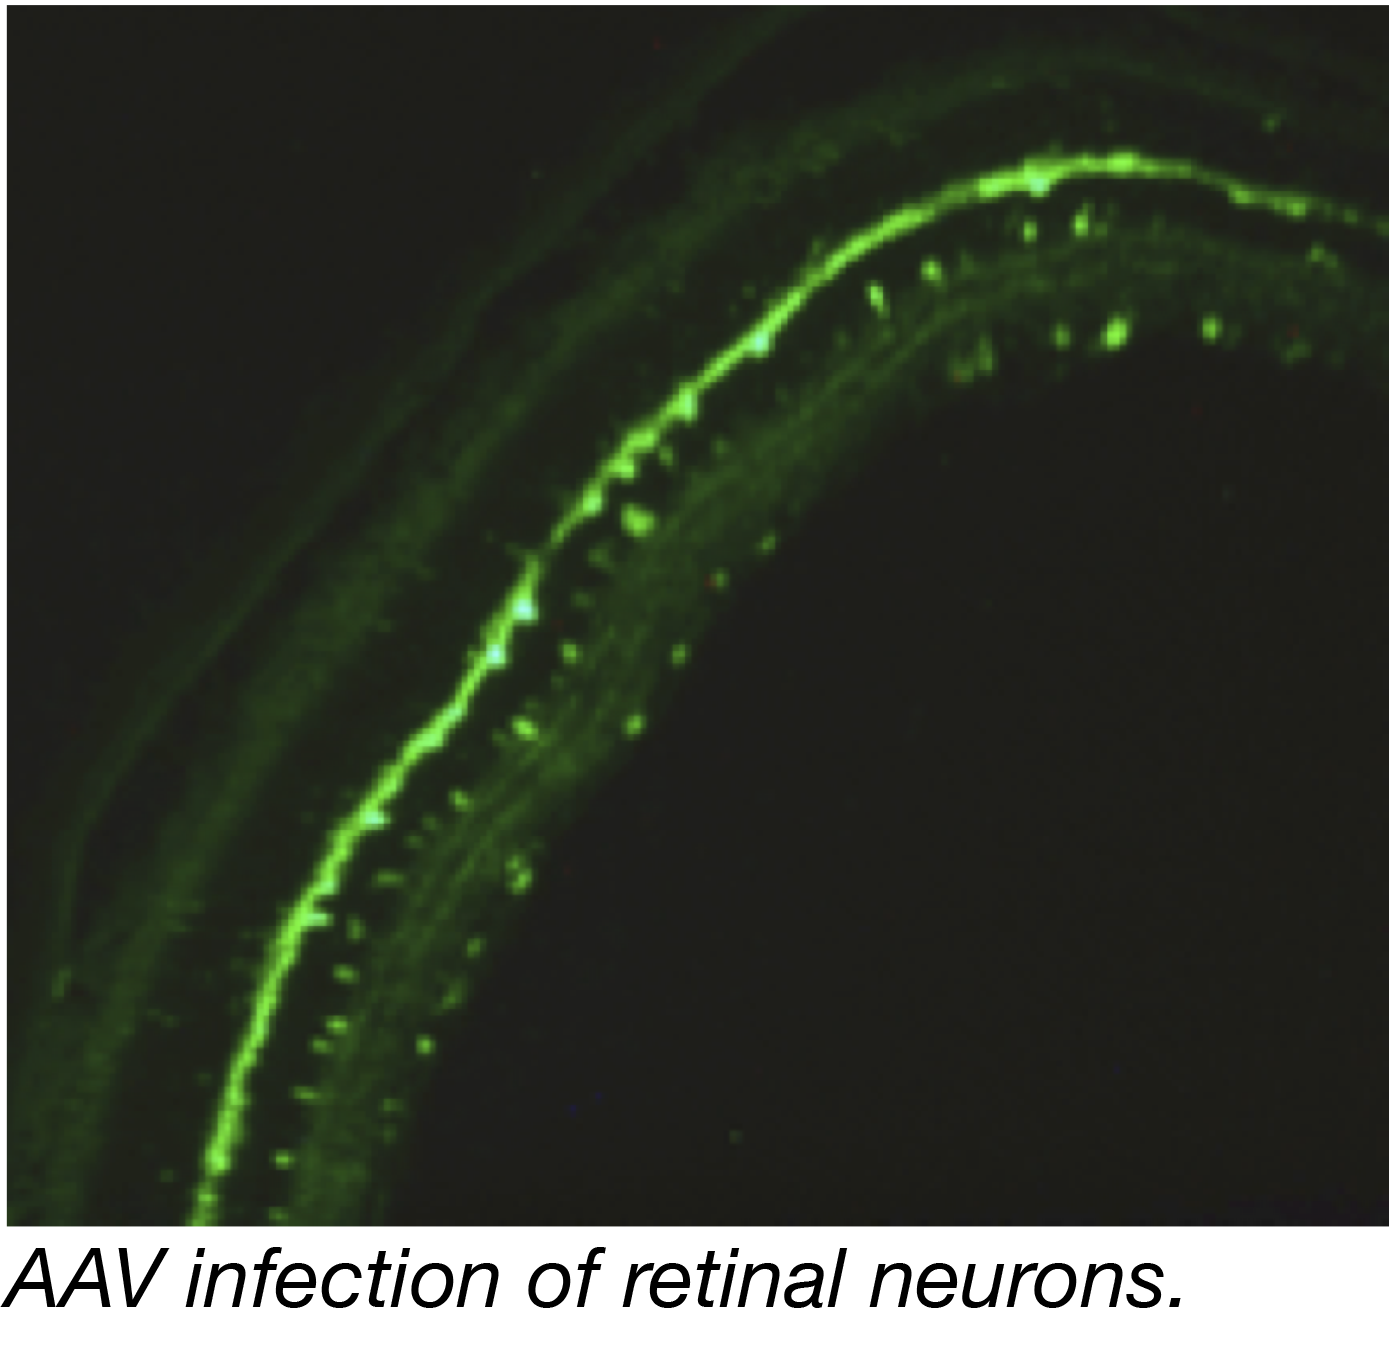
A viral vector that can target specific tissues, even when administered systemically, without causing disease? Recombinant adeno-associated viral vectors, or rAAVs, can sound almost too good to be true! In a previous post, we covered systemic capsids, which allow AAVs to broadly ...
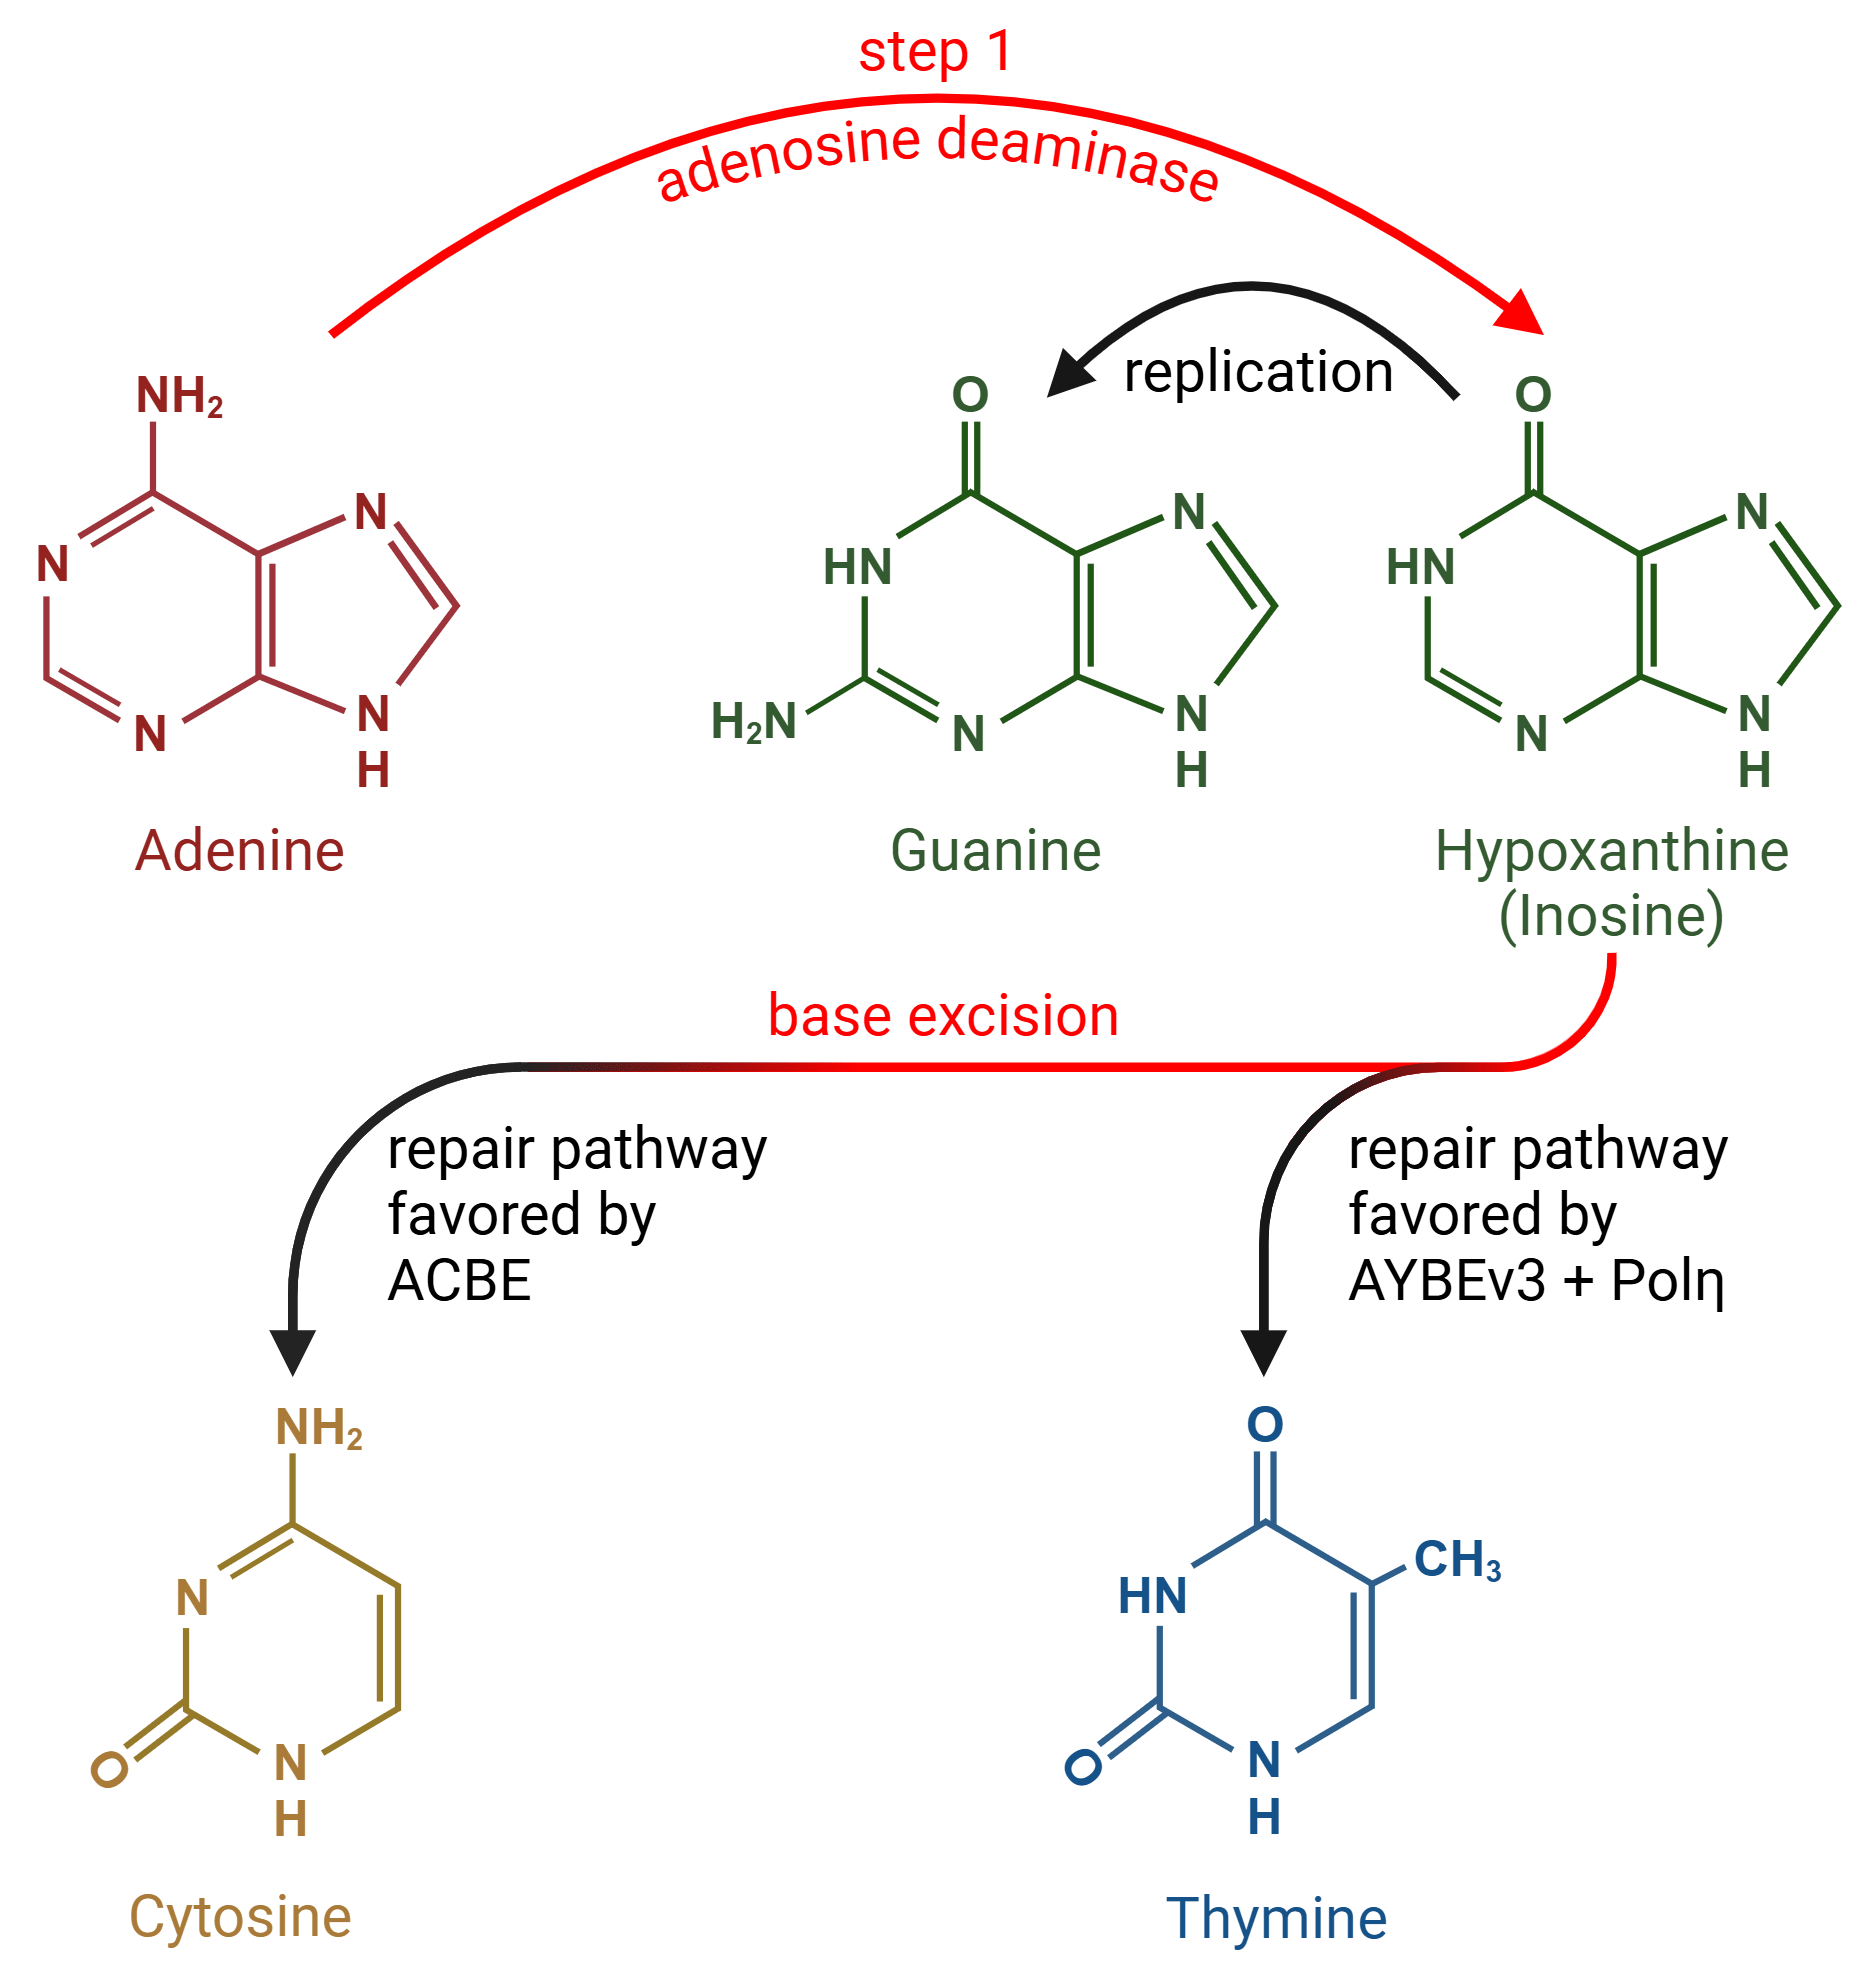
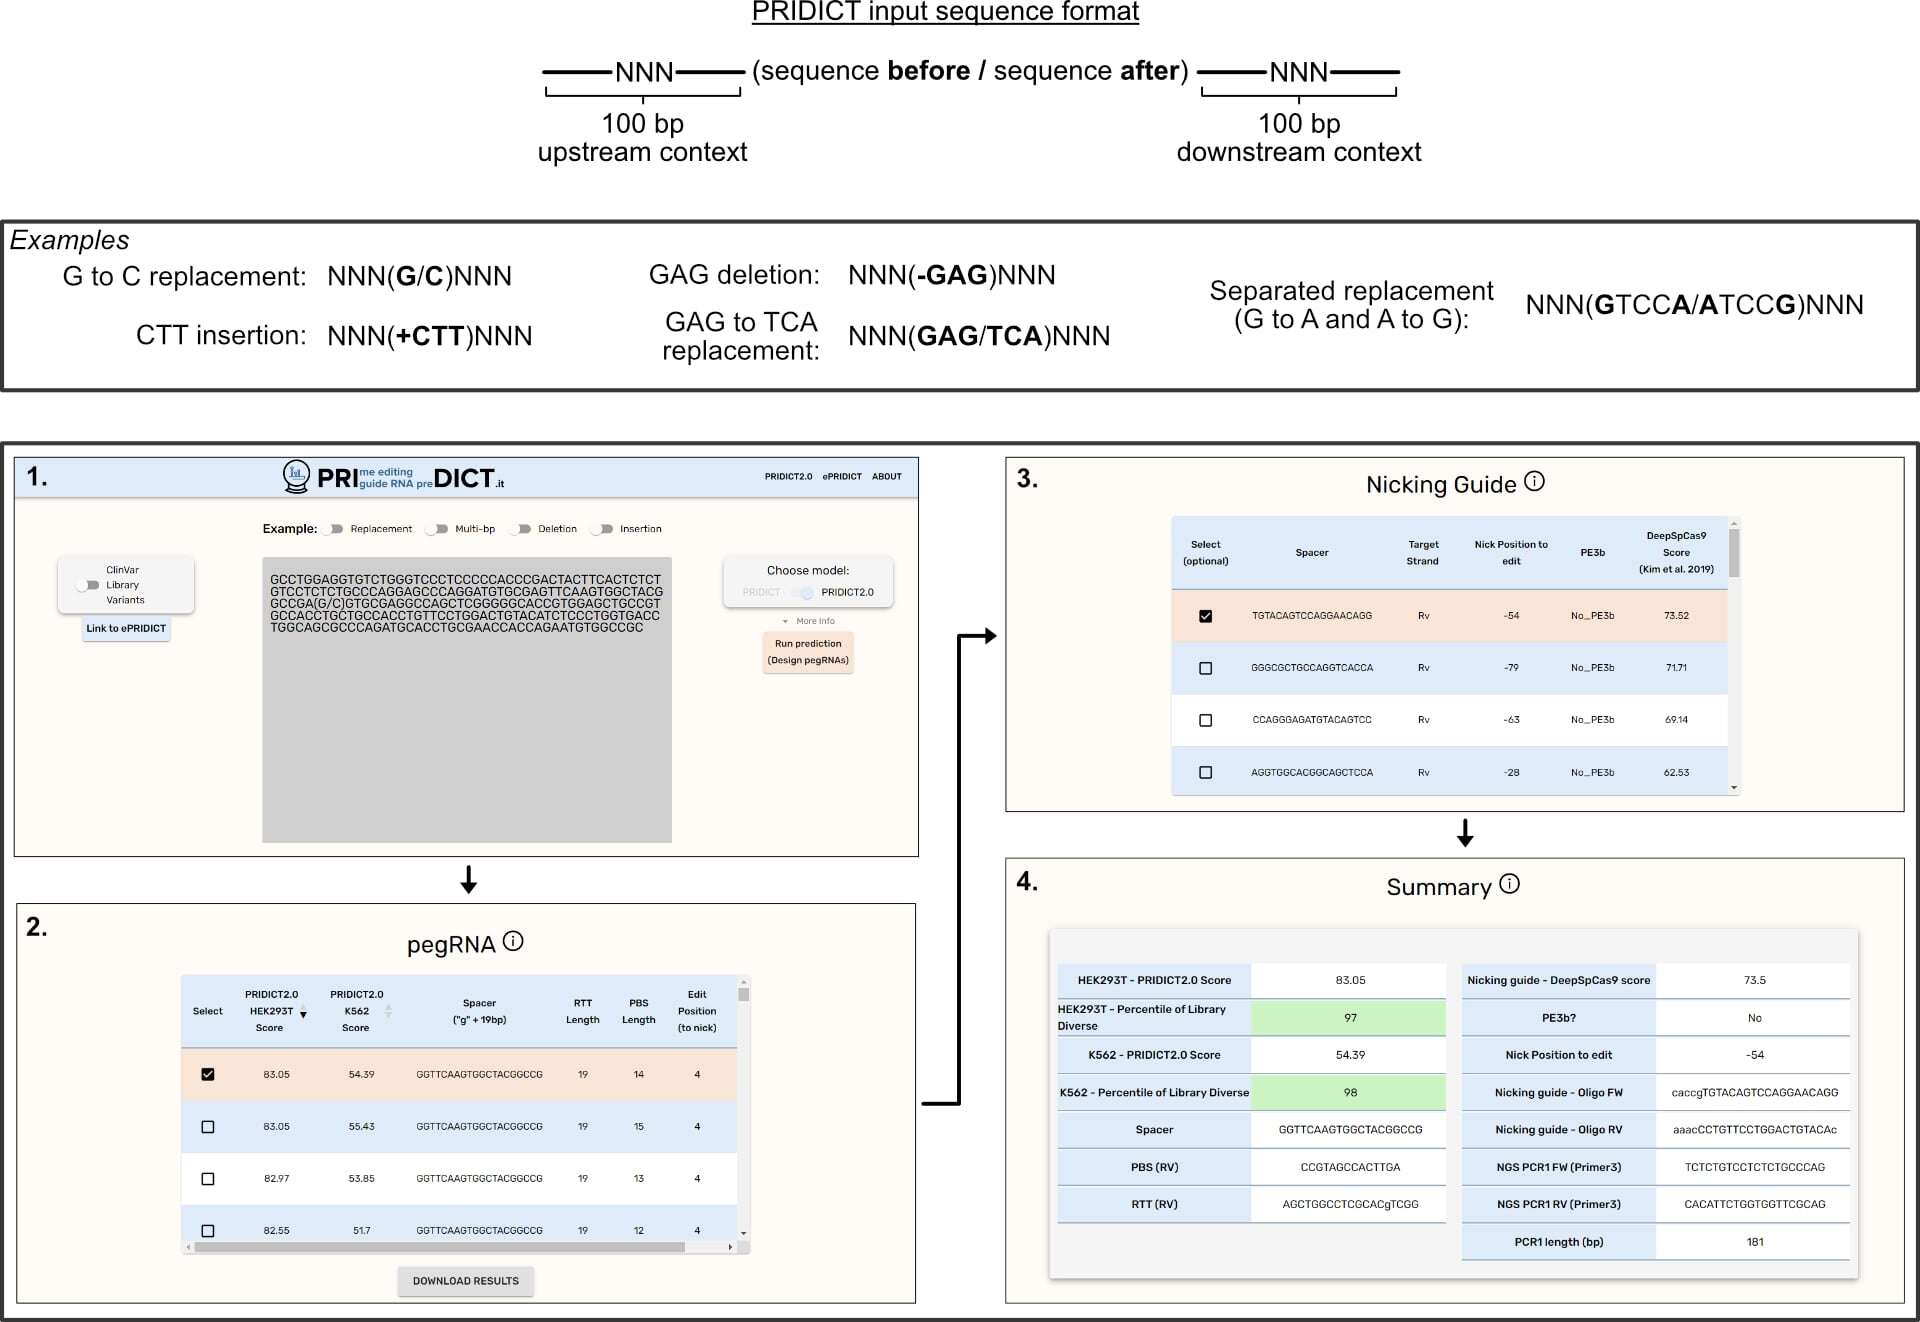
Over 75,000 pathogenic genetic variants have been identified in humans and cataloged in the ClinVar database. Previously developed genome editing methods using nucleases and base editors have the potential to correct only a minority of those variants in most cell types. But ...
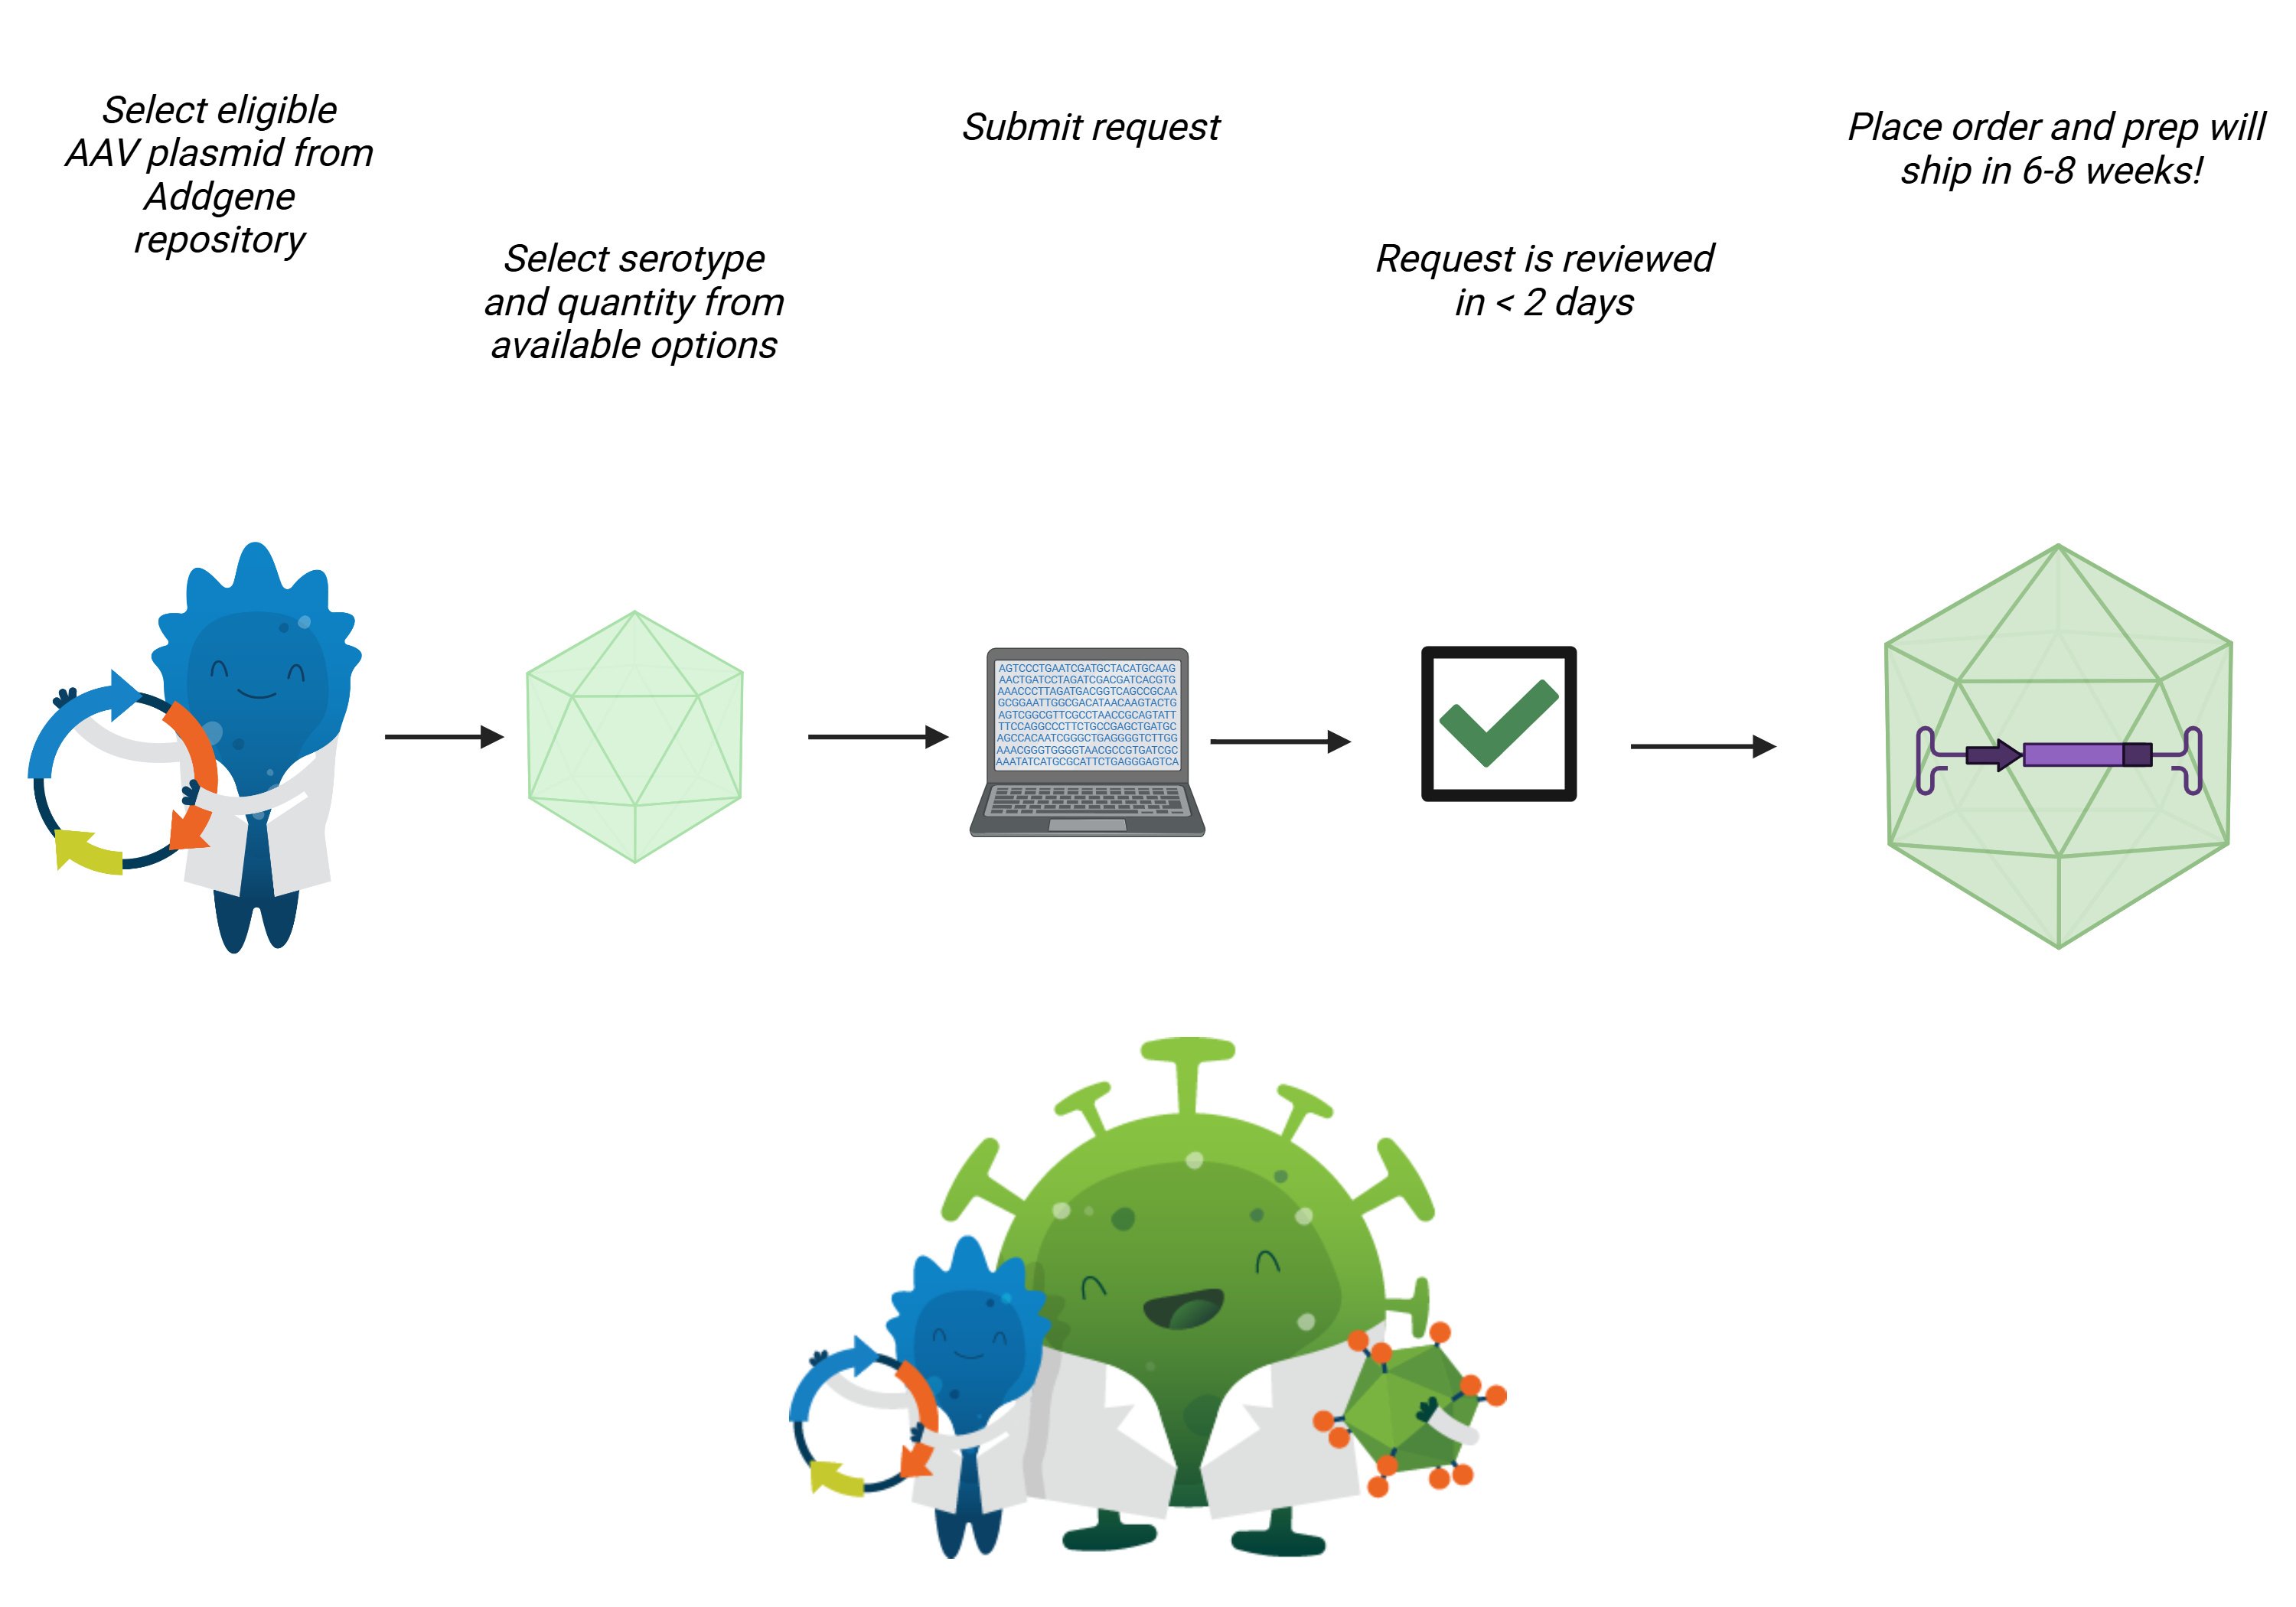
AAV Packaged on Request, an expansion of our viral vectors service, has officially launched! As of today, you can request any of over 3,000 eligible AAV cargo plasmids in the Addgene repository to be packaged in your choice of five different serotypes.
Every year, we like to add in some holiday cheer to our blog and social media. This year, we're doing so through the twelve days of antibodies. We hope you enjoy it, and we wish you a great 2025!
Addgene is ending 2024 with big plans for our future. And while we’ve been excited to share them with you, we realized our 20th anniversary was about all the amazing years behind us, as much as it as about the amazing years in front of us. So in our last celebratory moment, we ...
It’s a very thankful time of year for those of us at Addgene! And we can’t think of any better way to start off our holiday season than by thanking the twelve guest bloggers and subject matter experts who have contributed to our blog in 2024.
When Addgene opened in 2004, we focused on creating a repository that made it easy to share plasmids, both for people depositing plasmids and for people requesting them. Prior to this, many plasmids were available, but they often weren’t easily accessible, due to a wide range of ...
Thinking about using antibody-based applications in your experiment...but not sure where to start or what your options are? Addgene's latest animation is here to help!
You’ve probably heard that only 2% of our genome is made of protein-coding genes, and you might be wondering what the rest of our genome could possibly be made up of. The answer is… drum roll please… non-coding RNAs! You probably didn’t see that coming, right? Non-coding RNAs ...
Pre-made viruses have become increasingly accessible and are useful for saving time and avoiding potentially costly set-ups. However, there are many cases where the specific viral particles you need are not available, or the cost of custom viruses are too high for your budget. ...
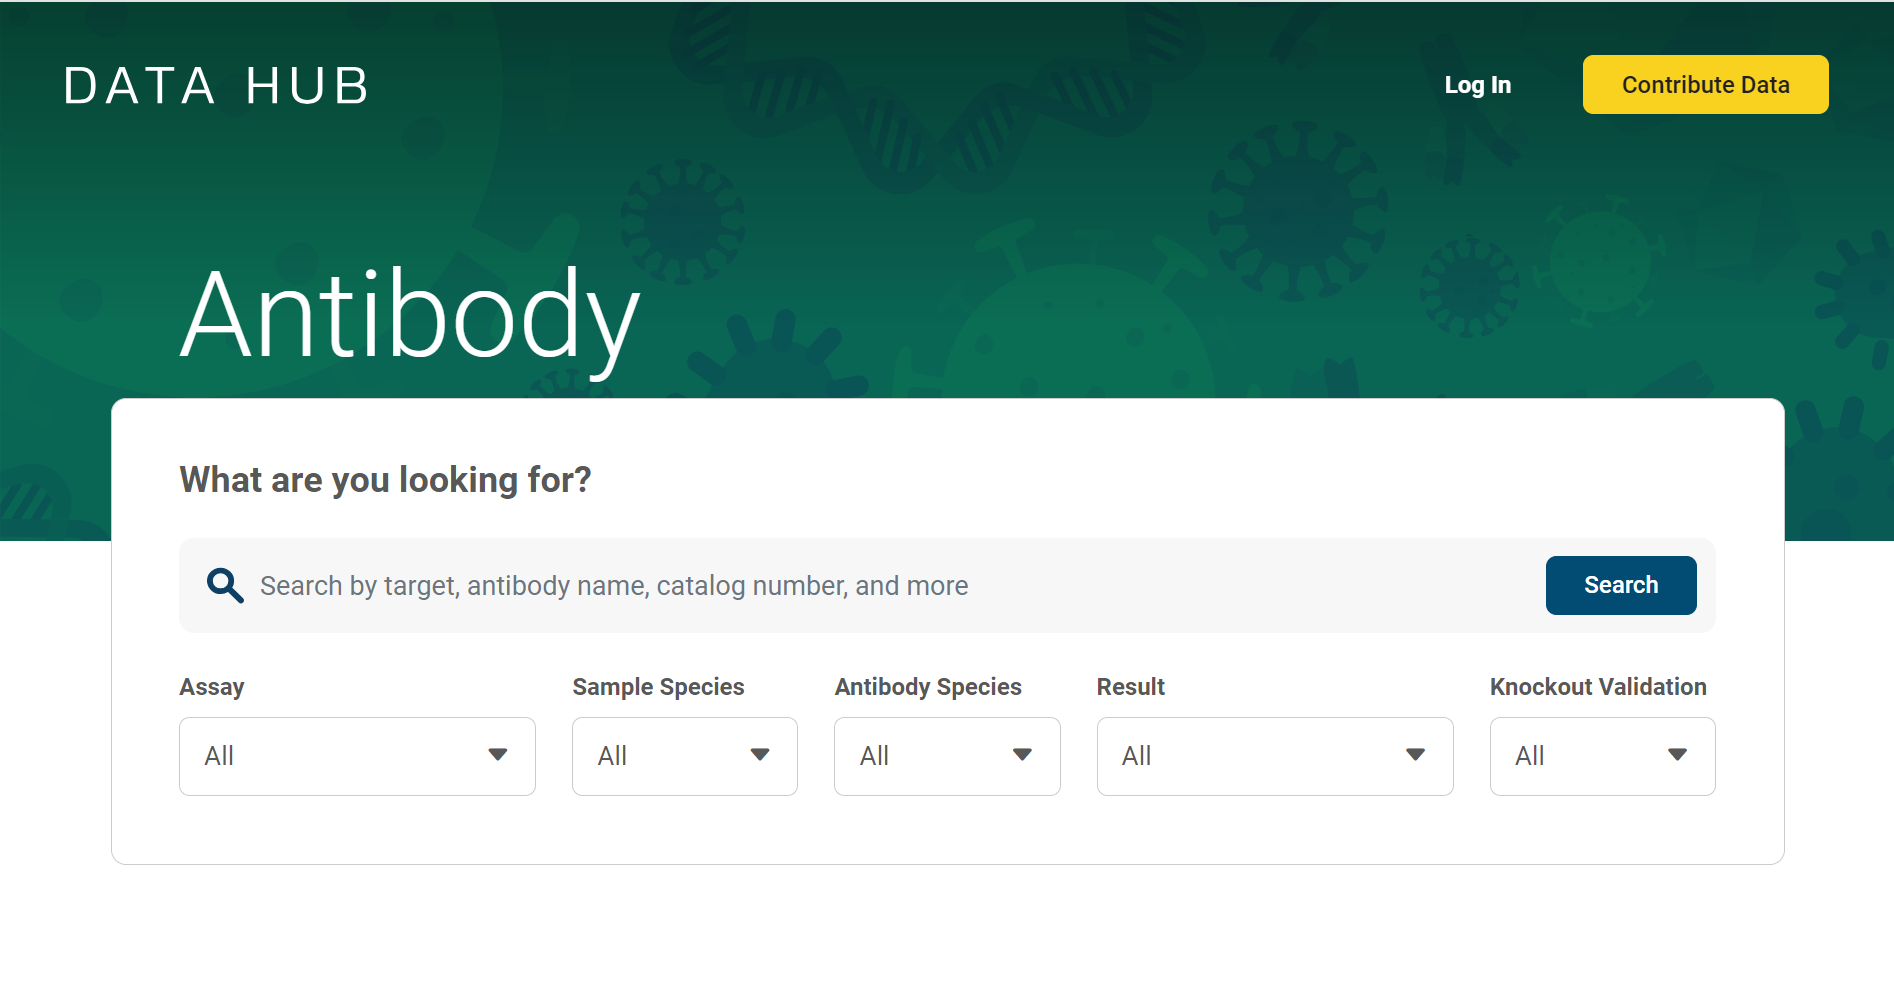
If you’re looking for an antibody that works for your experiment, you may be overwhelmed by options — or not know where to start looking to find one. Luckily, there are websites that can help: Antibody data repositories, which share validation data, and antibody search engines, ...
Addgene is very excited to share the very first edition of our Antibodies 101 eBook! The latest addition to our eBook collection is a handy resource for anyone looking to use antibody-based applications in their research.
We’re big fans of all our depositors here at Addgene — your contributions make the repository what it is. So we’re thrilled this week to congratulate depositor David Baker, who was awarded the Nobel Prize in Chemistry last week alongside Demis Hassabis and John Jumper! The Baker ...
We’re very excited to announce that we are expanding our viral vector service to include a Packaged on Request option. Through this expansion, scientists will be able to request an AAV composed of an AAV plasmid in the Addgene repository and their choice of five different ...
Addgene is proud to present our updated CRISPR Guide!
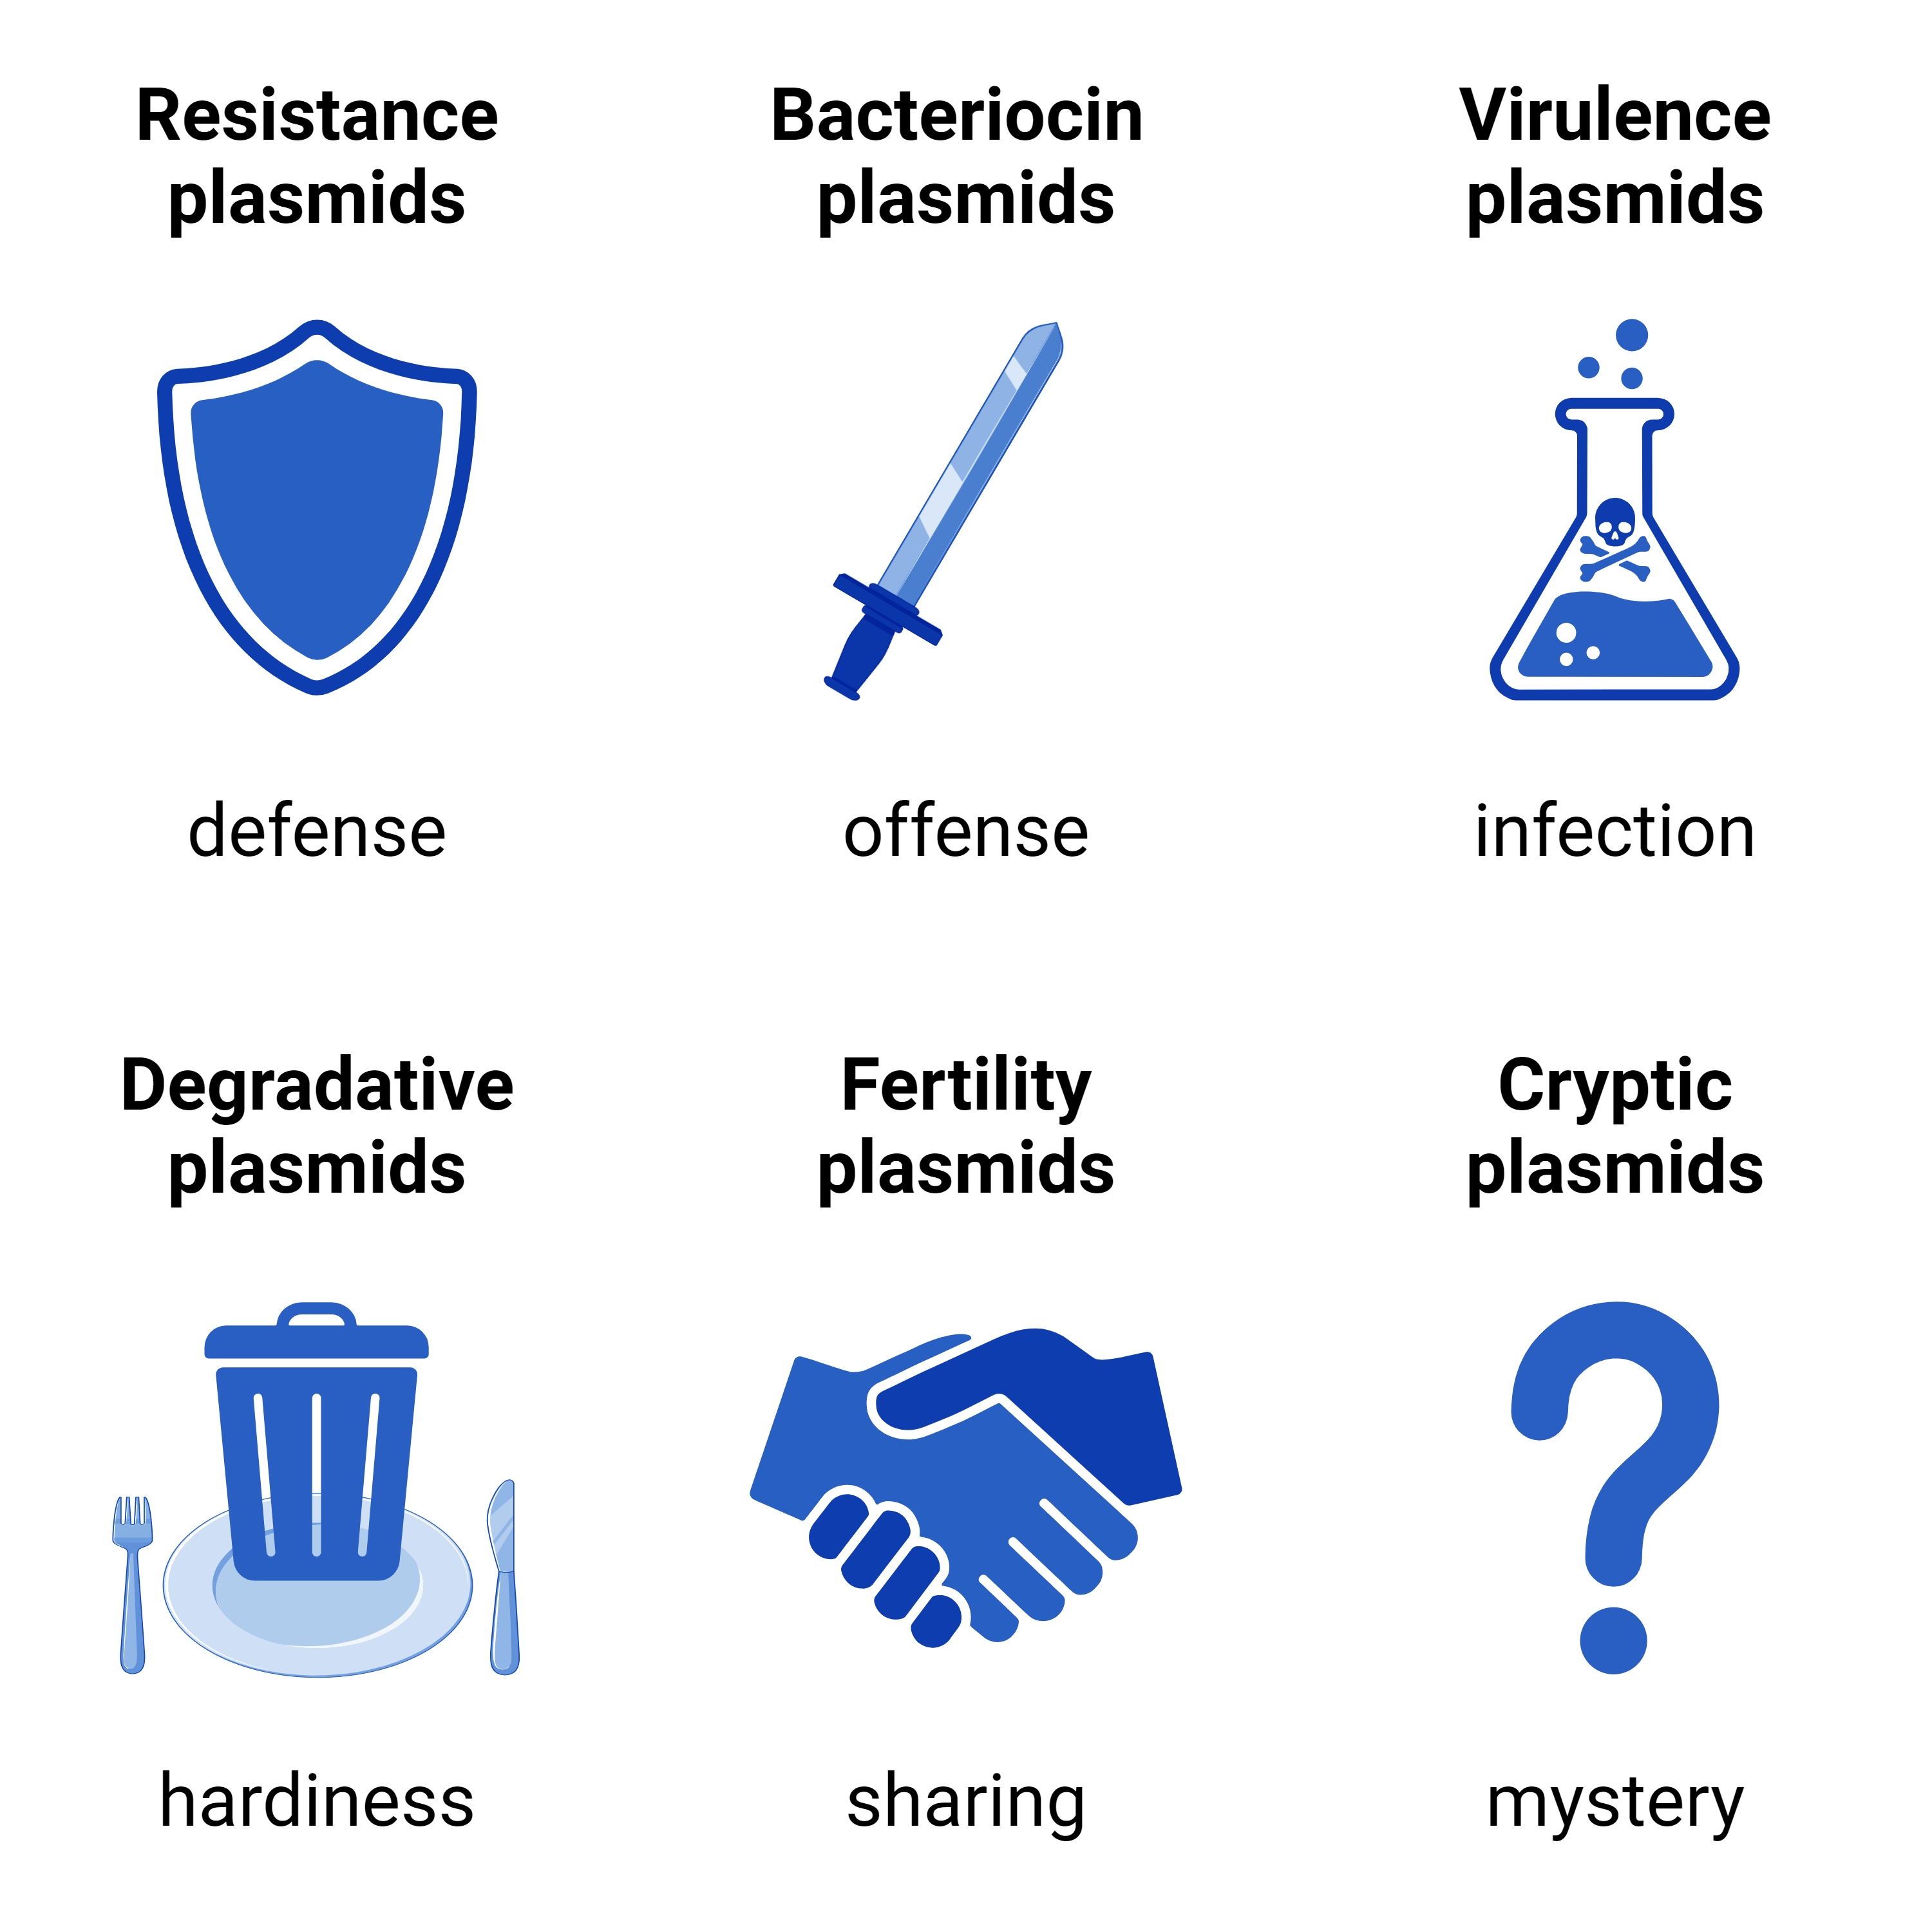
Here at Addgene, we often refer to plasmids as lab or experimental tools. They certainly are very handy in research, but we’re really borrowing these tools from Mother Nature’s toolbox. Natural plasmids, also called environmental plasmids, are all around us!
If the fall colors are inspiring you to paint your cells in equally vivid colors, you'll want to check out the 34 new preps available in the Addgene viral vector repository! This includes the first Addgene prep packaged in the AAV9-X1.1 serotype.
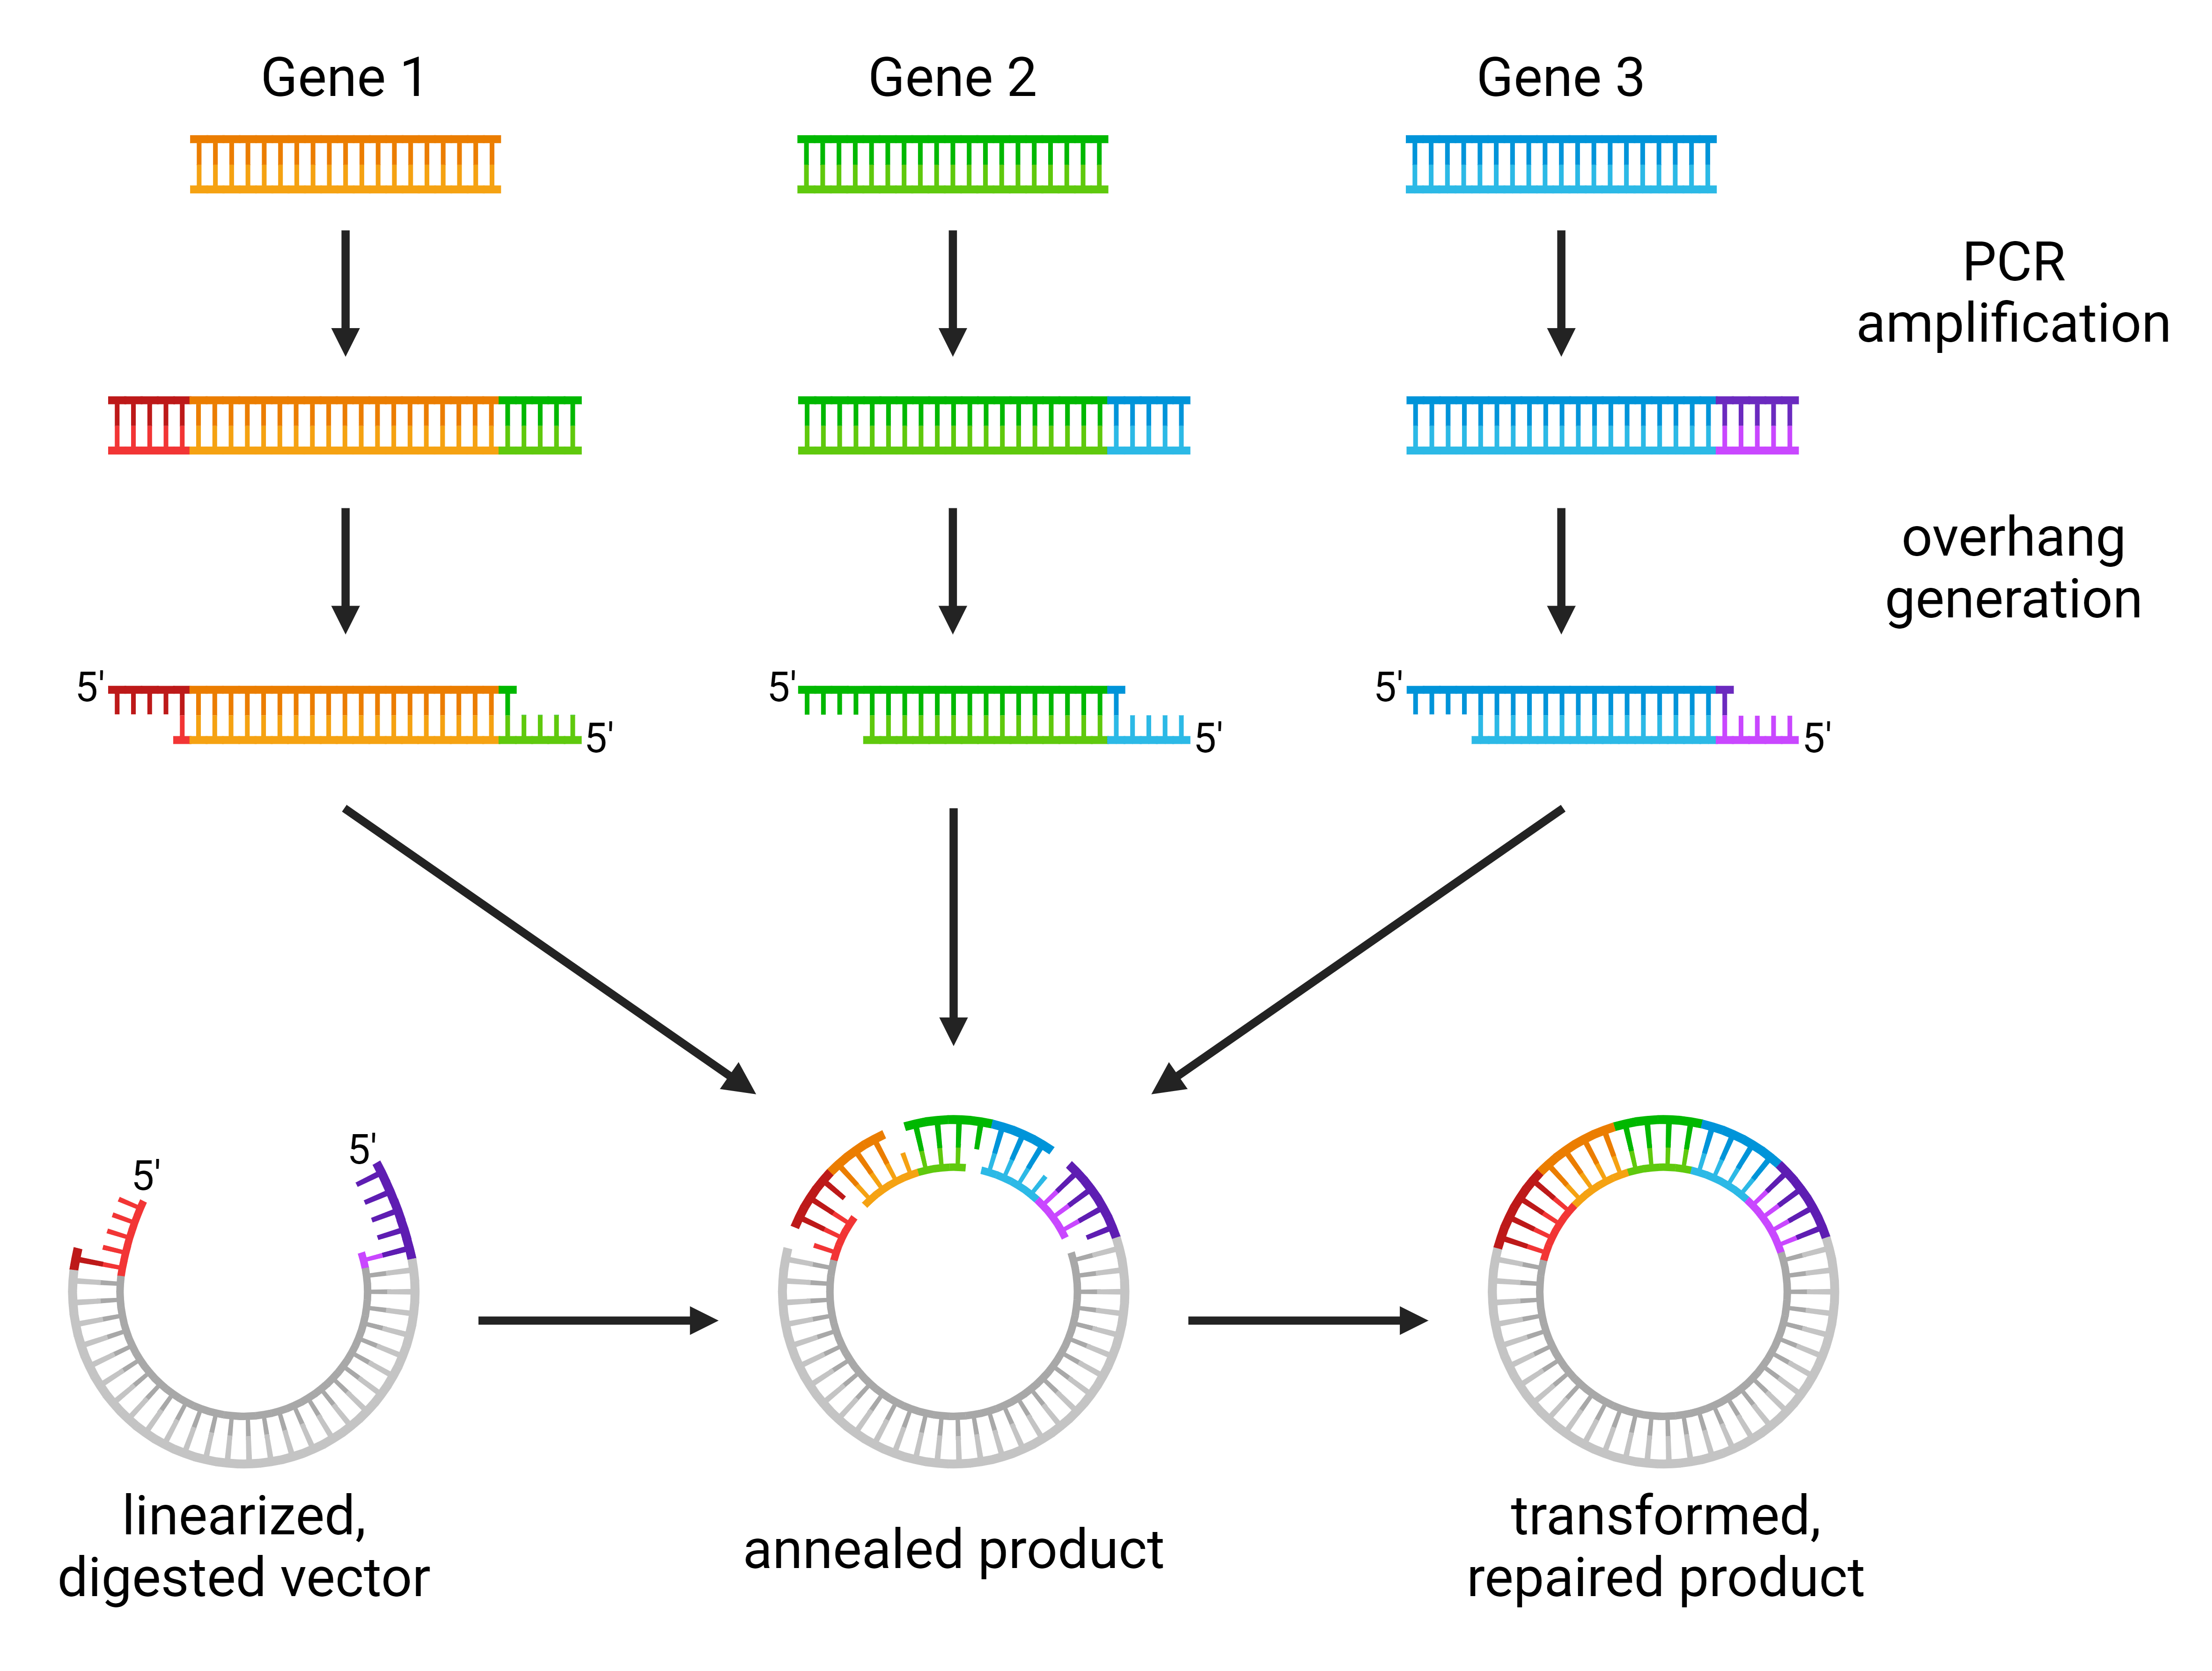
If cloning methods had personalities, SLIC (sequence- and ligation-independent cloning) would be a true rebel. Not only does this system not use site-specific recombination, it also doesn’t require a ligation step. Based on the robust system of homologous recombination found in ...
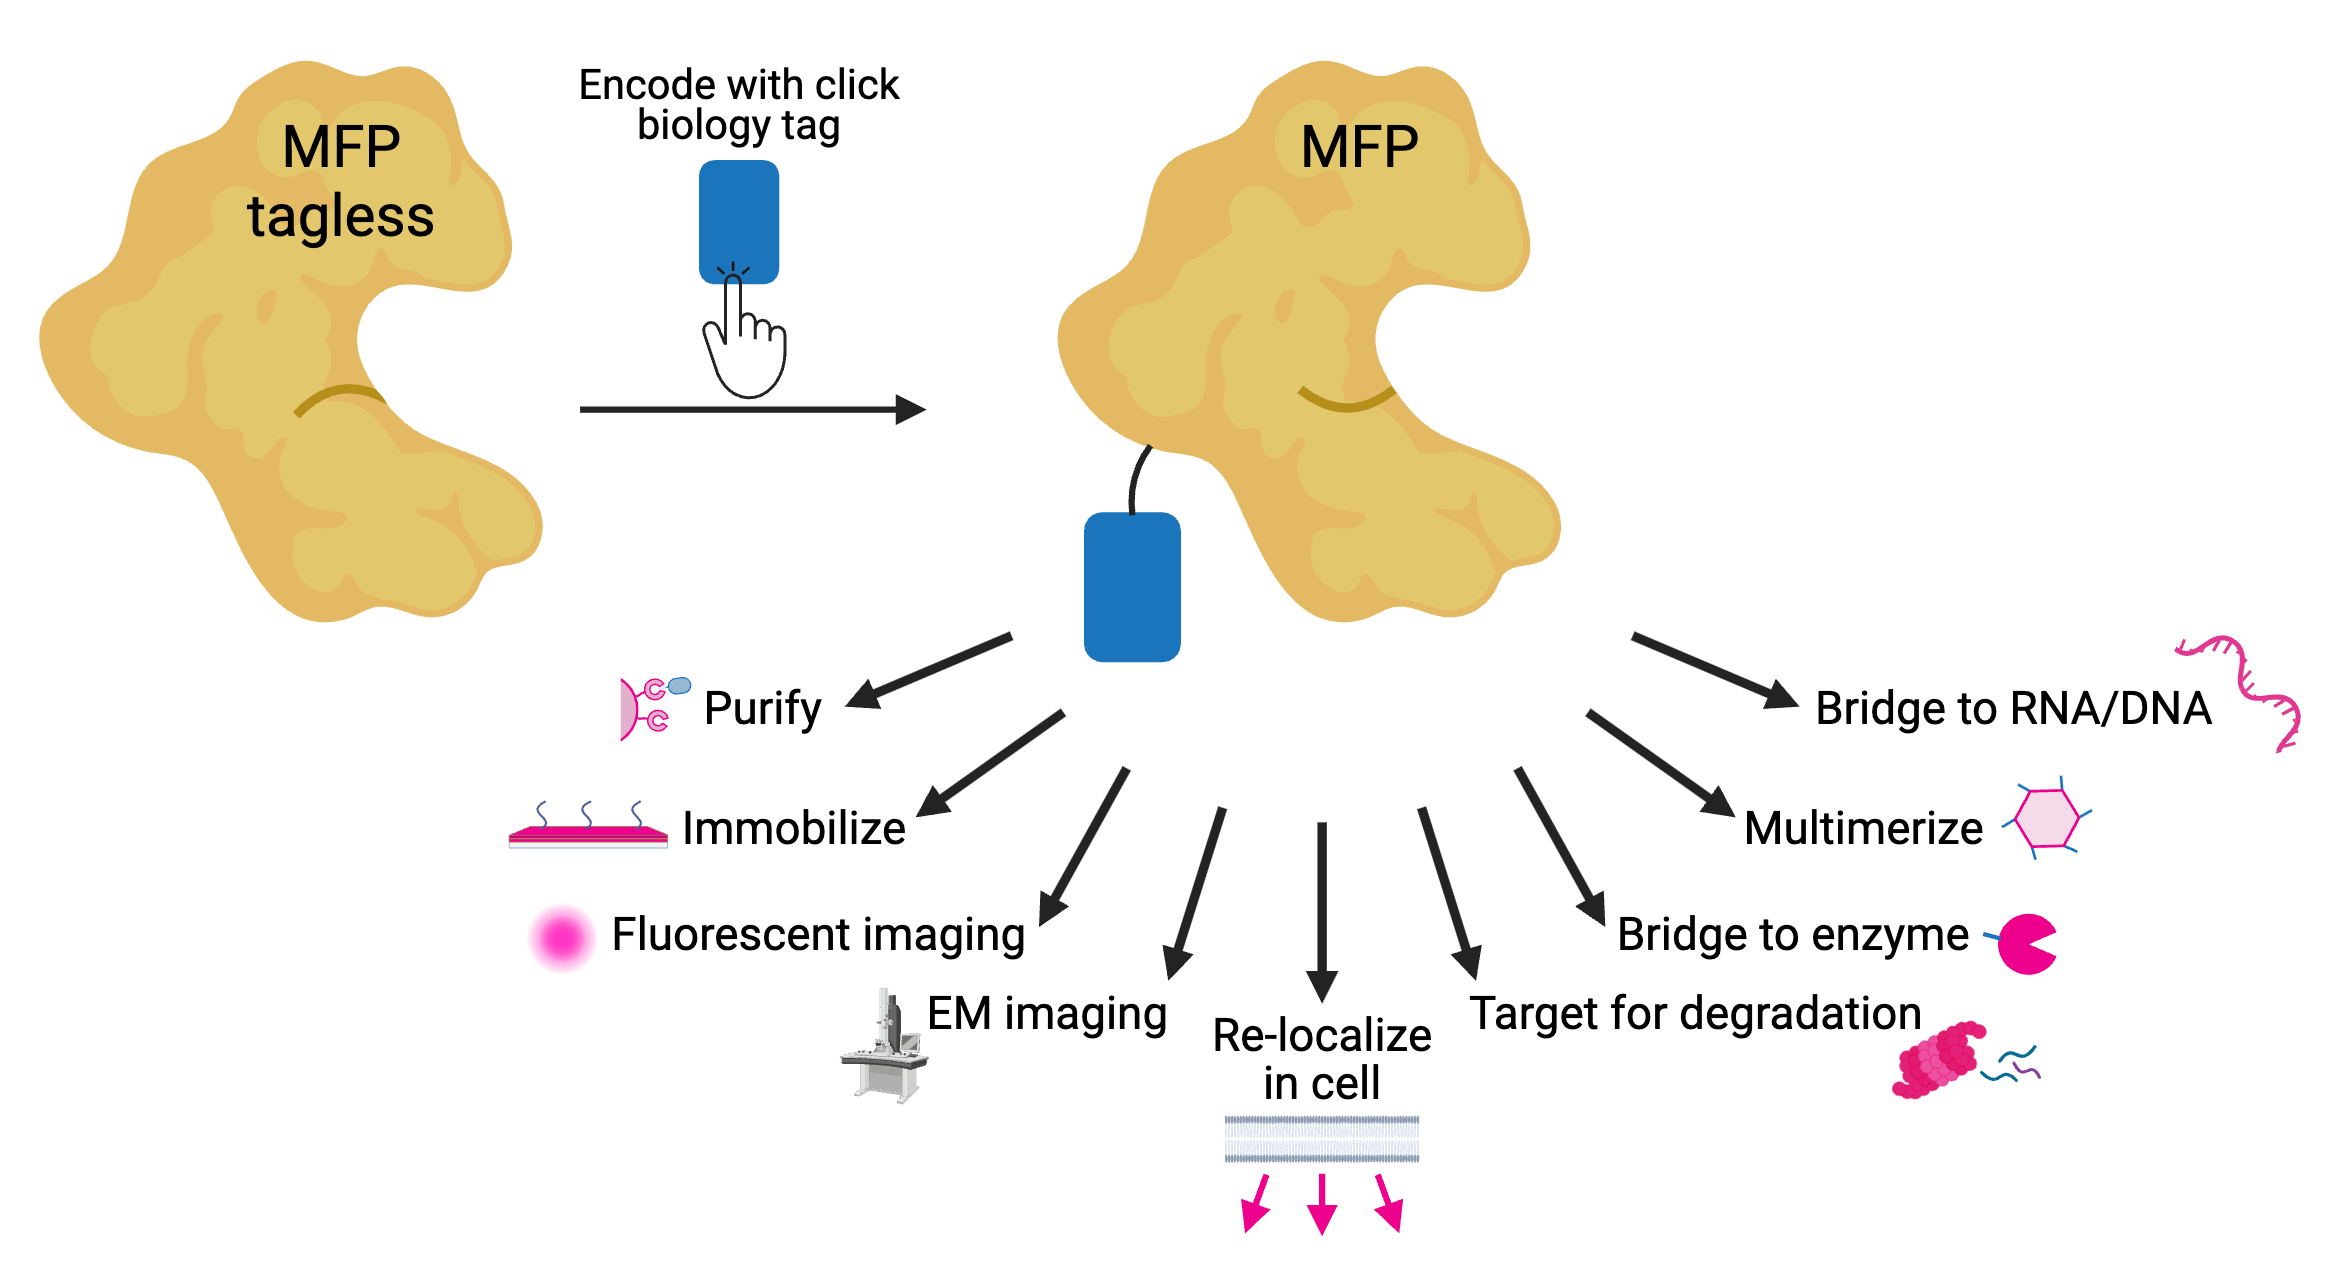
Lots of scientists work to invent novel techniques or to engineer improved tools for familiar applications. But how does one invent a tool for applications that don’t even exist yet? Andrew York, Maria Ingaramo, and their team at Calico Life Sciences recently set out to do just ...
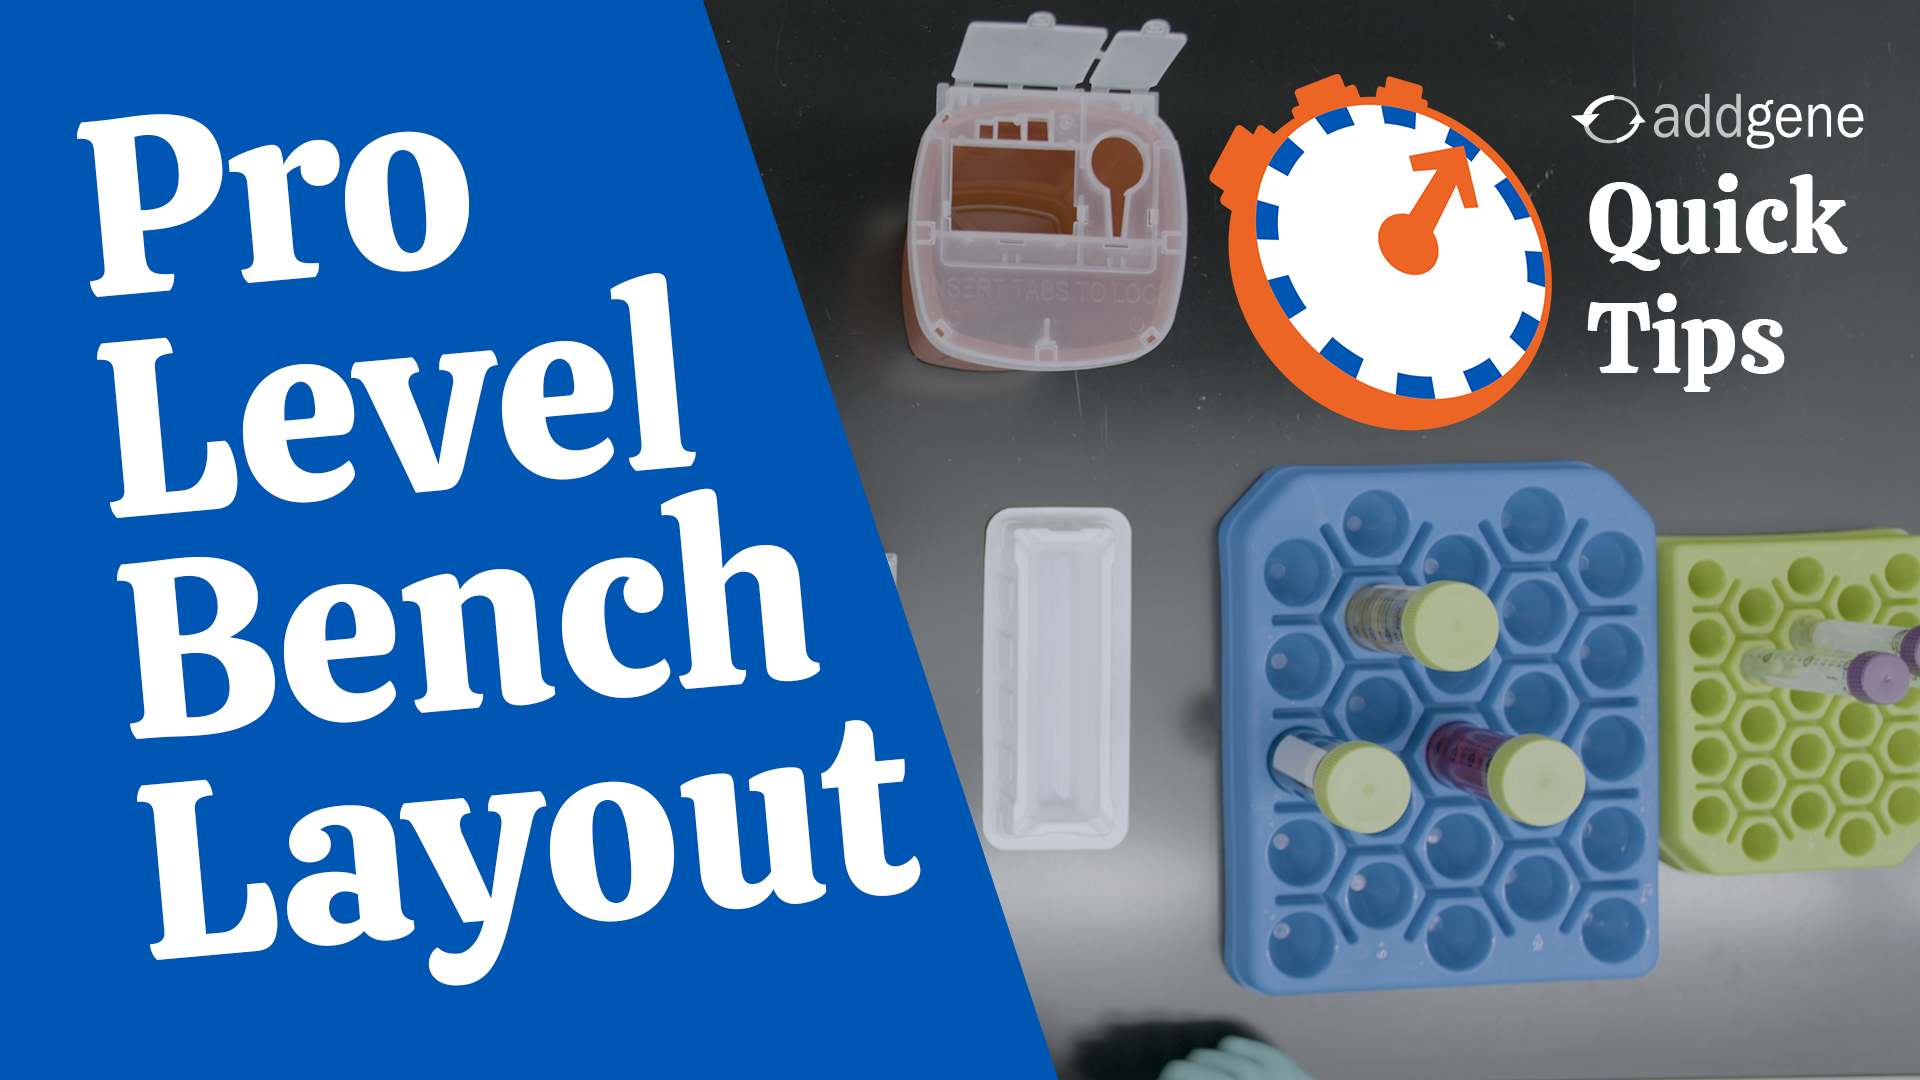
If you’re looking for the best way to improve your lab techniques — but perhaps are a little limited on time — check out Addgene’s new Quick Tip series on YouTube!
Western blots can be tricky to get right. If you’ve thoughtfully done the technical design of your blot, but are still finding yourself having issues, you’re in the right place! In this post, we’ll talk about western blot optimization and troubleshooting.
If you’re using antibodies in your research, you've probably found yourself staring at a browser full of tabs, each open to a different antibody option. Or you may find yourself with only two options, but very little data on which might work in your application. It can be quite ...
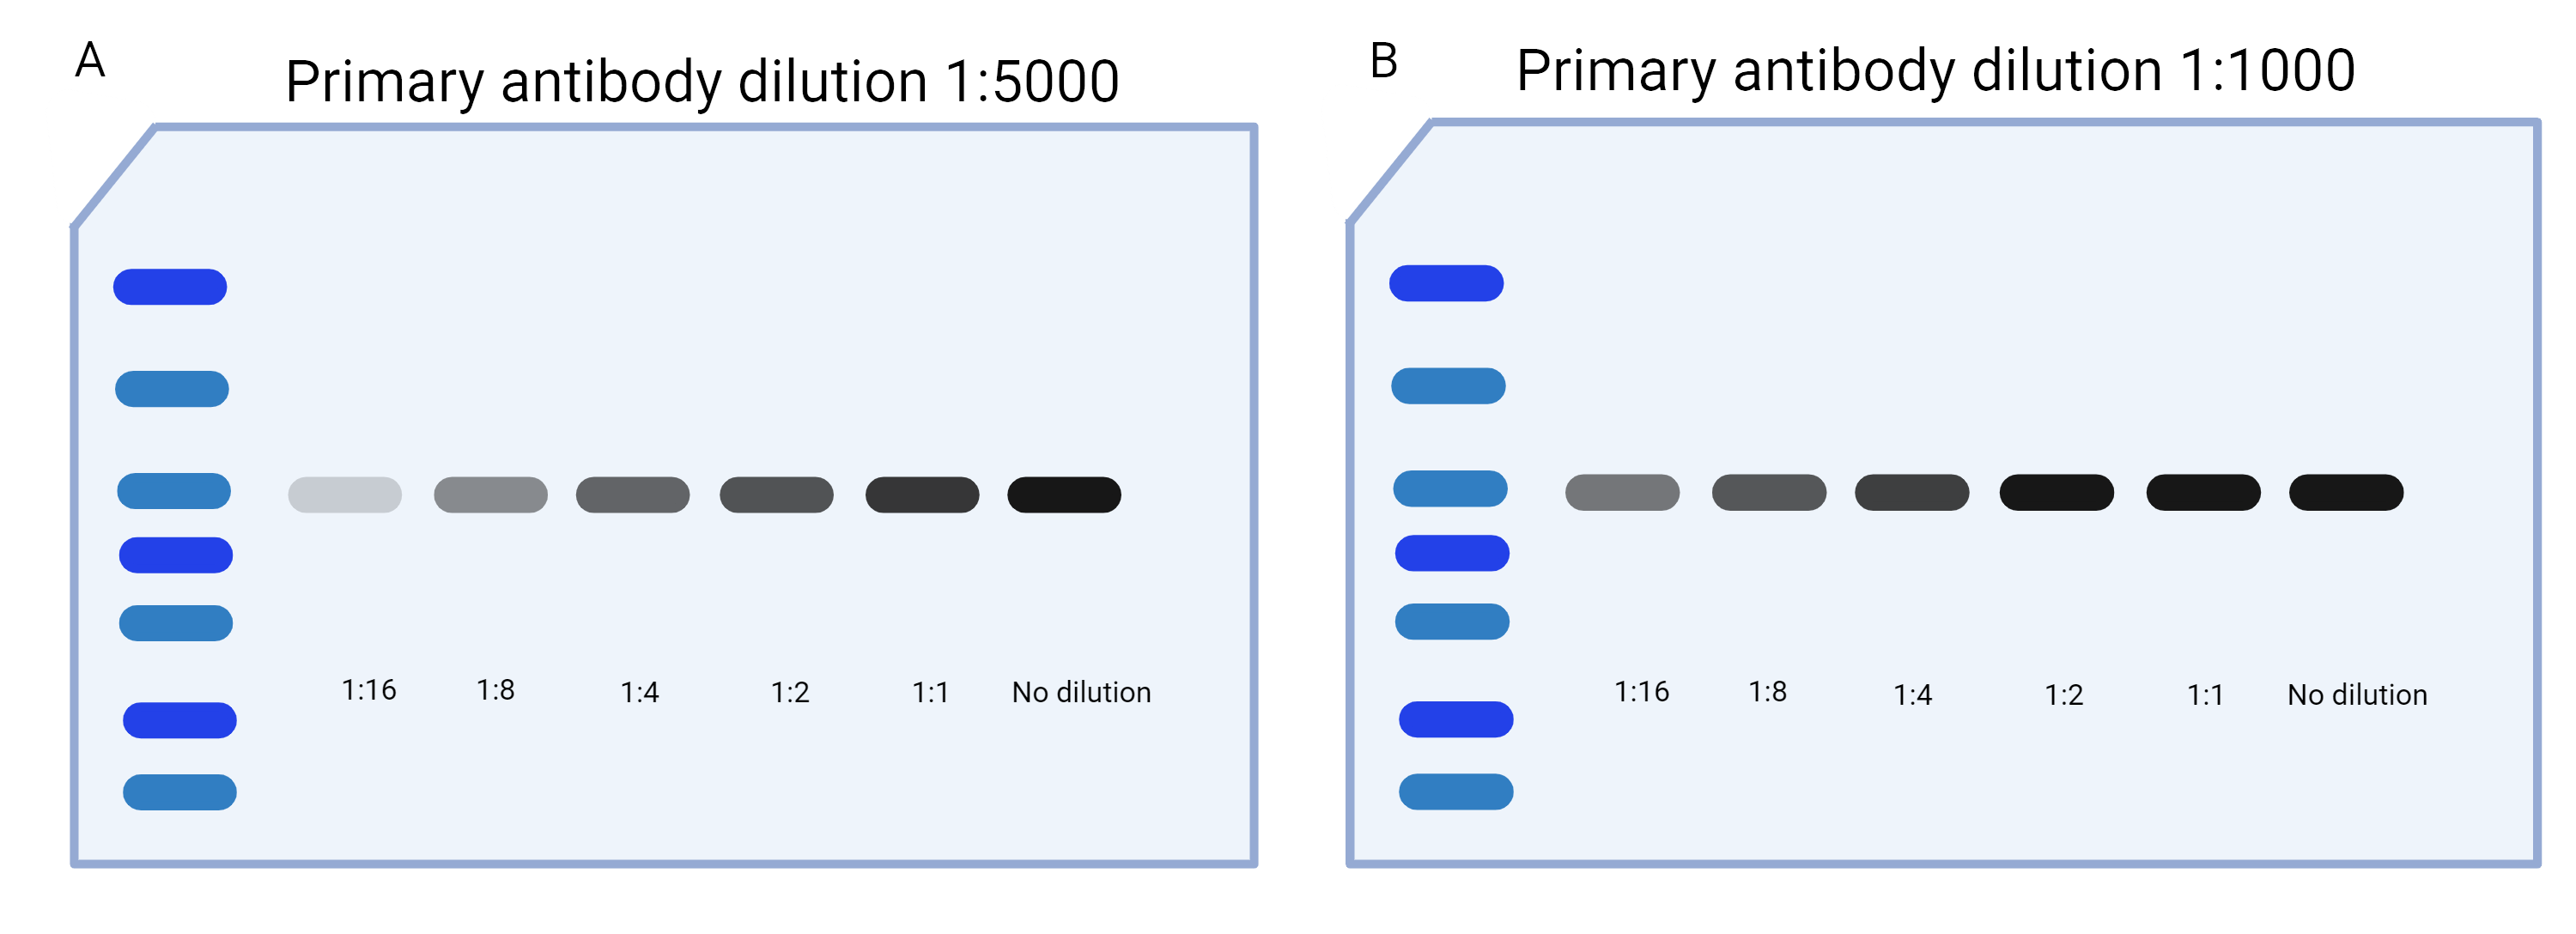
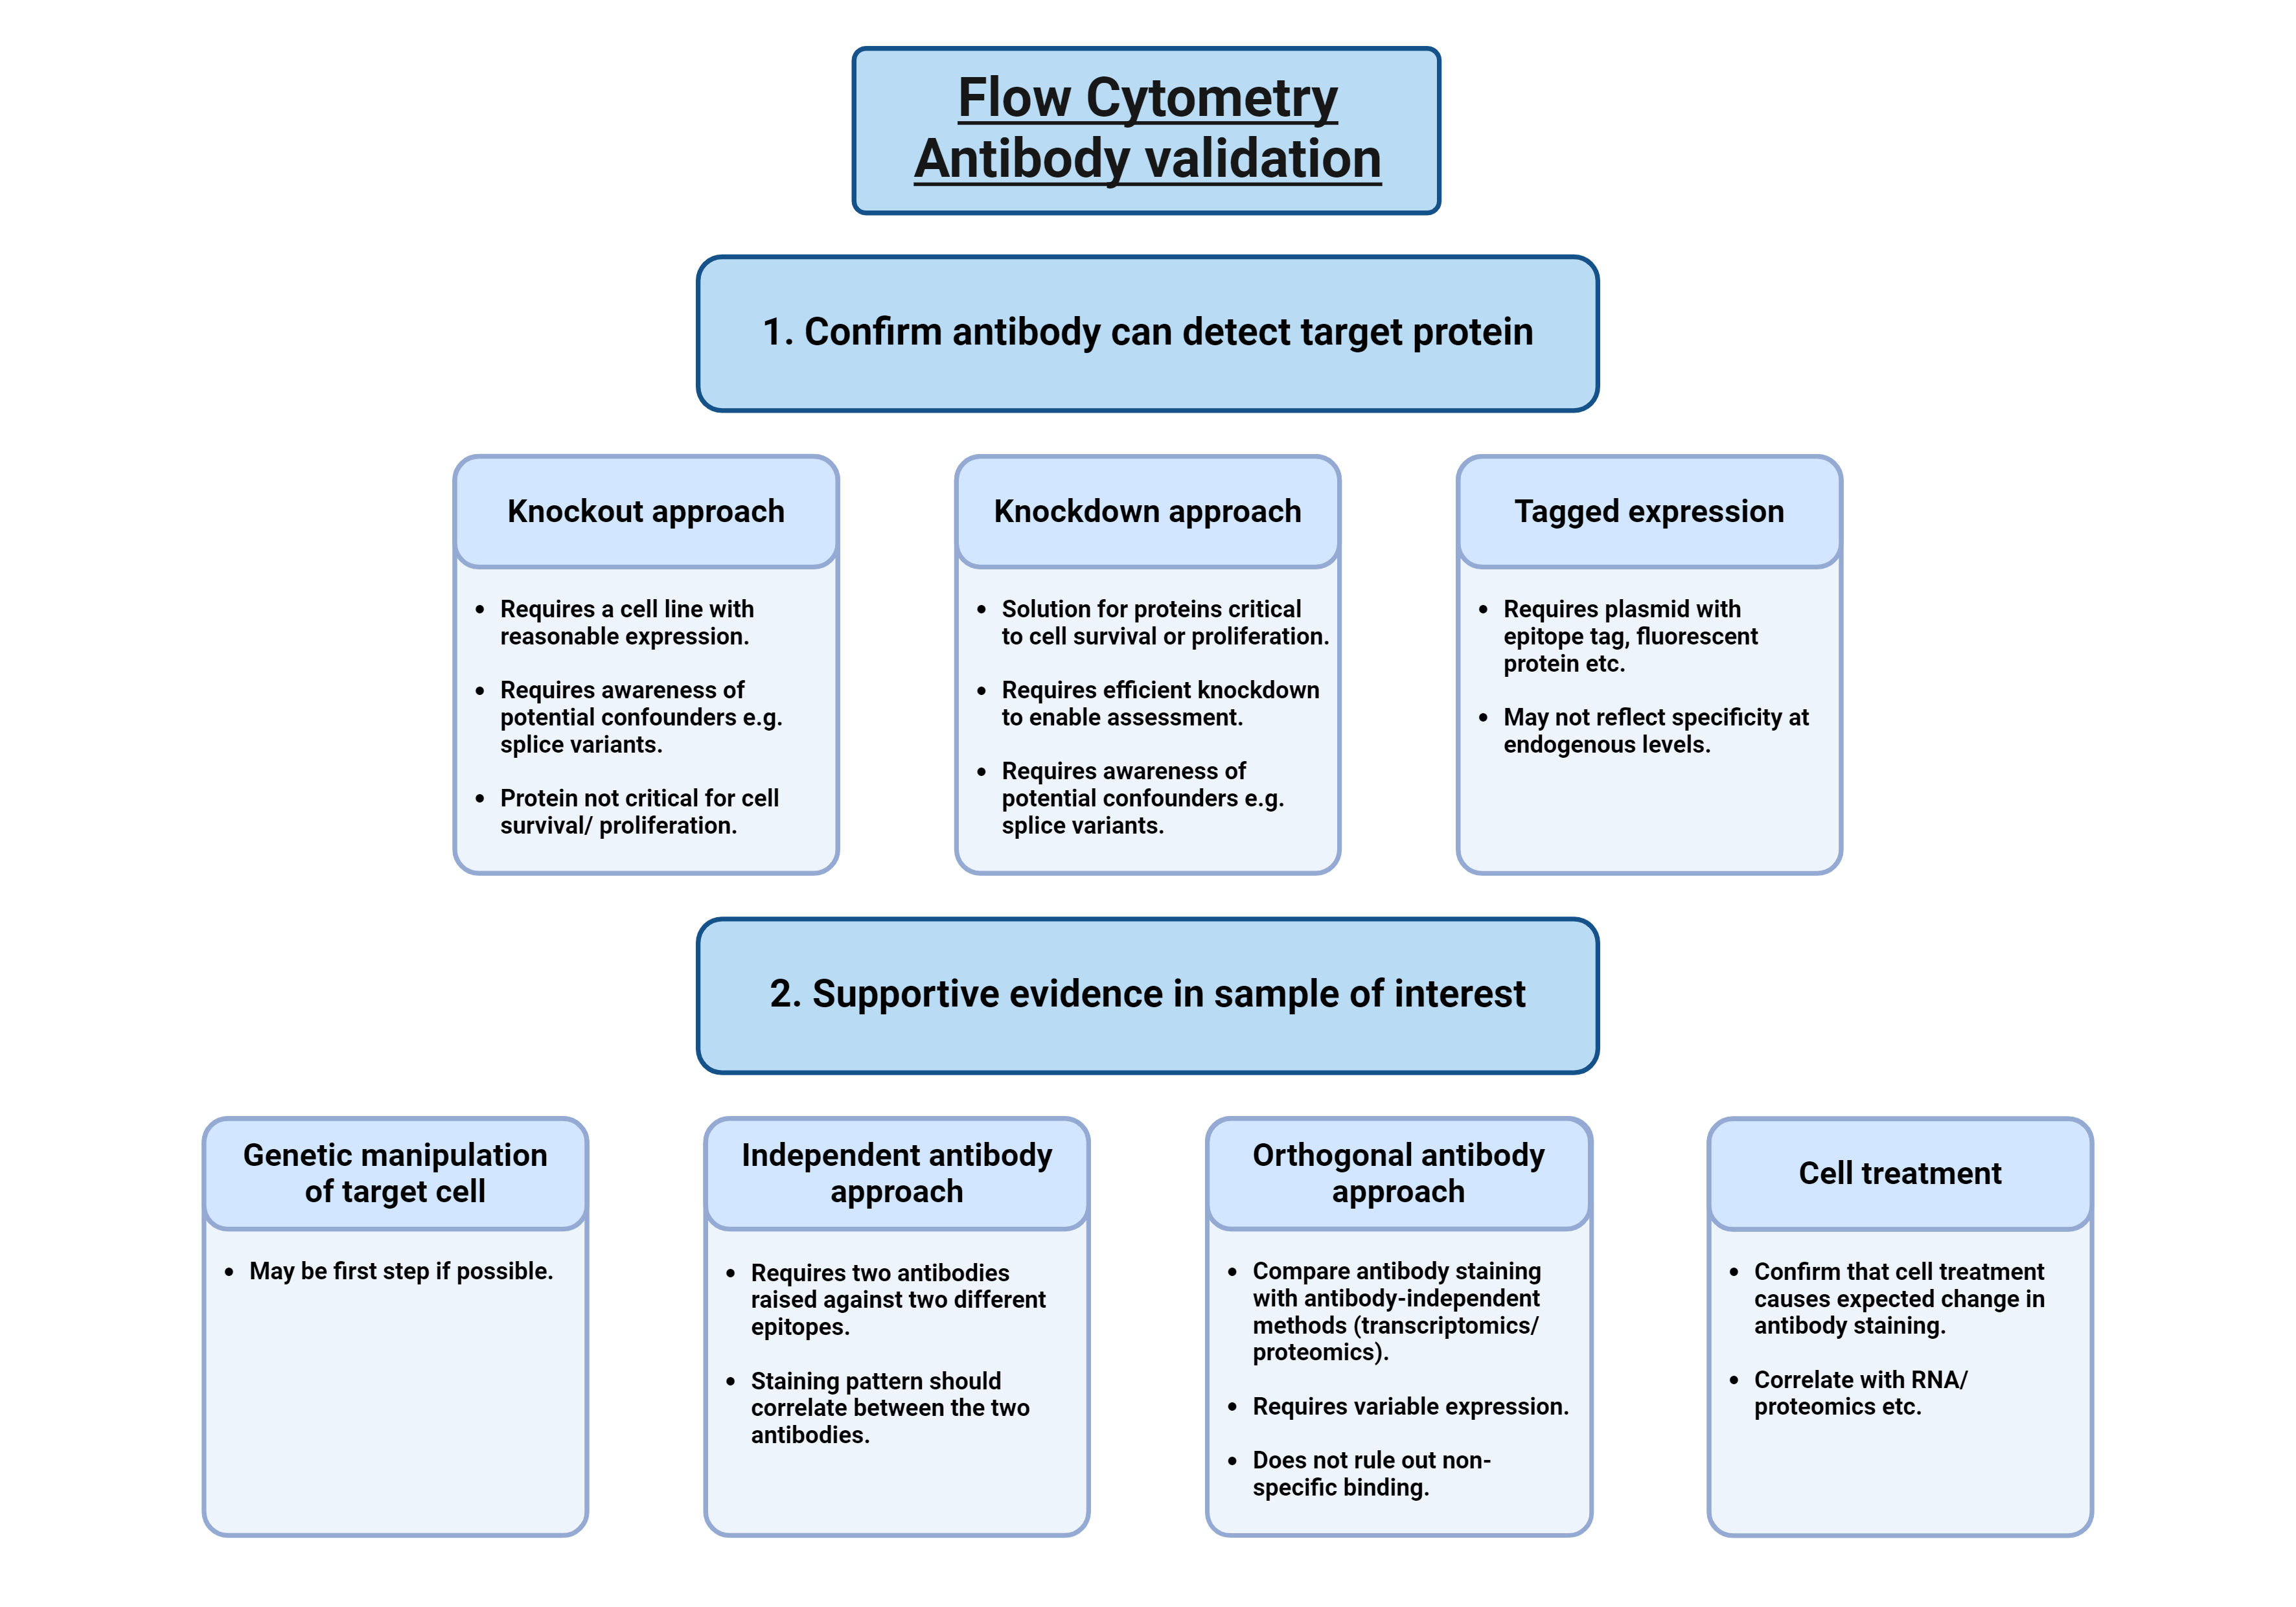
Antibody validation is to confirm (or refute) that the antibody is selectively detecting the target-of-interest in your assay and sample-of-interest. The approaches available broadly map onto the five pillars of antibody validation (see: Uhlen et al., 2016). In this post, we ...
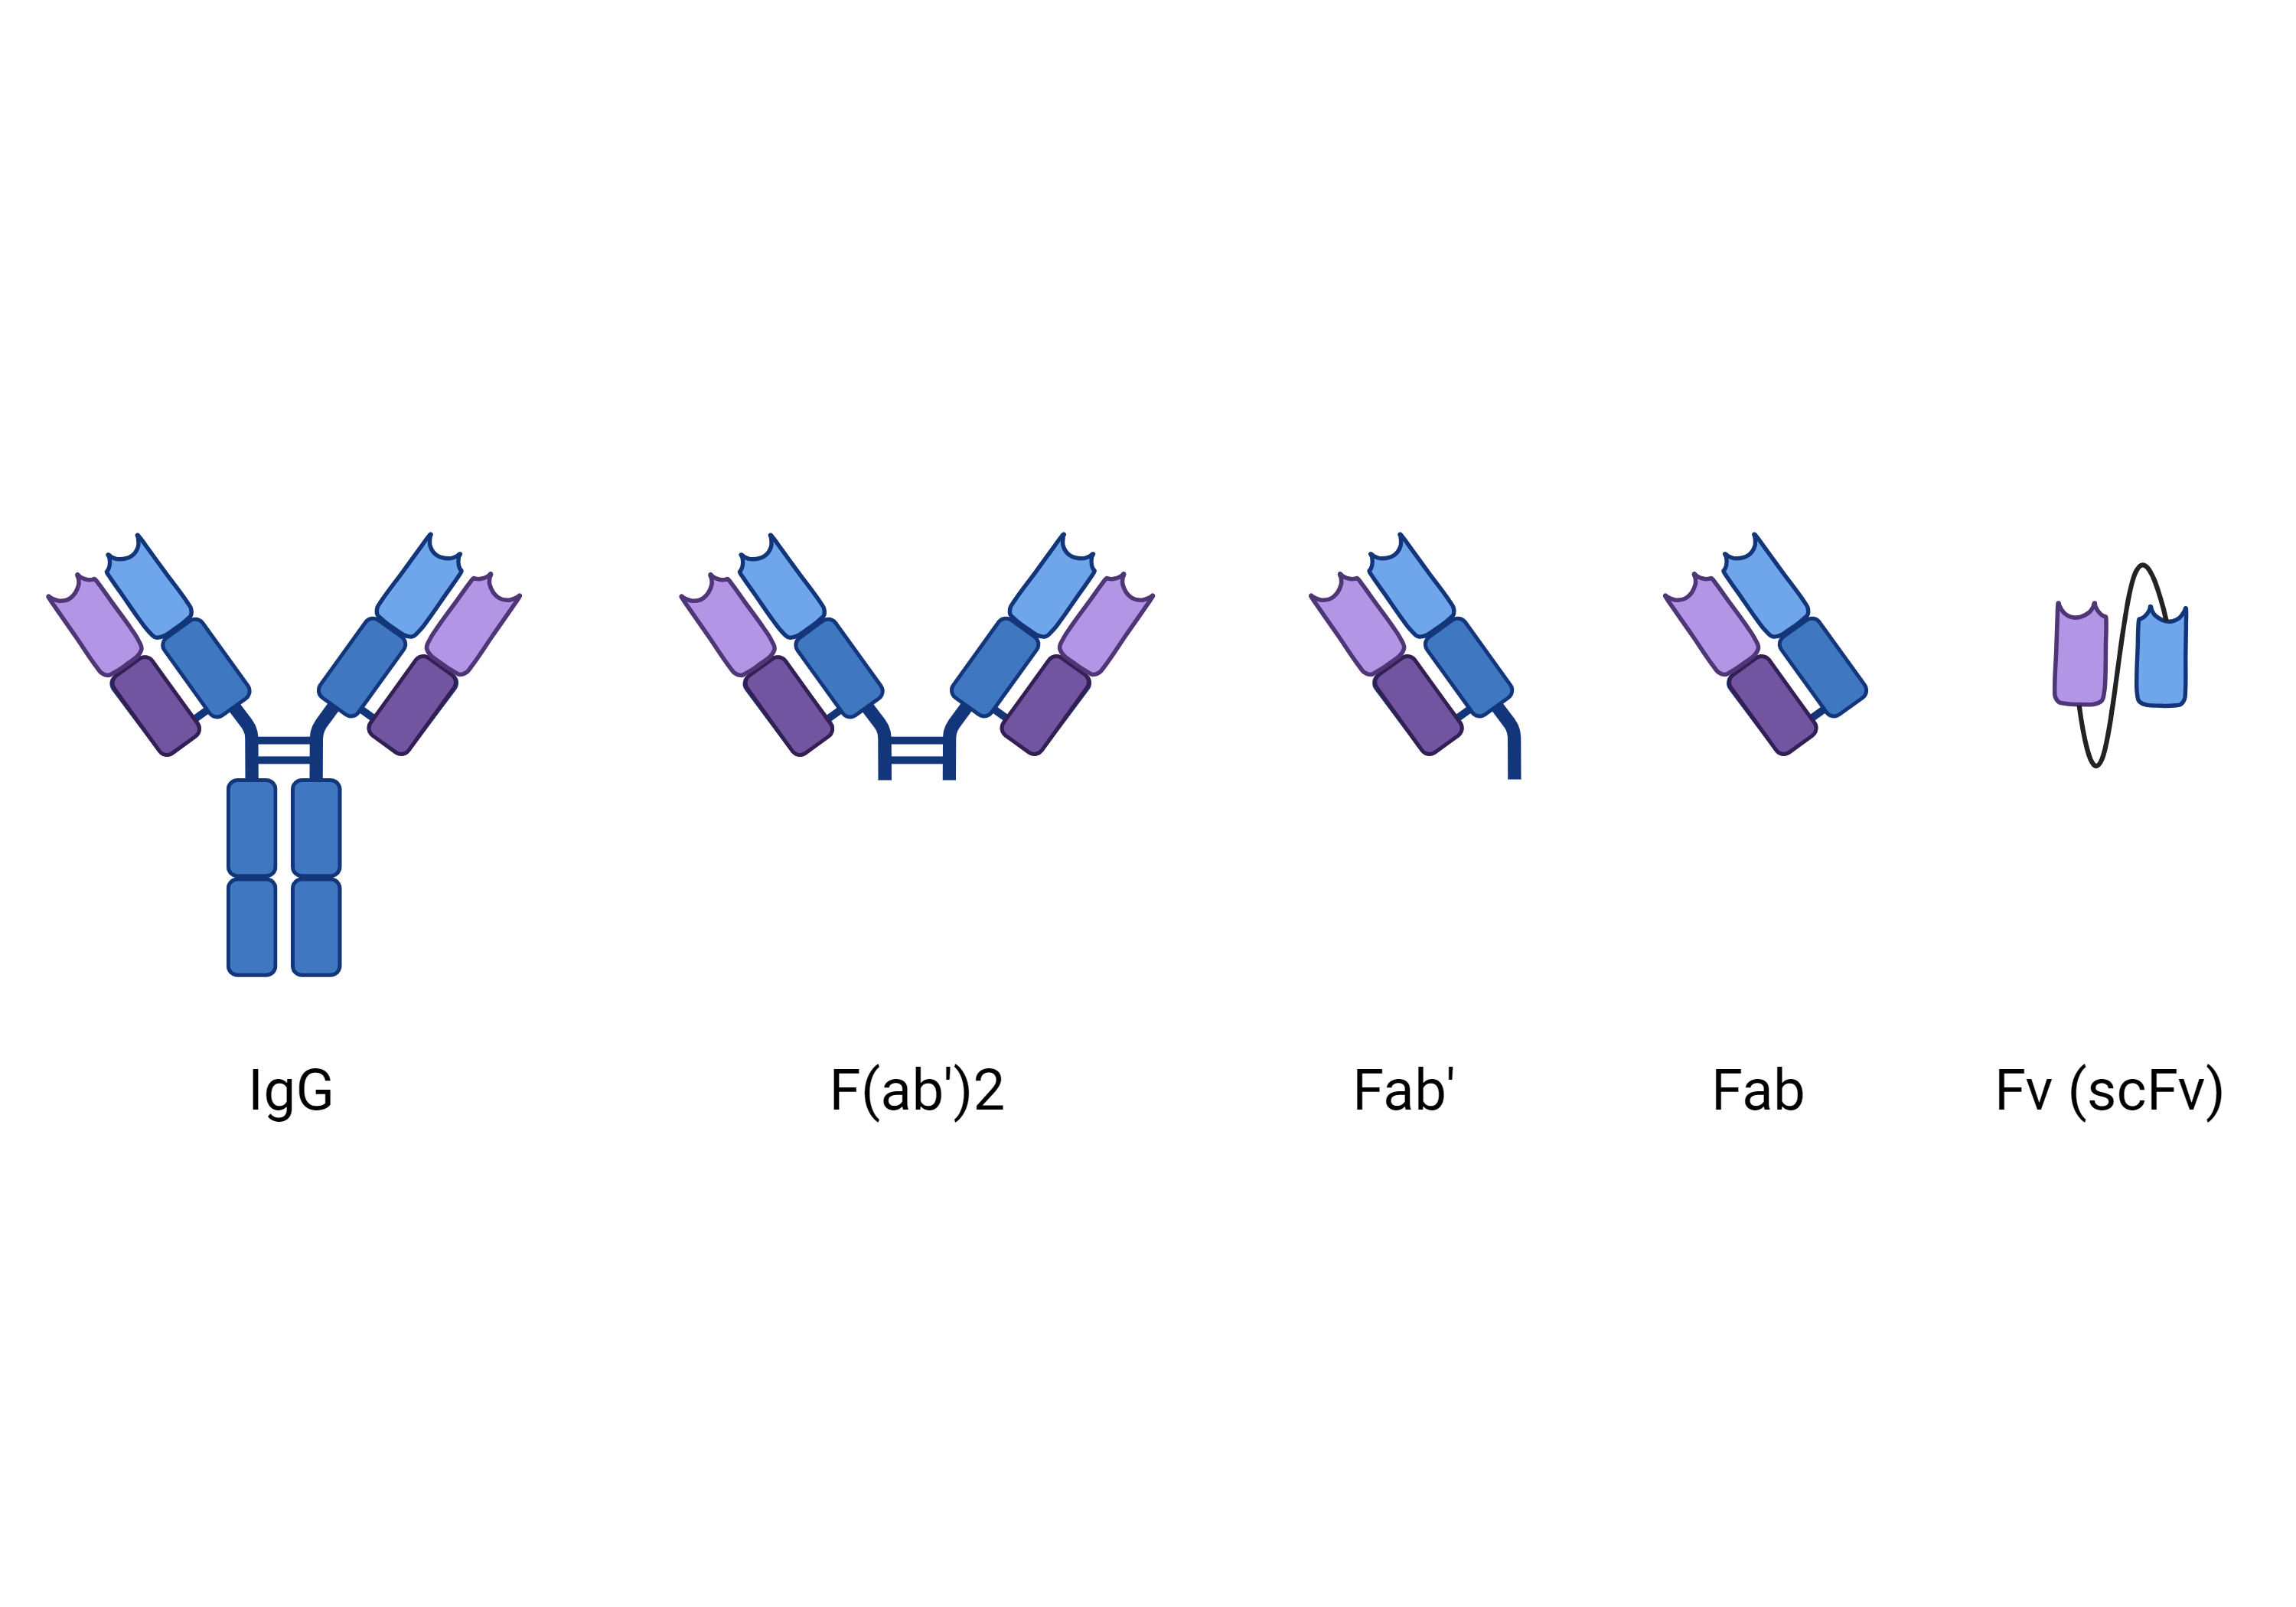
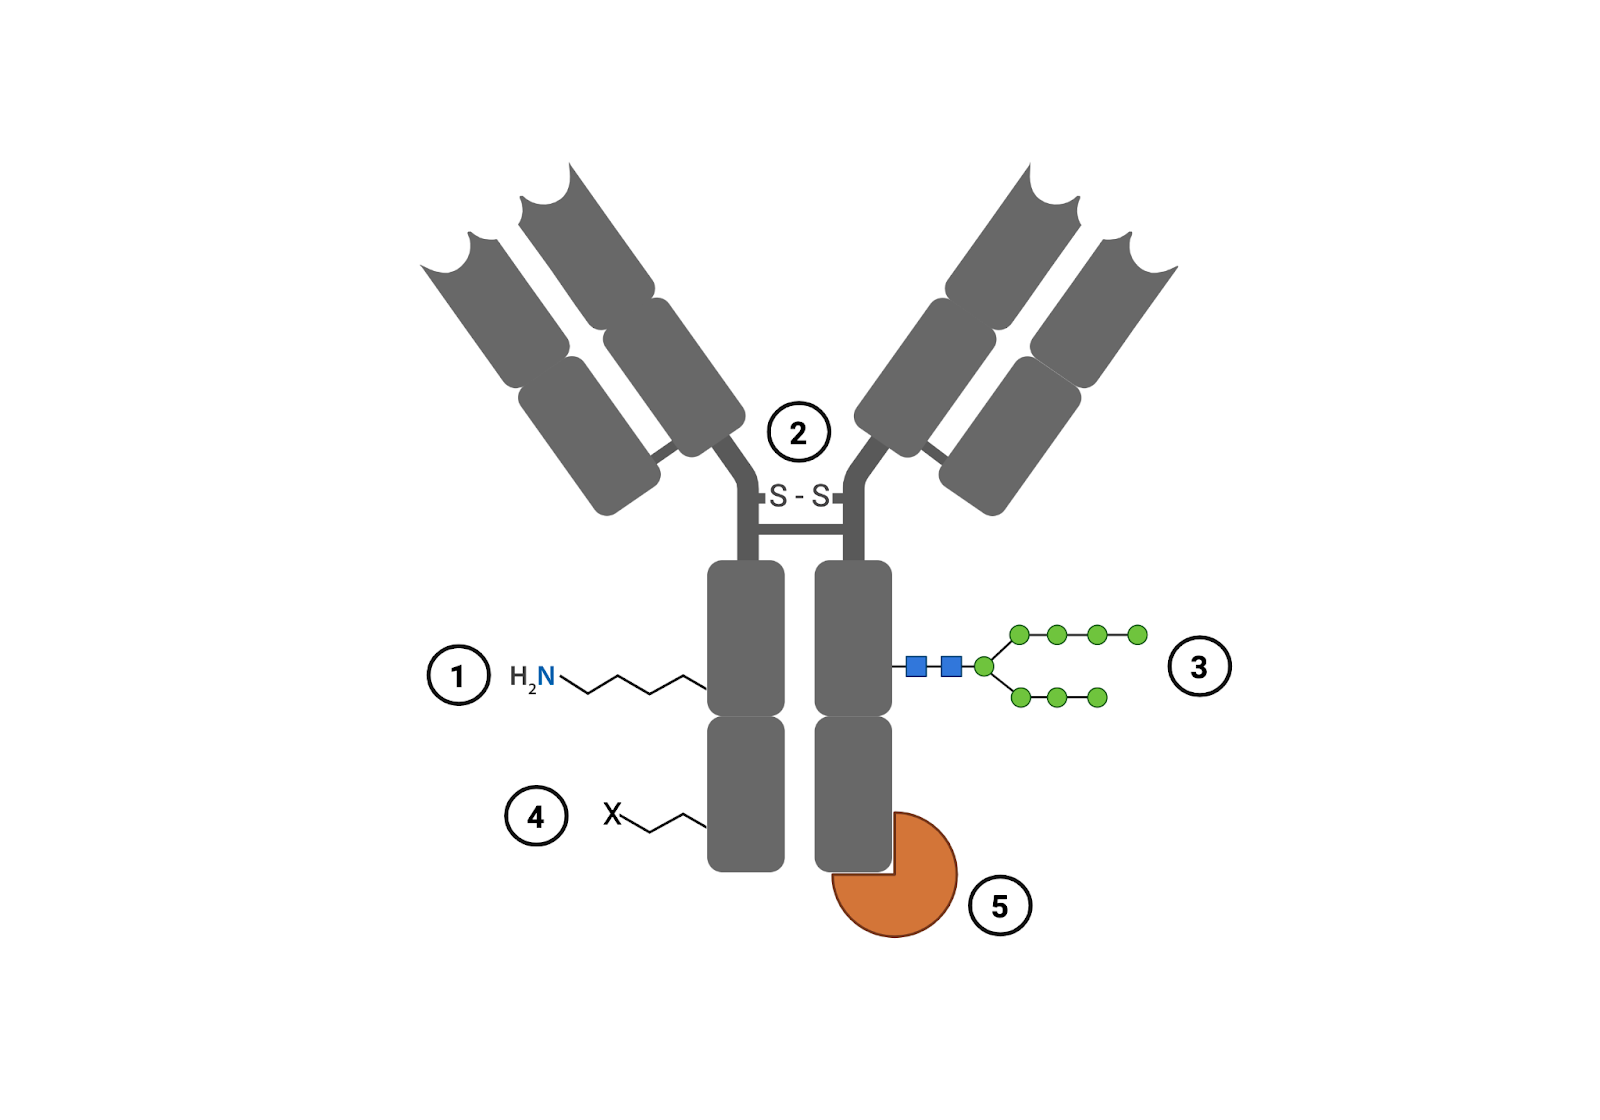
Imagine an antibody. Do you immediately visualize a Y-shaped protein reminiscent of the Addgene mascot Abi? If so, you are not alone. Full-sized antibodies dominate the world of research affinity reagents, and for good reason. However, sometimes you want a tool that is a little ...
If you’ve ever been looking for just the right CRISPR vectors on Addgene and found instead ones that were… pretty close, or at least close enough, you’ve found yourself with a common dilemma. Request the vectors you can find and use them as-is, saving time and effort but risking ...
Every few months we highlight some of the new plasmids, antibodies, and viral preps in our repository through our Hot Plasmids articles.
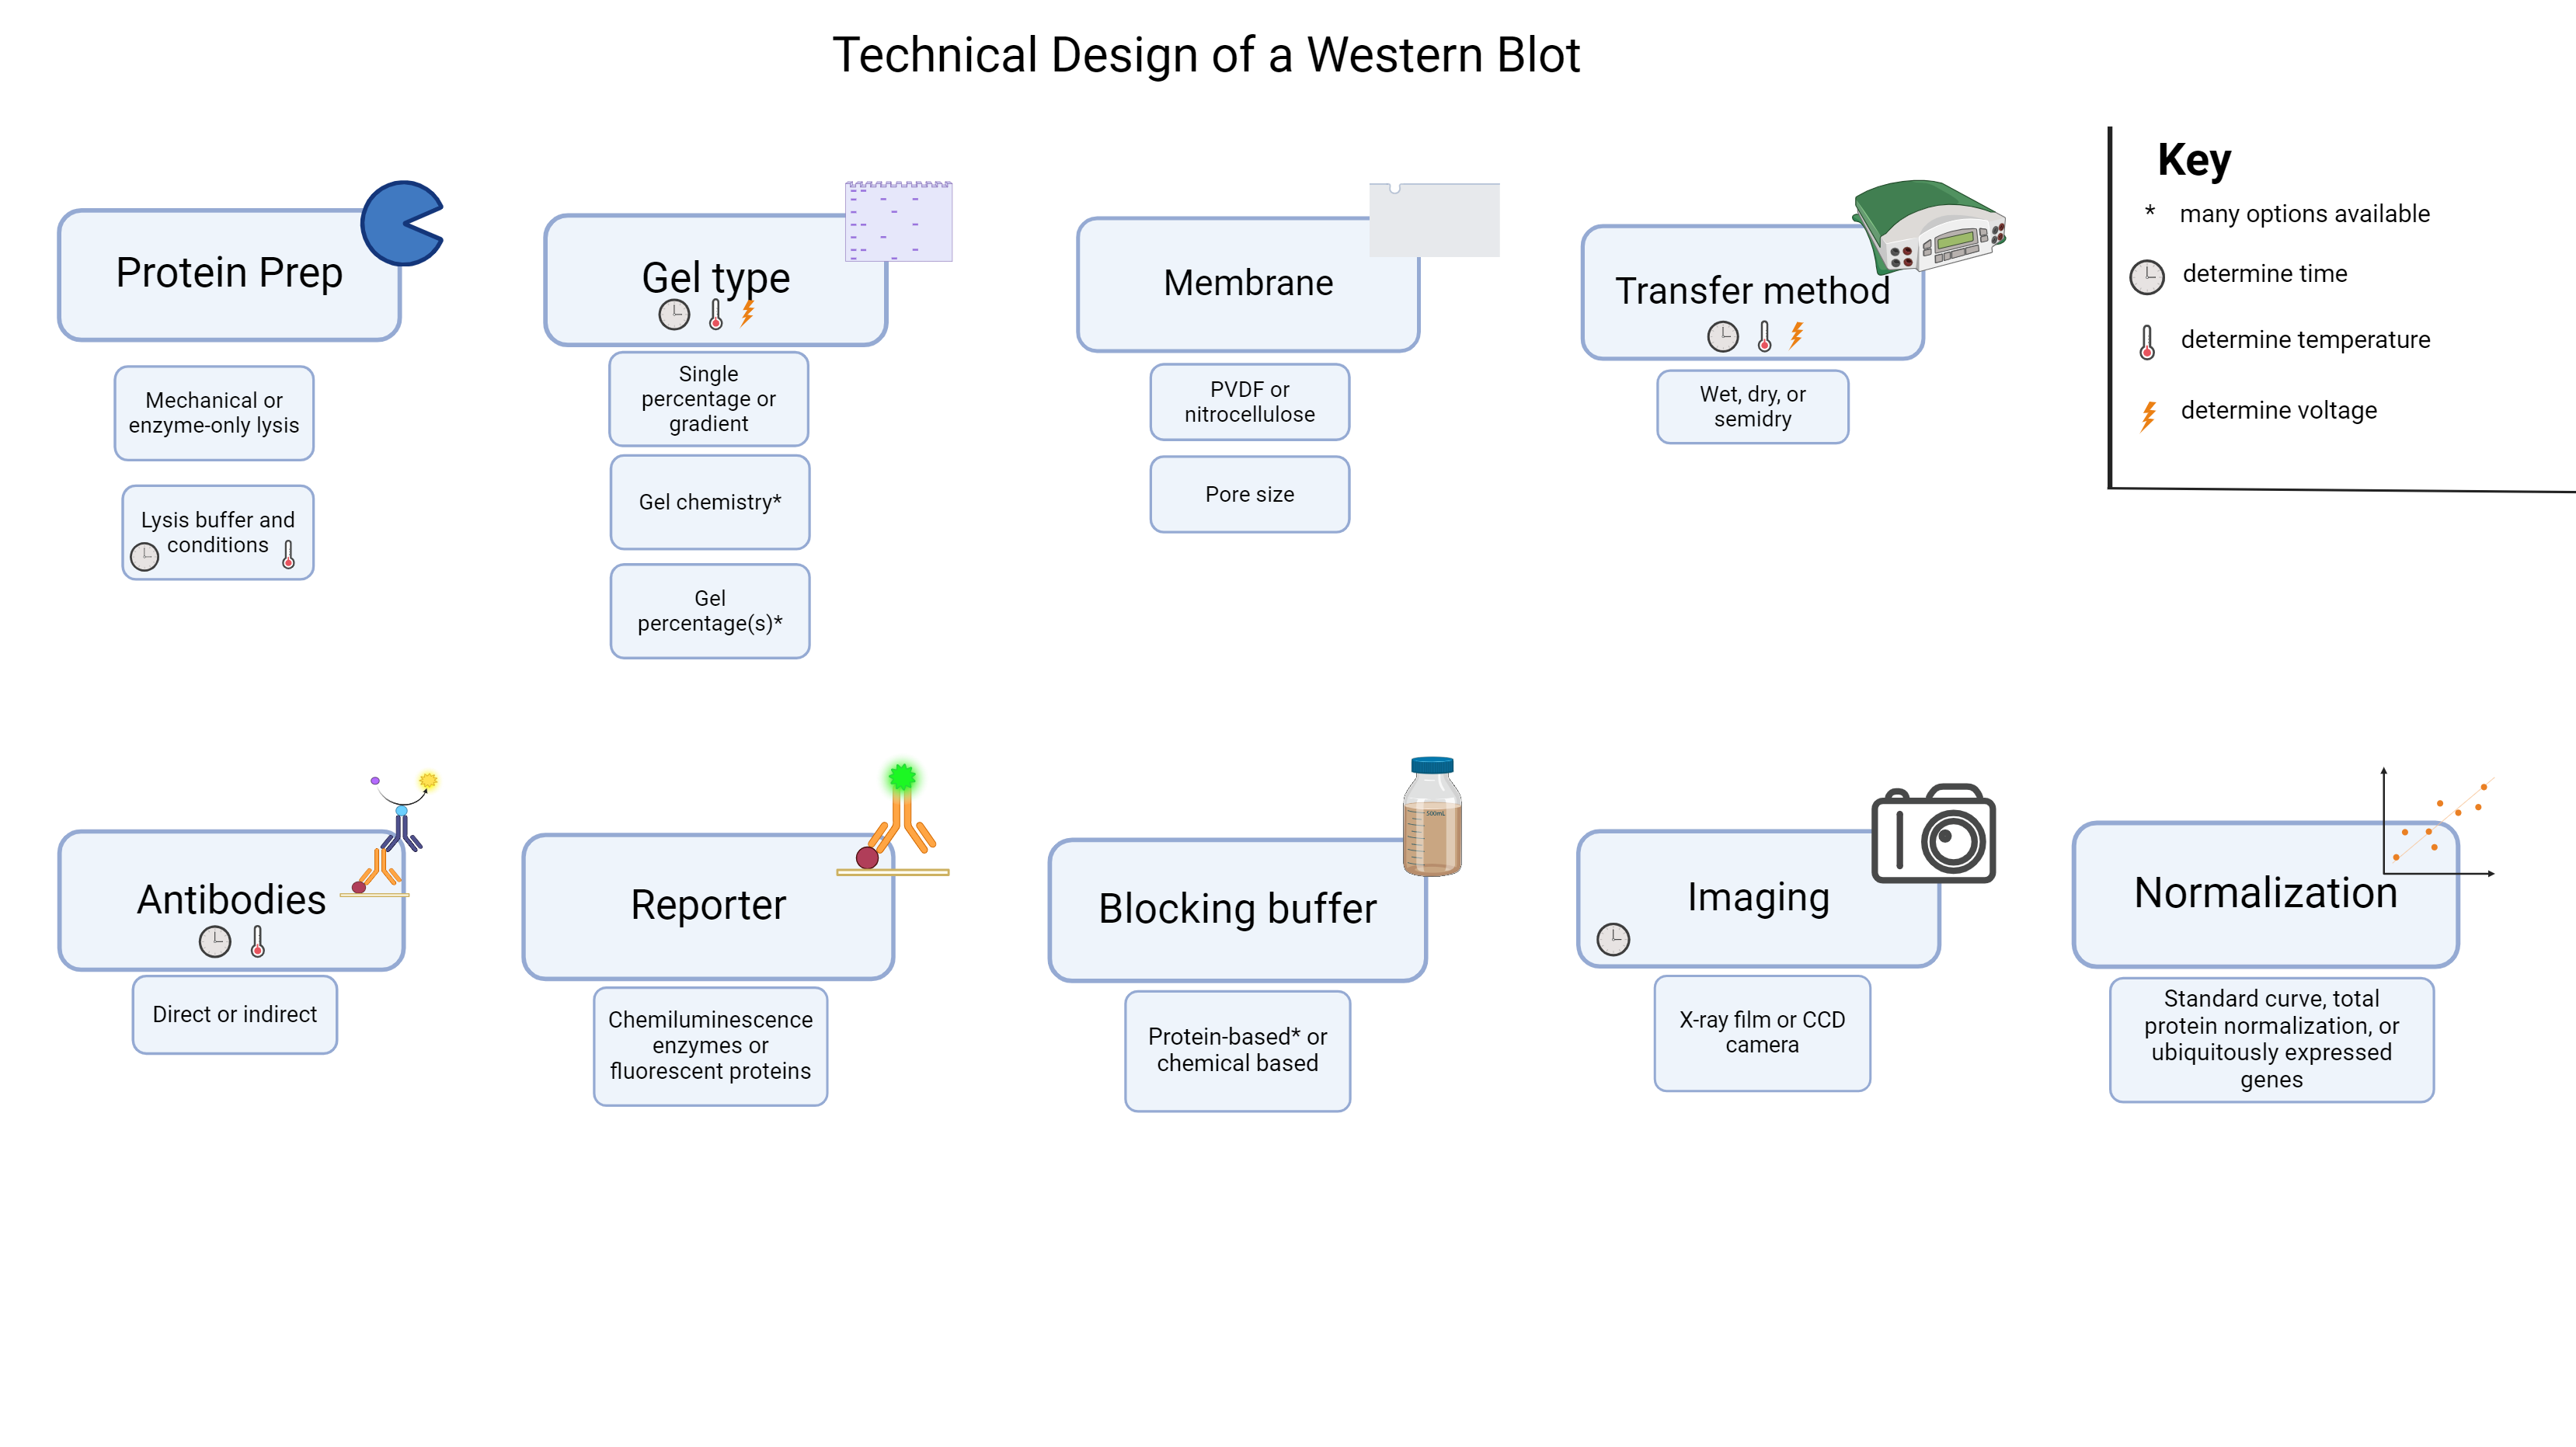
If you’ve ever run a western blot, or thought about running one, you’ll know there’s a lot of choices to make when designing the experiment. What detection method? What membrane? What should you block with?
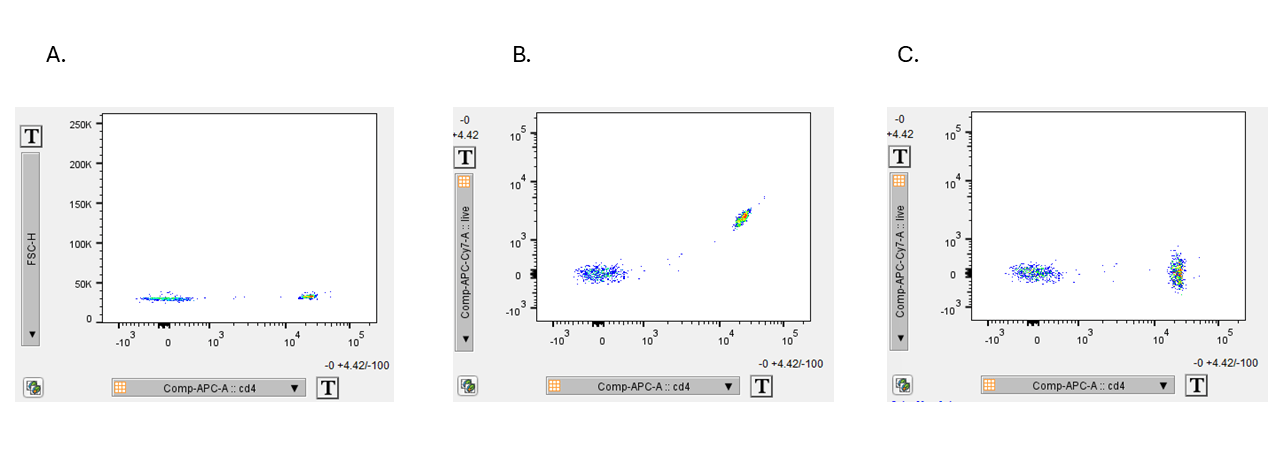
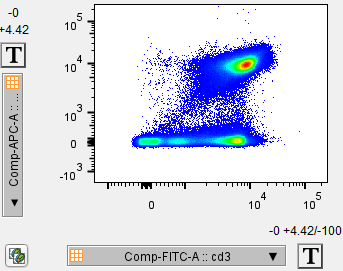
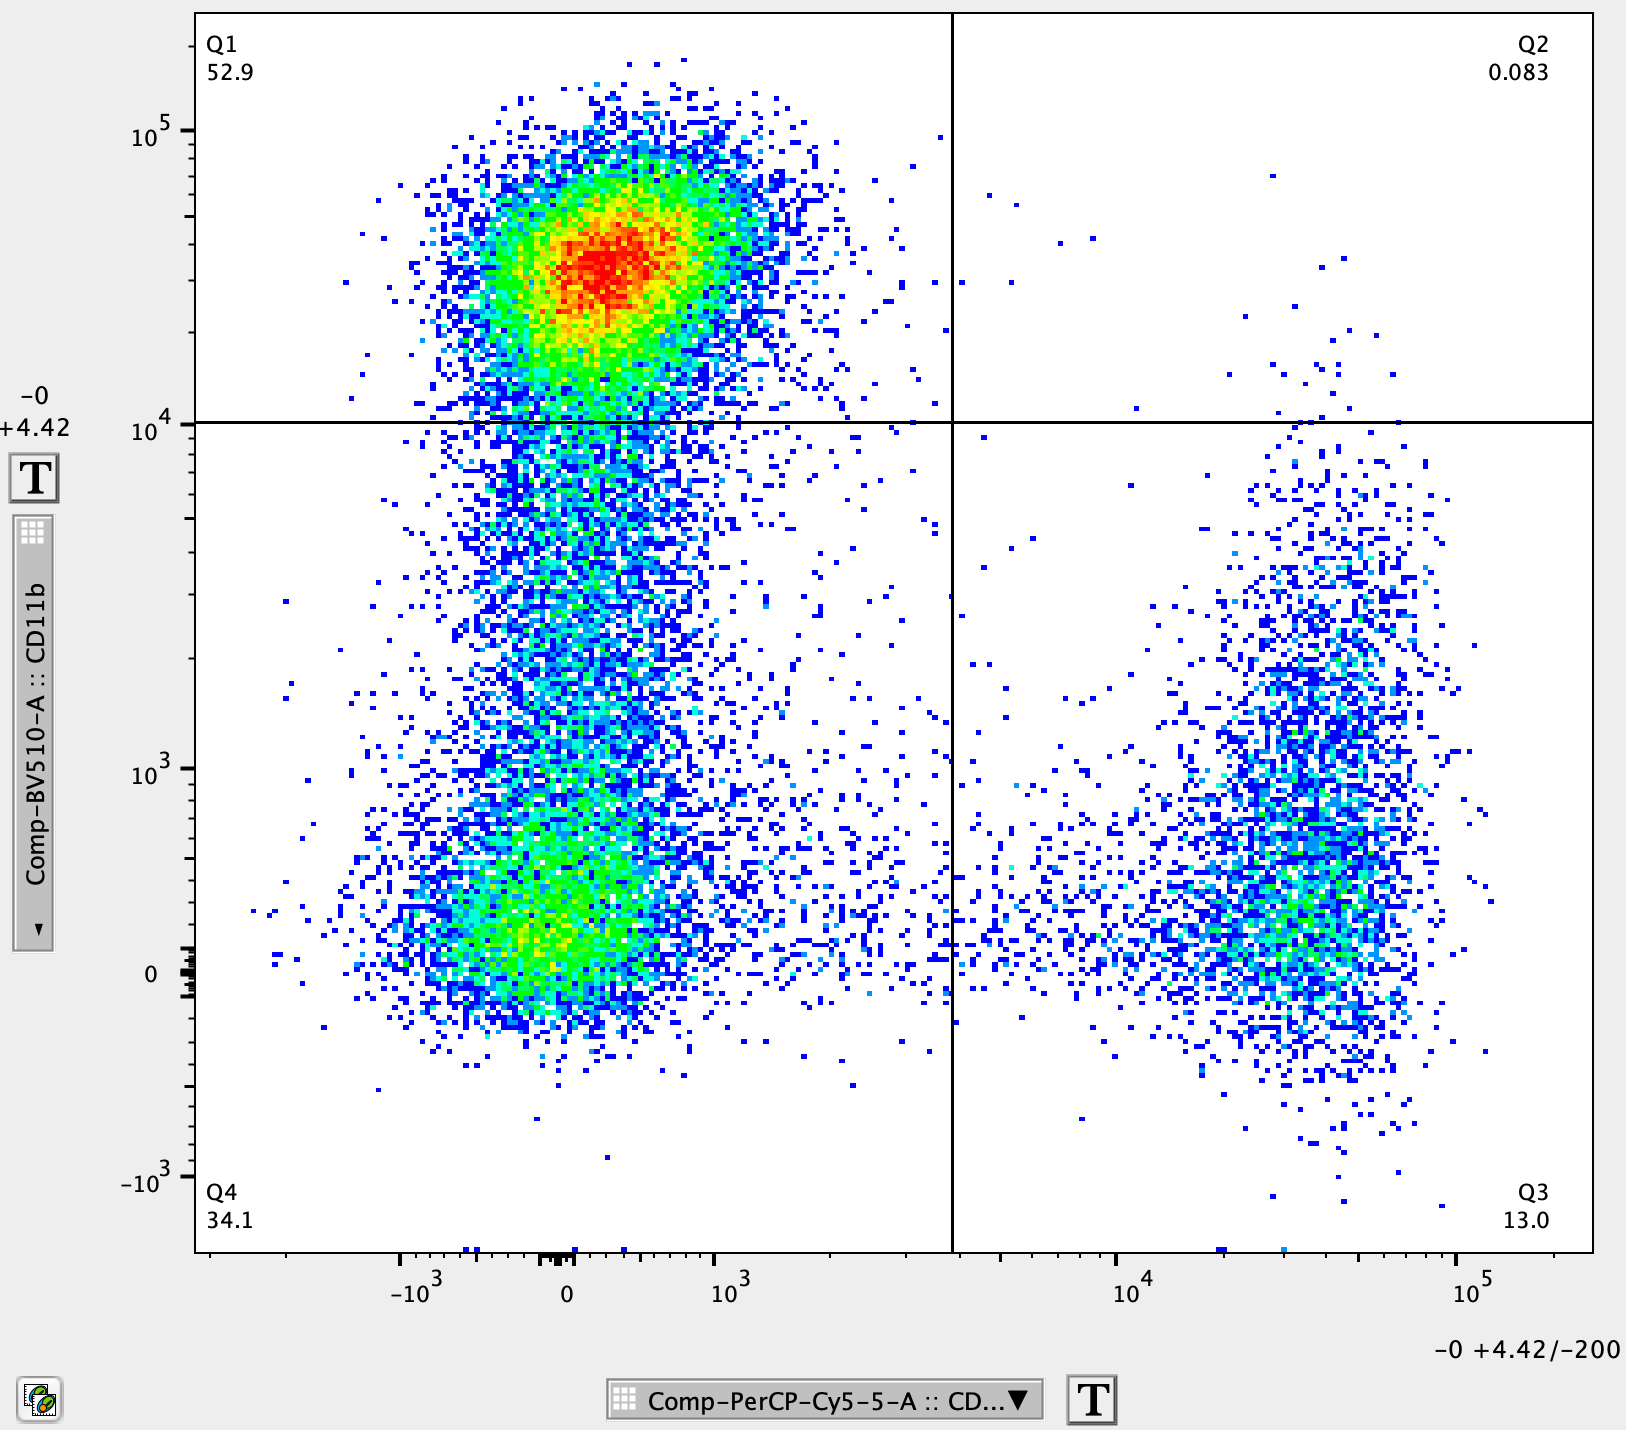
Now that you know how to read flow plots and have designed your first flow panel, you’ll load your samples into the cytometer and see one of two results for your antibody of interest: two clear populations or a huge smear across your FSH vs reporter plot. In this post, I’ll walk ...
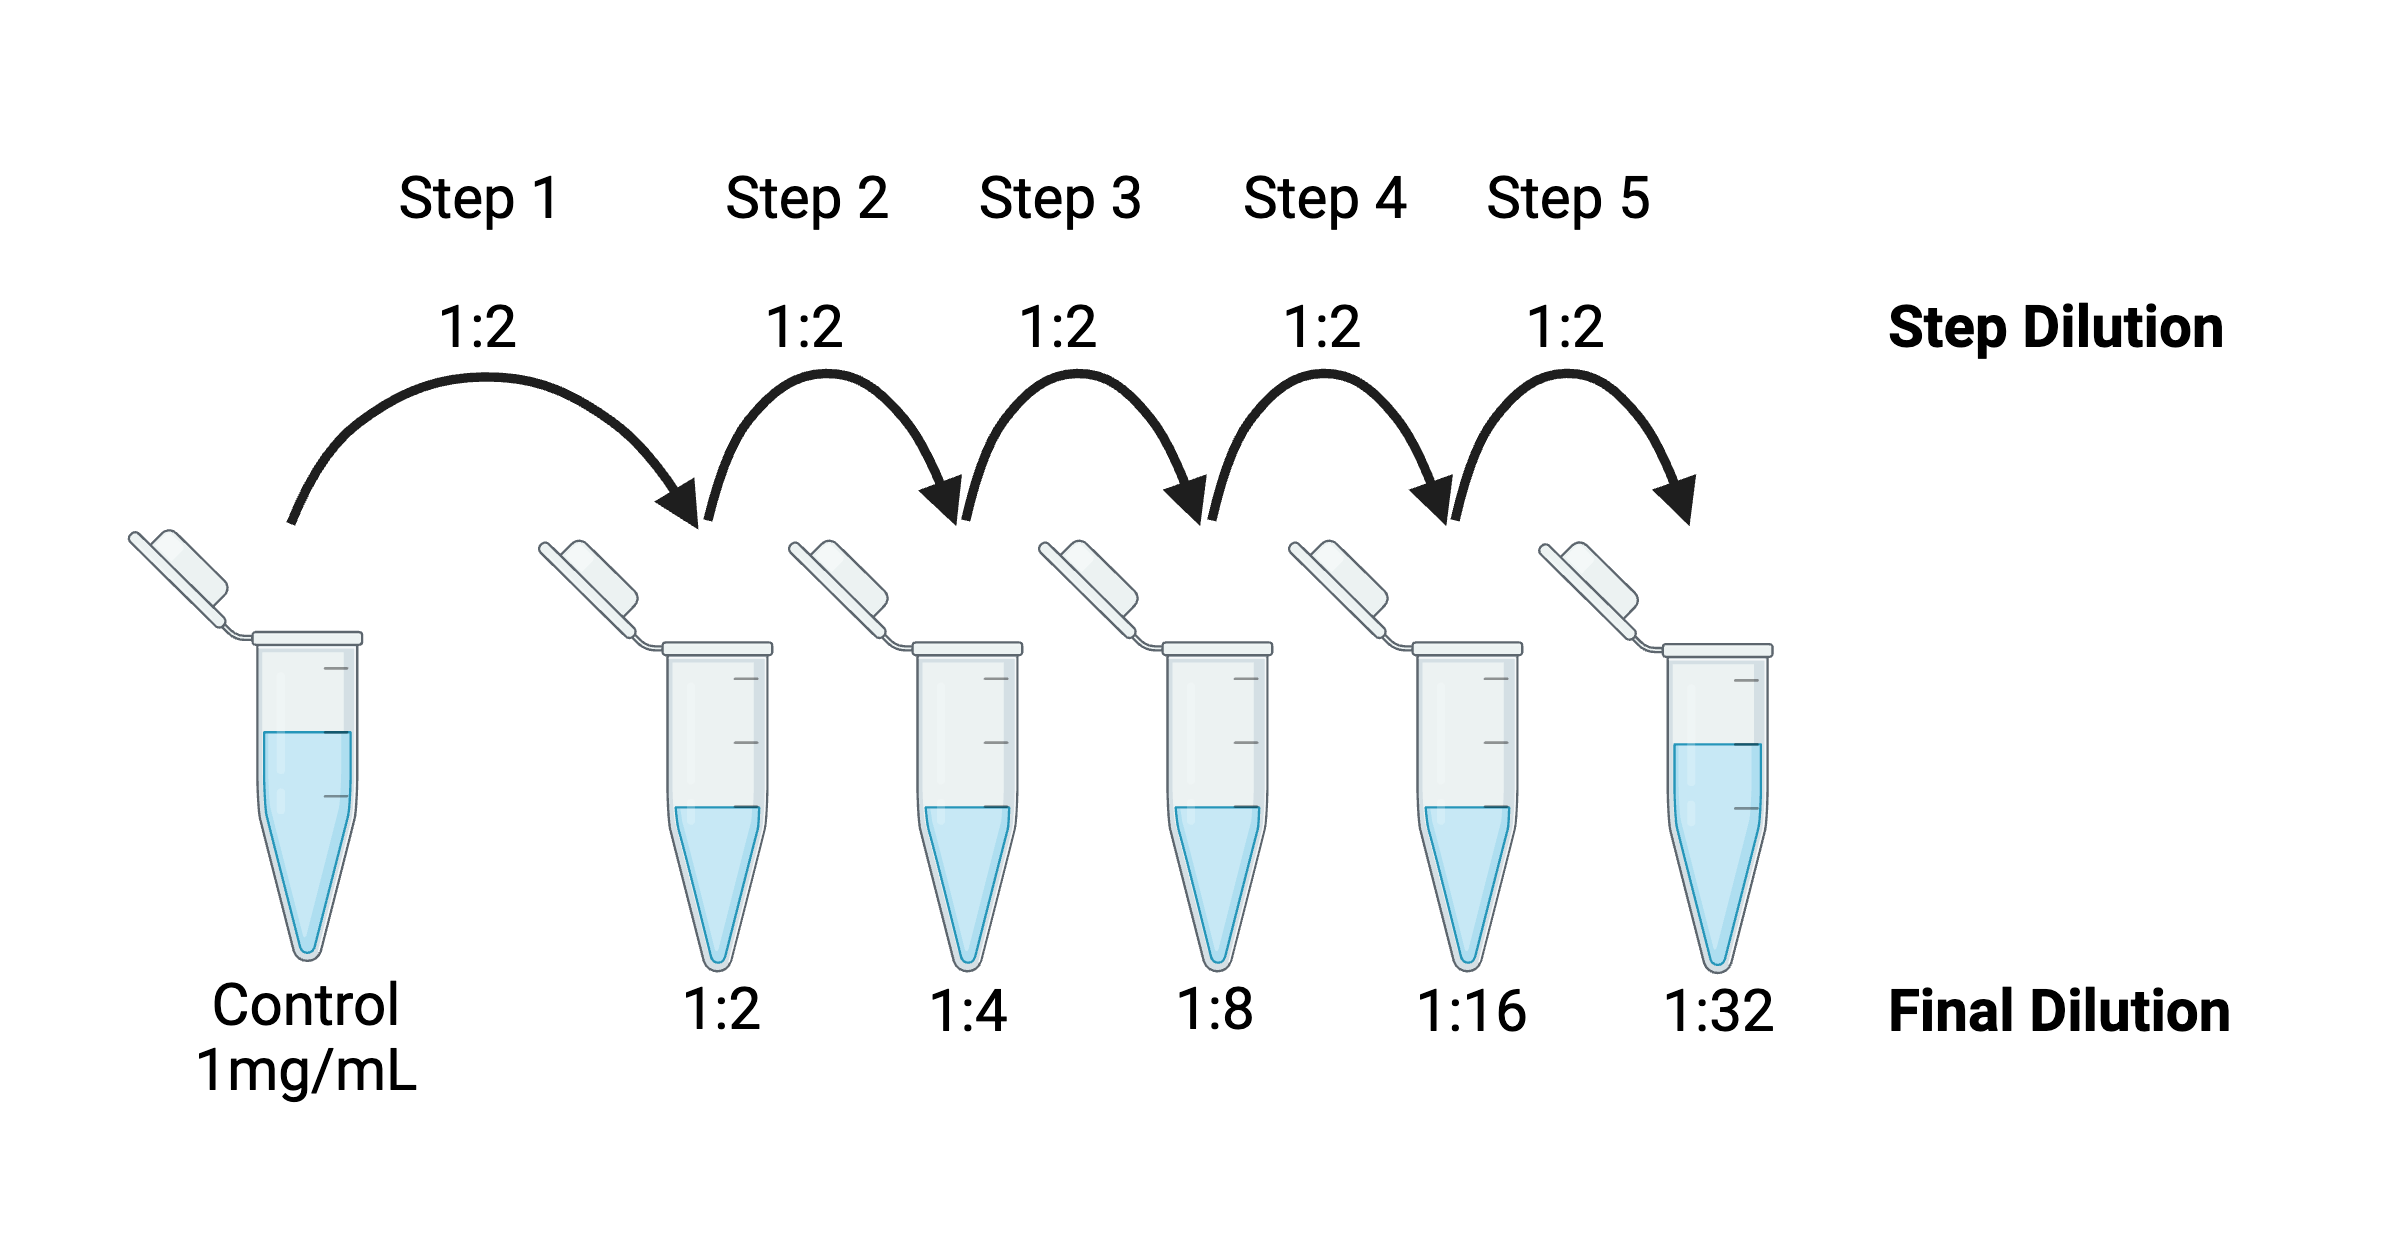
What do a viral vector production facility, food allergy testing lab, and the grad student down the hall from you have in common? All of them rely on standard curves in their day-to-day work. Indeed, viral vector production facilities frequently use qPCR with a standard curve to ...
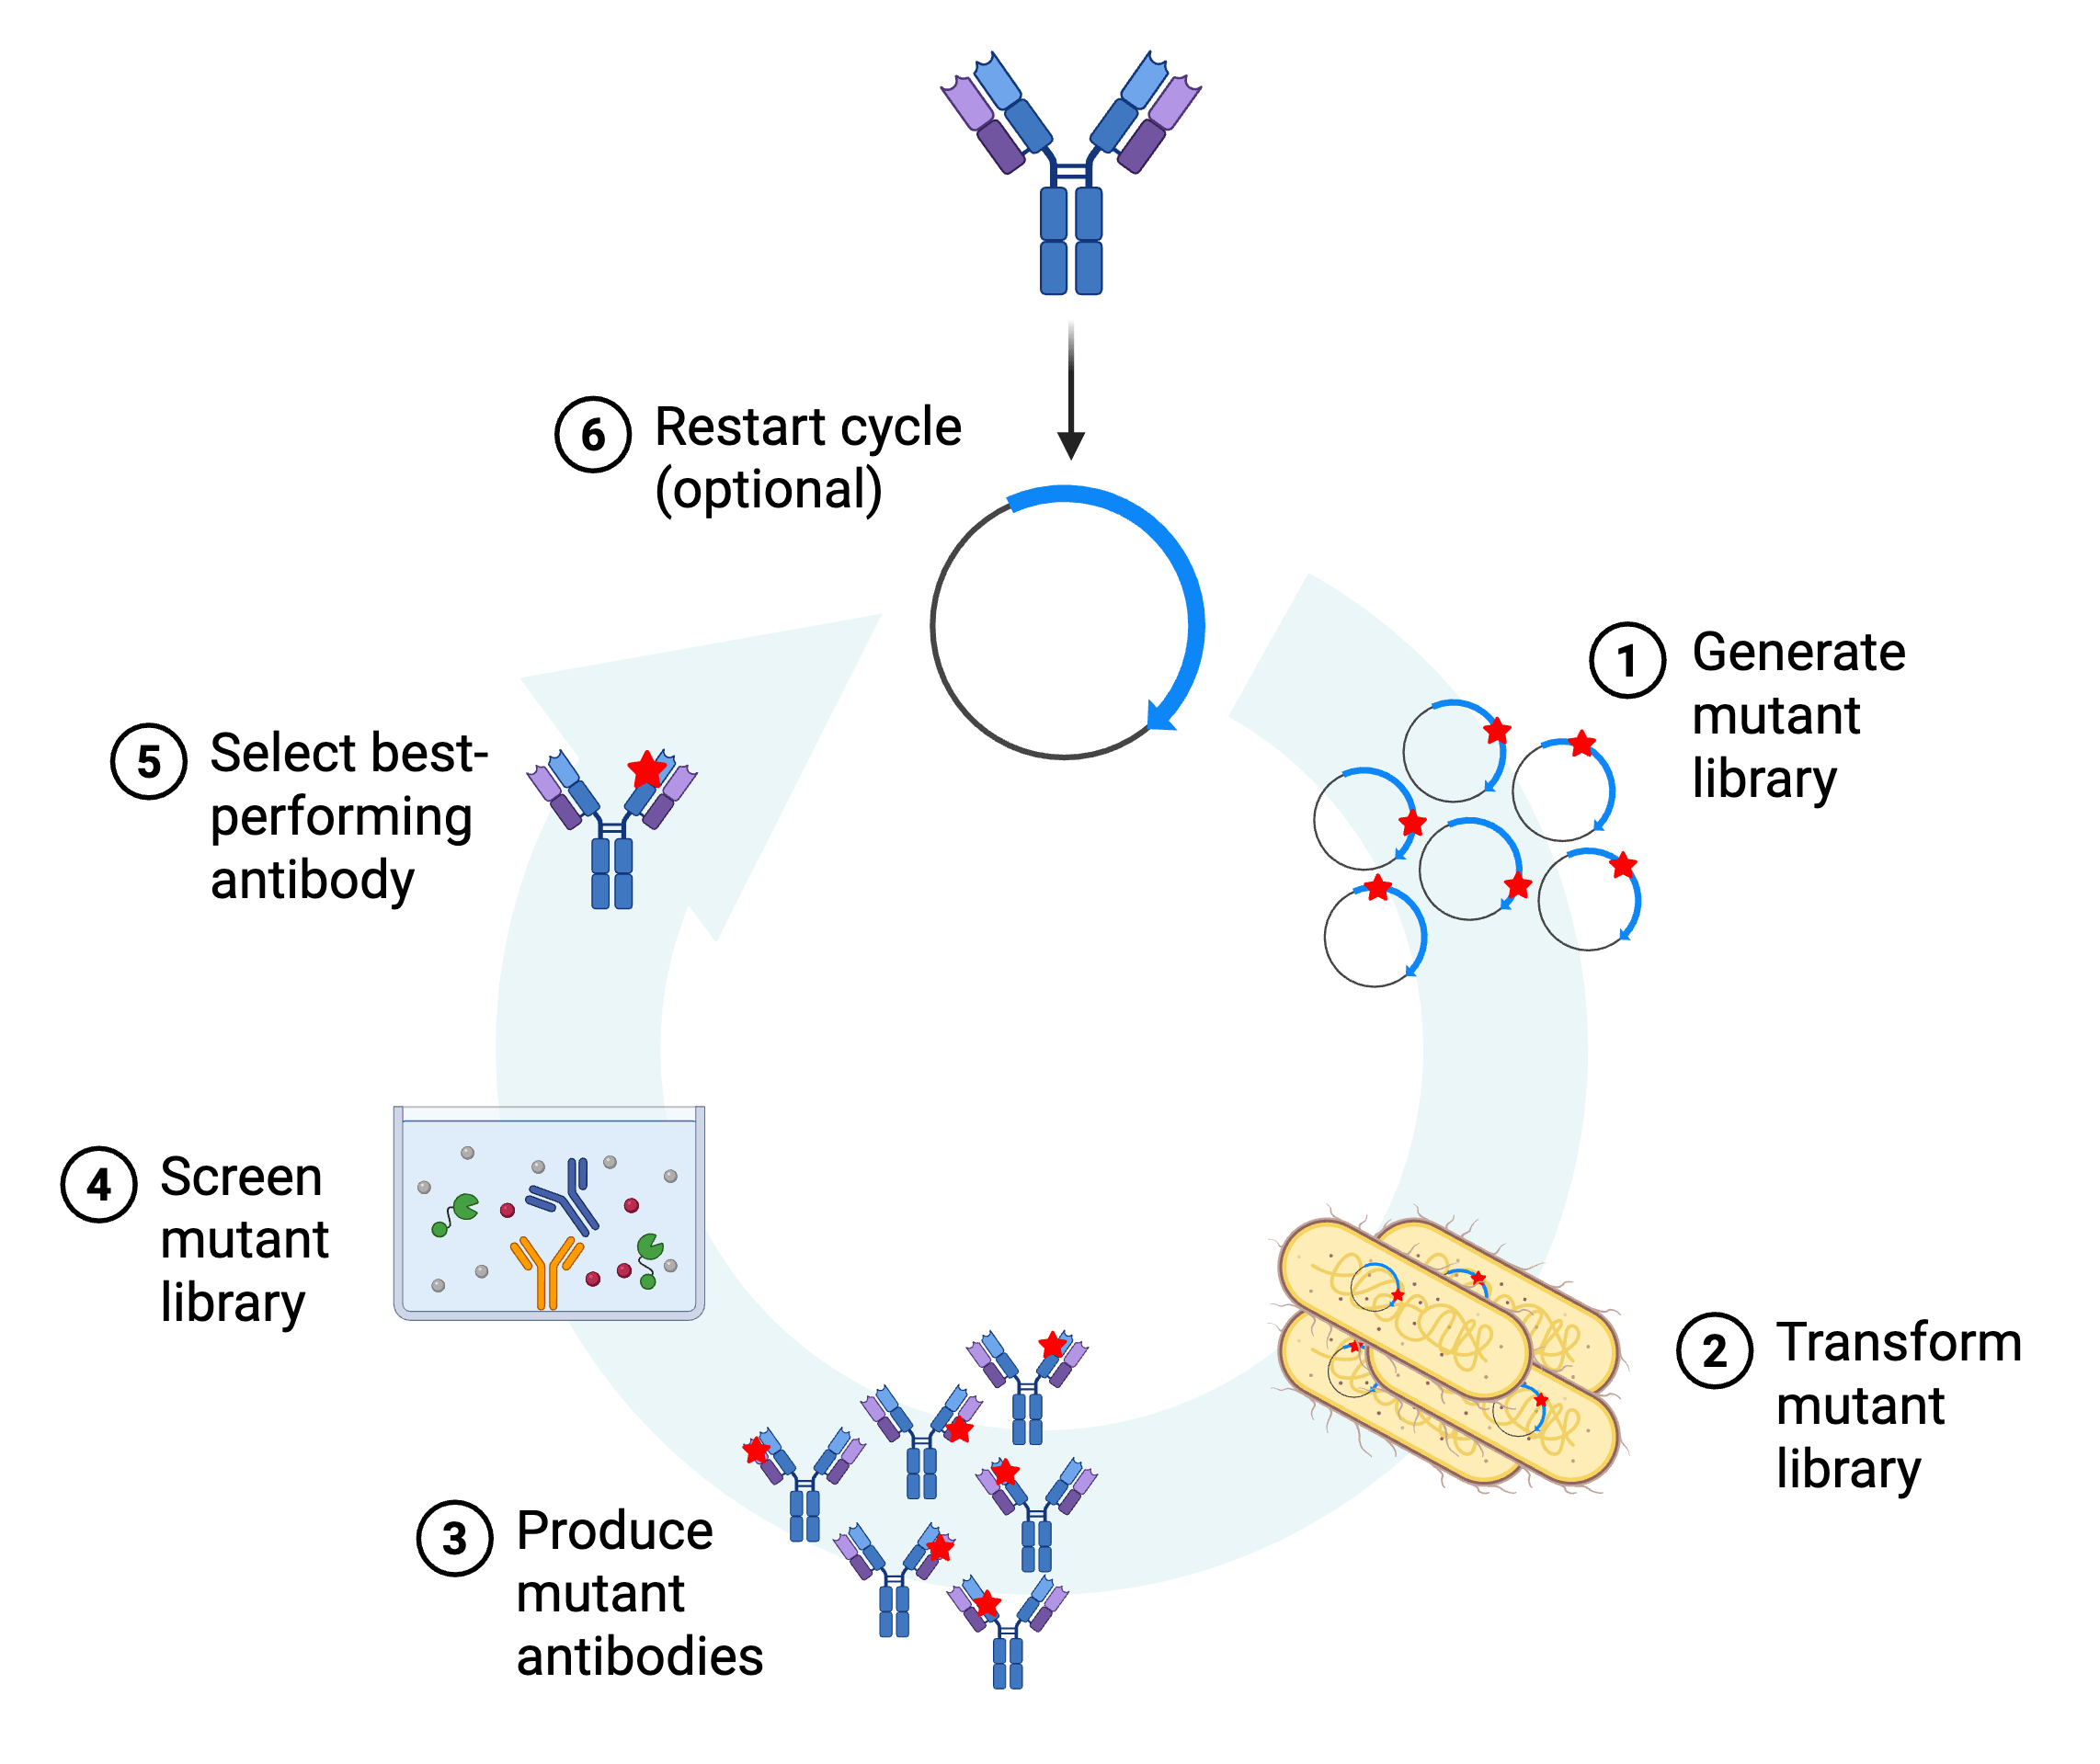
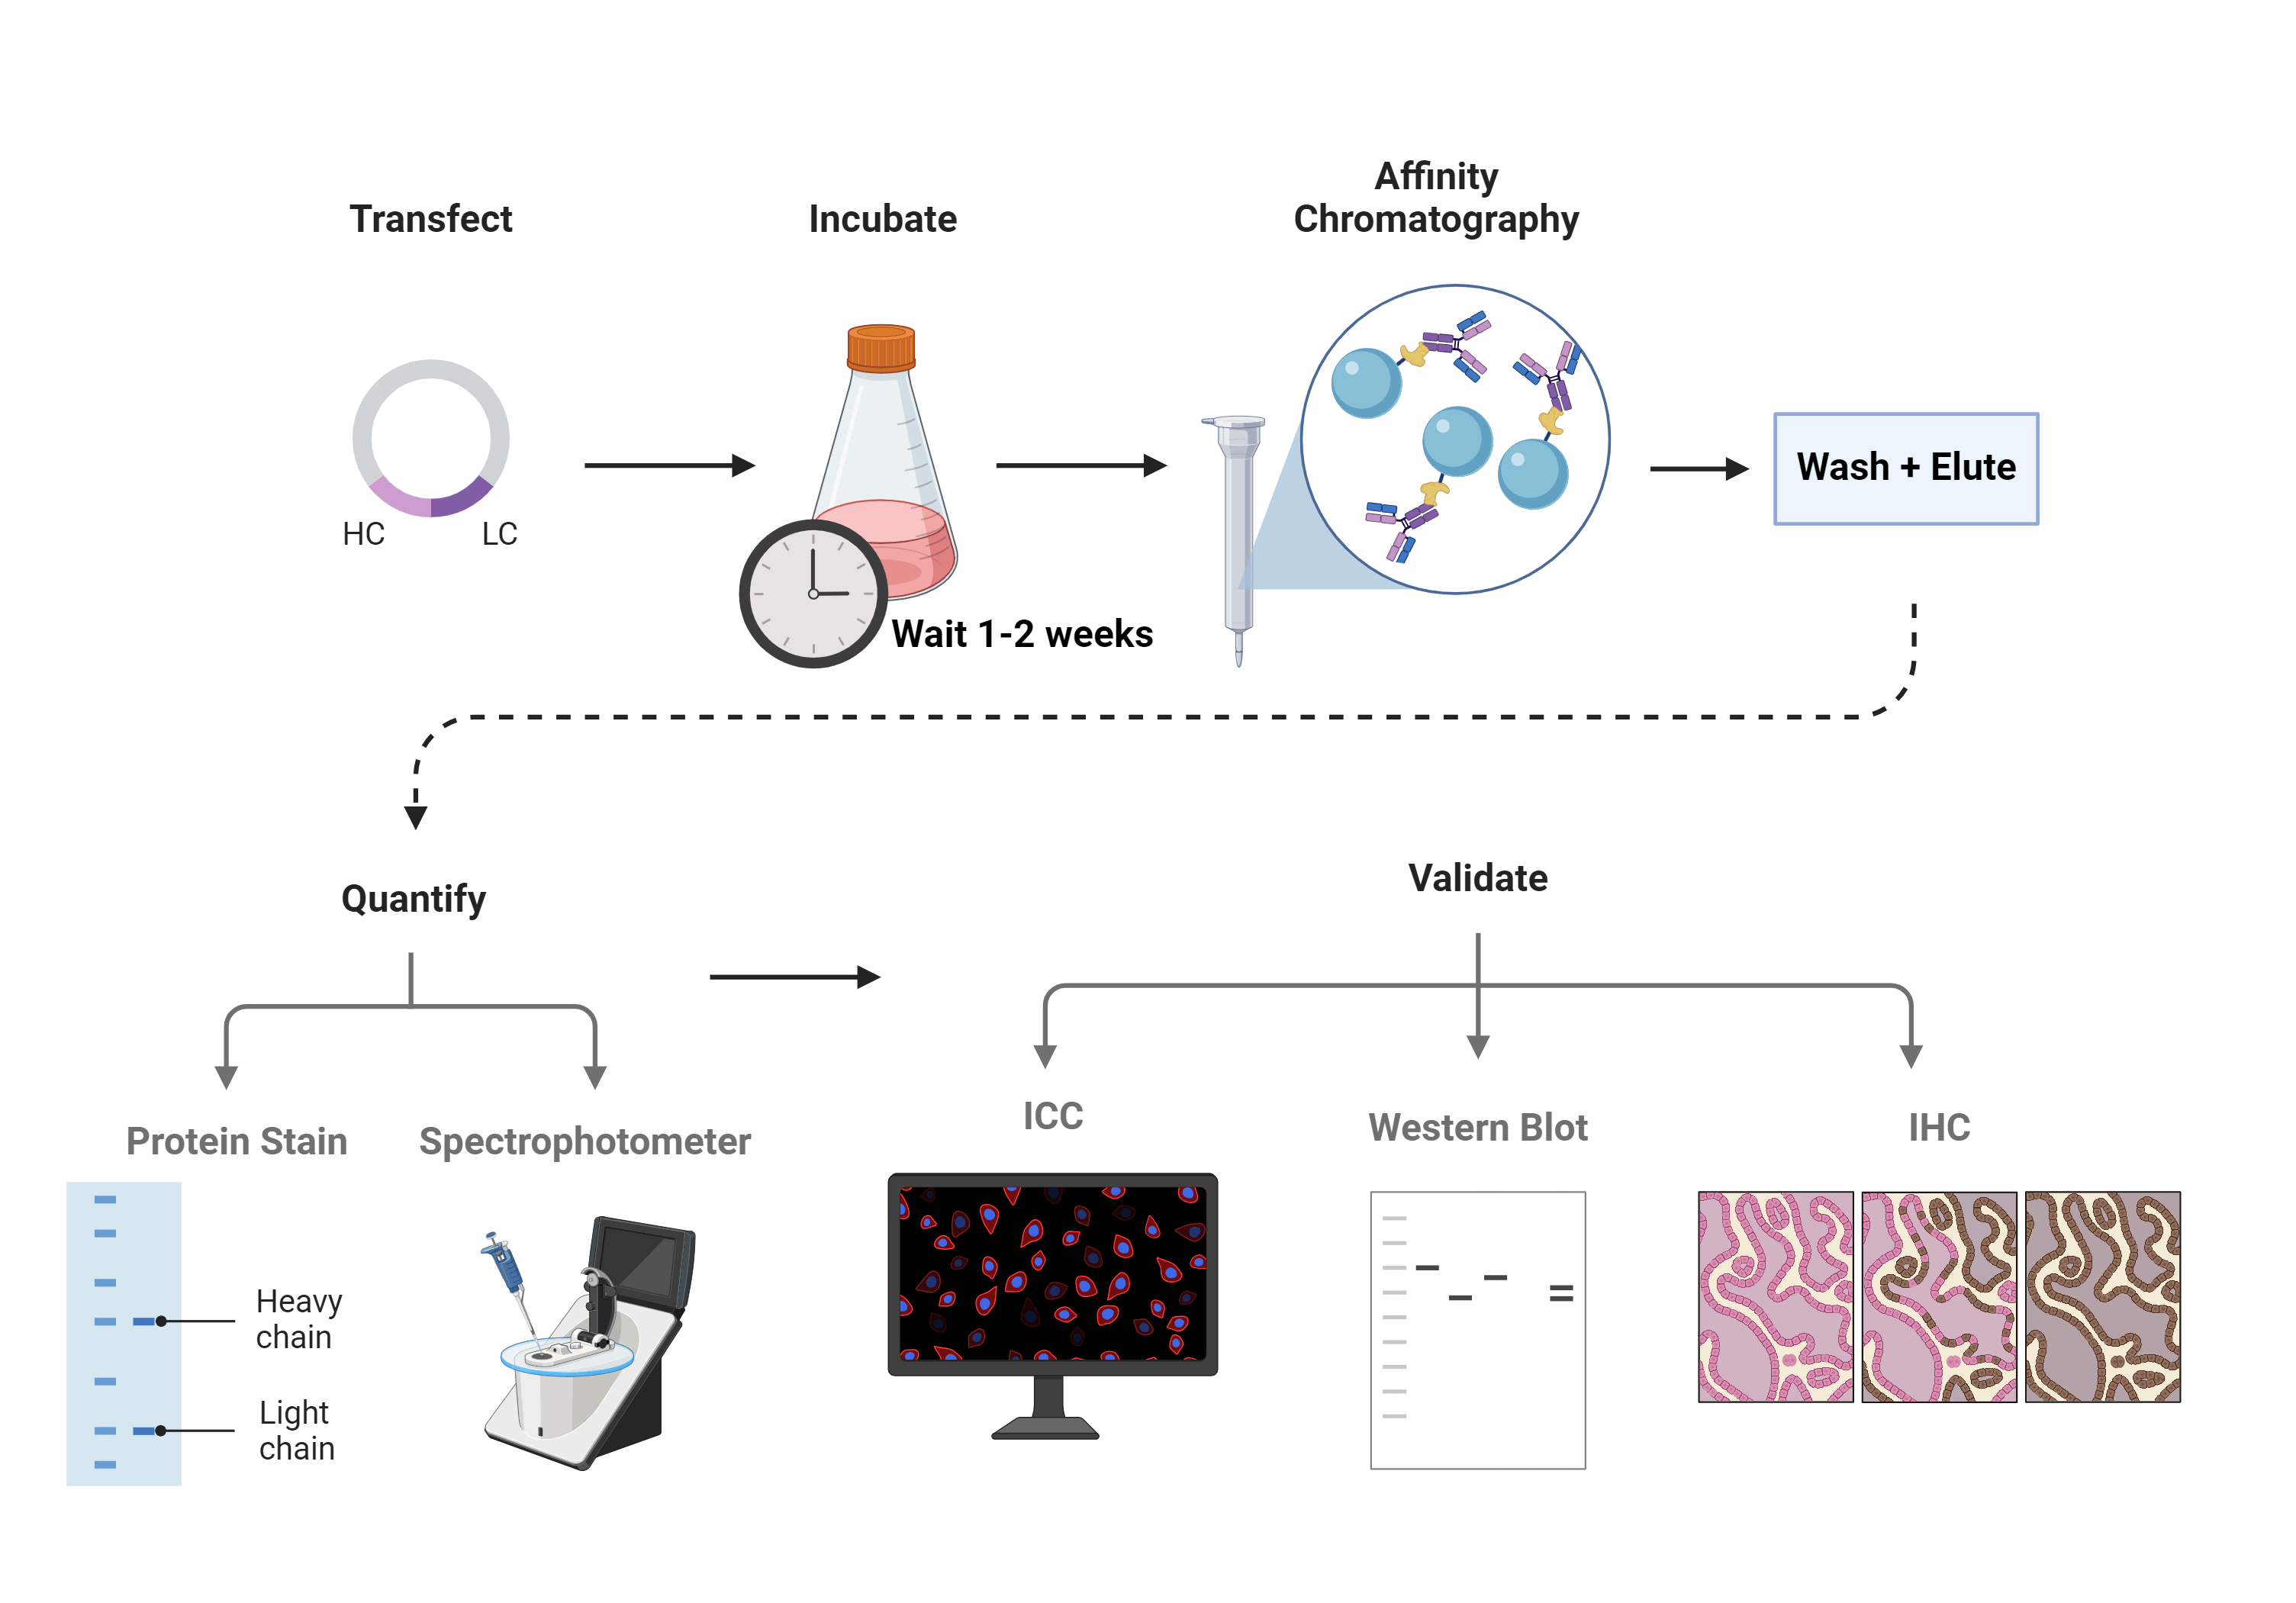
While monoclonal and polyclonal antibodies are readily available from several sources, fewer sources of recombinant antibodies (rAbs) exist (though Addgene has a great collection of ready-to-use rAbs and rAb plasmids!). Since recombinant antibodies conveniently allow for ...
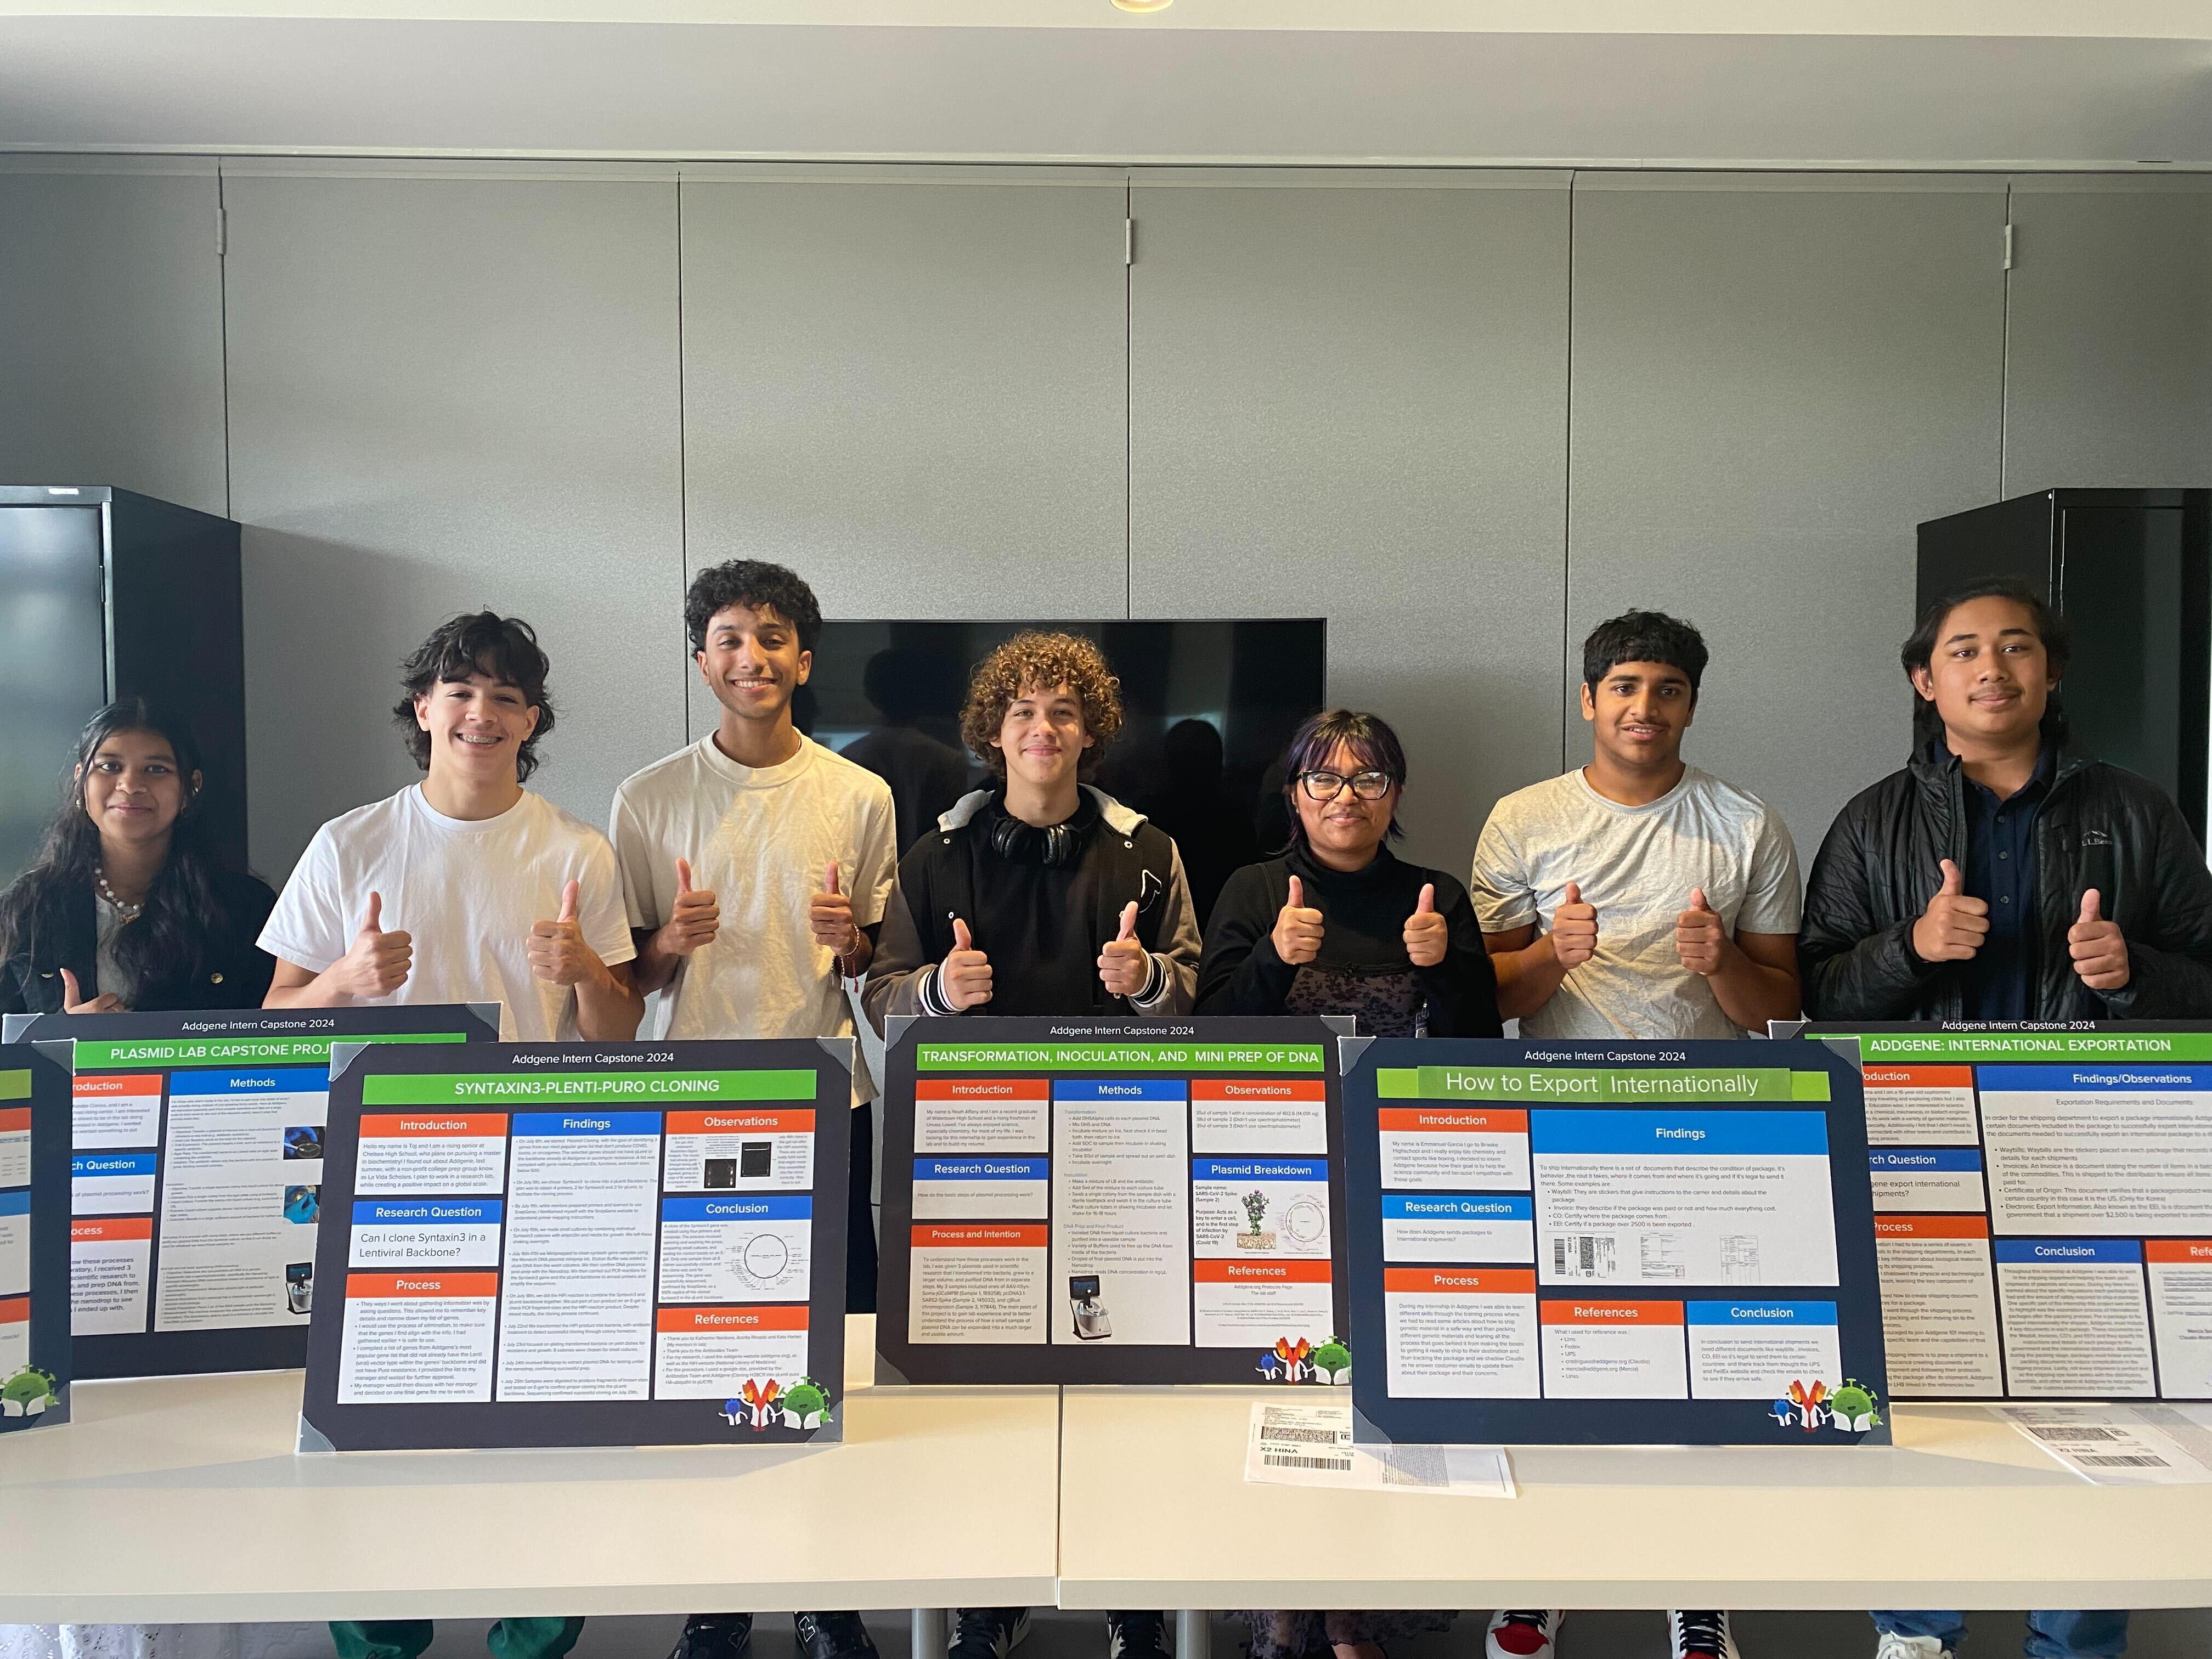
I never would have imagined that my summer before high school senior year would have been spent within a lovable community that has allowed me to expand my knowledge more than ever before. Before joining Addgene, I had spent most of my junior year stressed out applying for ...
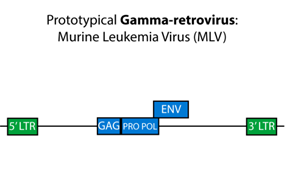
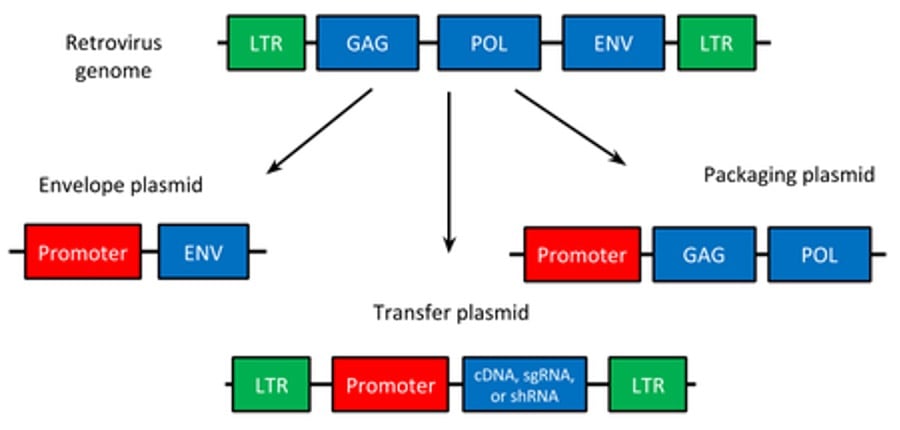
The widespread use of γ-retroviruses (gamma-retroviruses) in cancer and stem cell research has prompted the development of multiple virus packaging methods. Across these methods, the following components are needed:
Western blots are a great tool to identify a protein of interest in a complicated solution like cell lysate. But they can be a lot of work — and what if you want to detect more than one protein in your sample? Or what if something weird happened during your western and your ...
As part of Addgene’s 20th anniversary celebration, we’ve been finding and sharing stories unique to our repository and resources. As editor of Addgene’s eBooks — including the recently released Viral Vectors 101 2nd edition — I was incredibly excited when we picked our viral ...
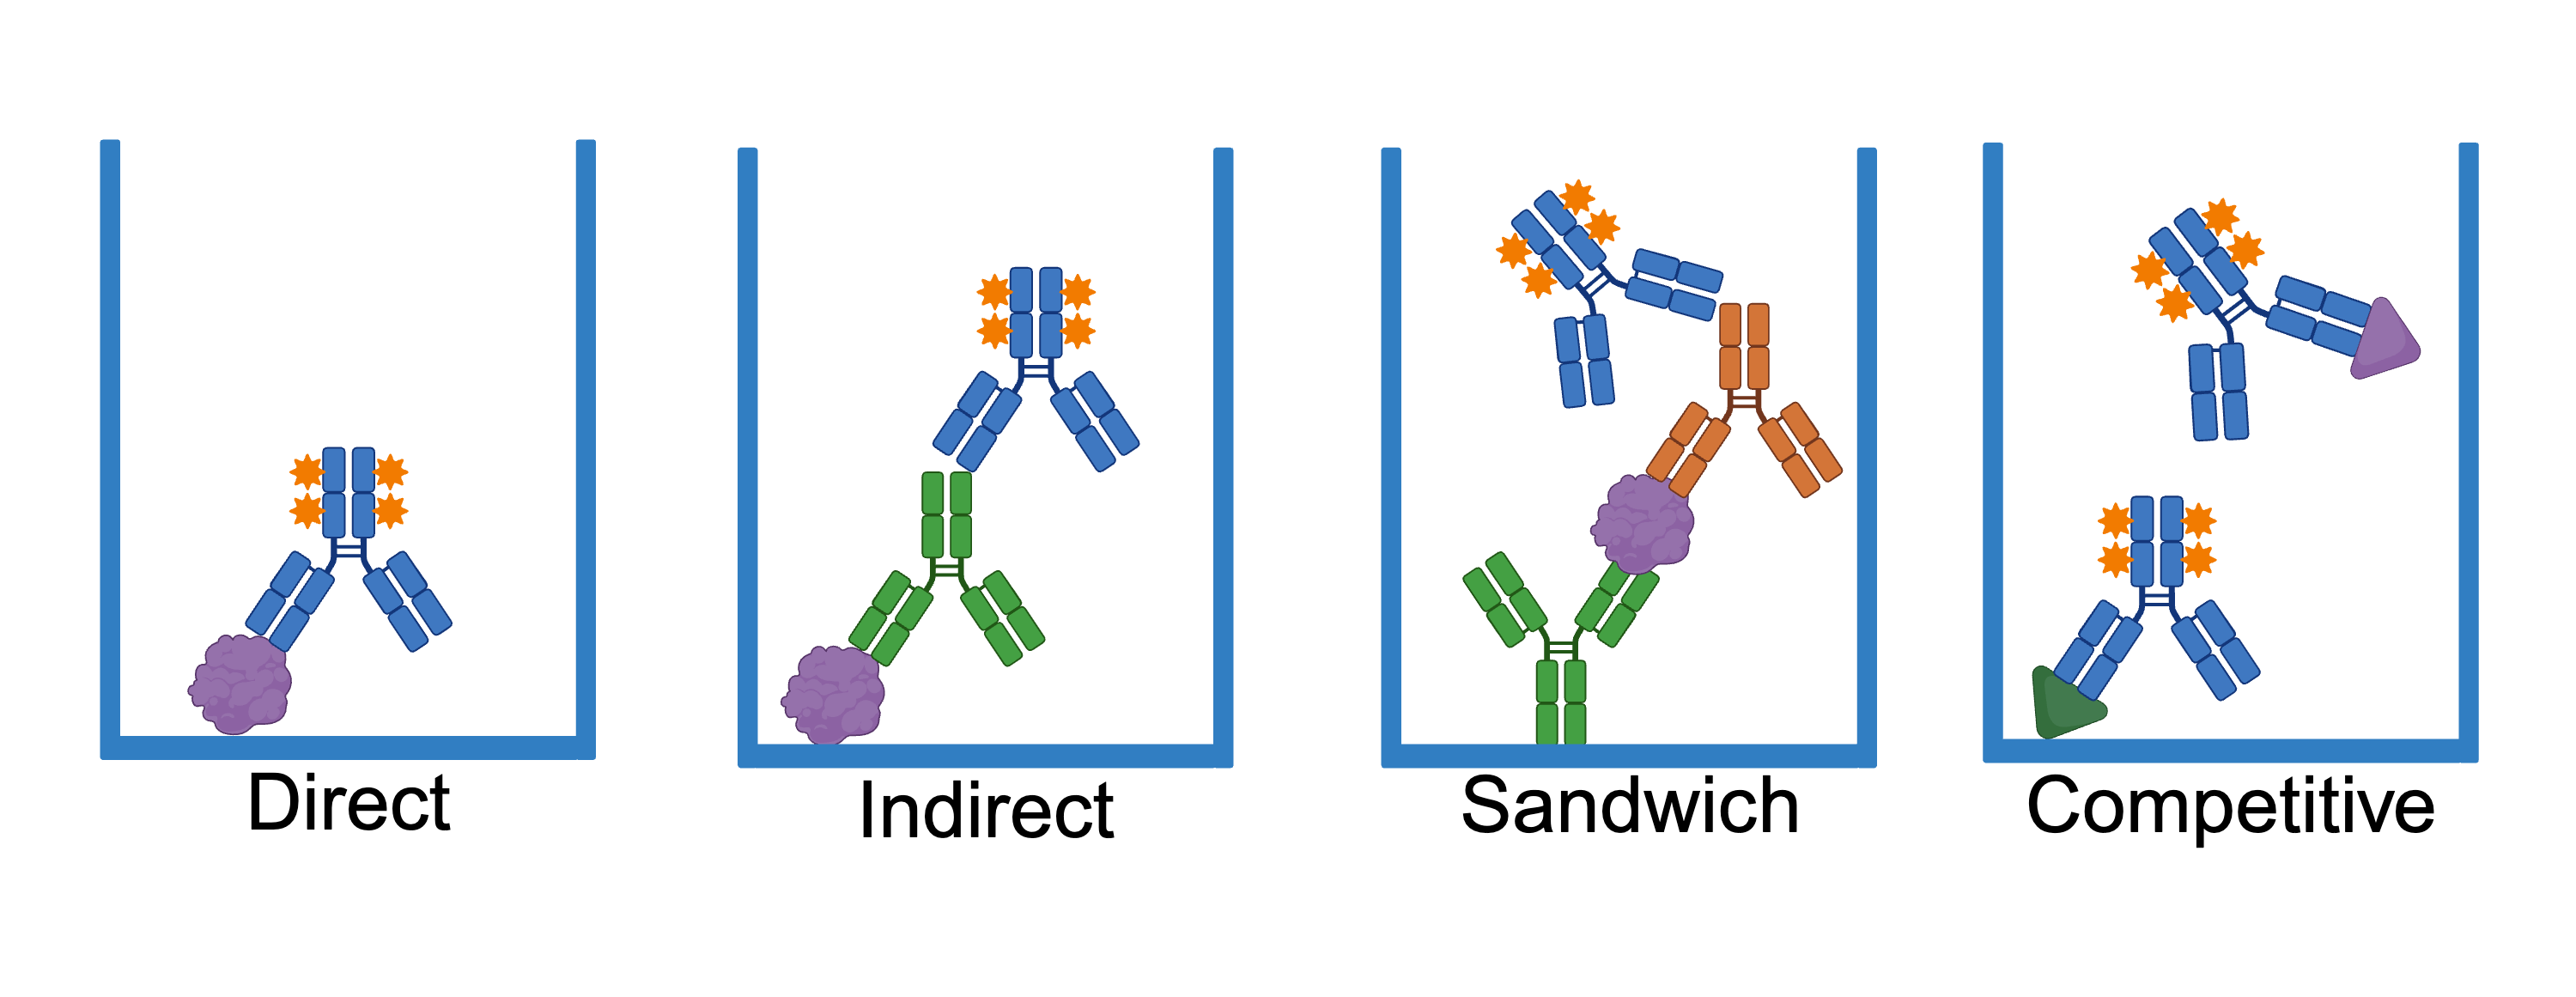
An enzyme-linked immunosorbent assay (ELISA) is a versatile method used to quantify the level of target antigen in a sample. While Engvall et al. originally developed the ELISA assay to measure antibody levels, scientists have since adapted it for a host of different proteins ...
If you’ve deposited or requested plasmids from Addgene, then you’ve been involved in the material transfer agreement (MTA) process. Even though this process is essential to sharing plasmids around the globe, it can be a bit of a mystery for those who aren’t familiar with it. If ...
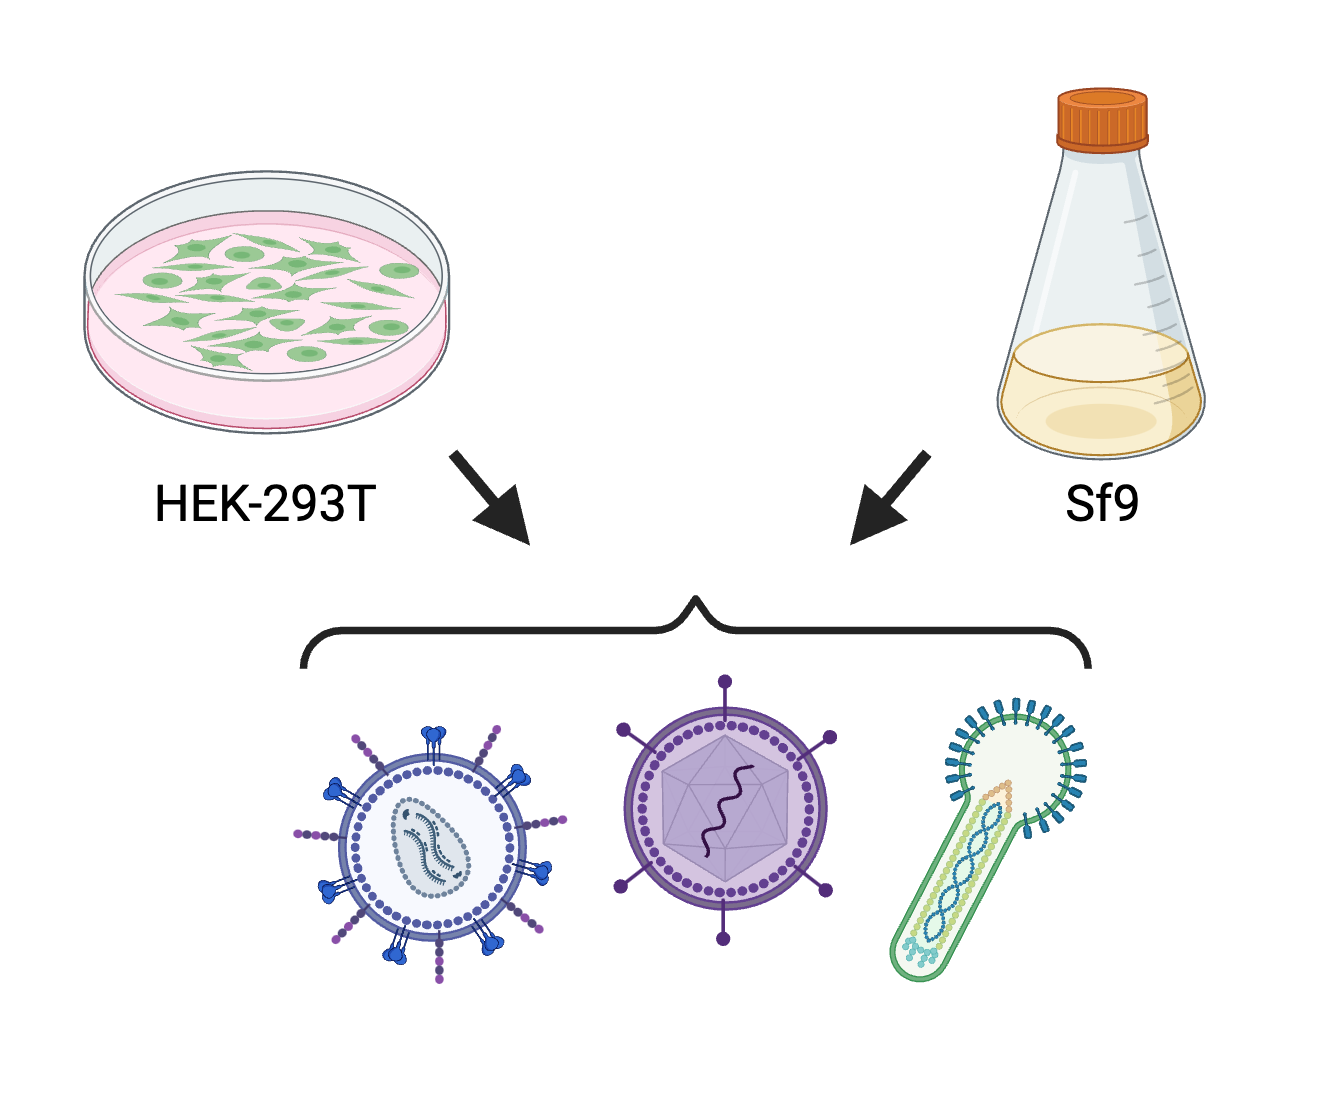
There are several facilities nationwide where you can obtain excellent quality, high titer rAAV (including Addgene!), but you can also generate rAAVs in your own lab with standard molecular biology tools and tissue culture experience. Here, we’ll go over the basics of rAAV ...
We are very excited to share the latest edition of our Viral Vectors 101 eBook!
What's new in Addgene's ready-to-use viral vectors repository? Quite a bit! In this post, we'll share the 20 additions we've made to our viral vectors repository since March.
CRISPR is a sleek acronym for a real mouthful of a phrase: Clustered Regularly Interspaced Short Palindromic Repeats. That contrast of simplicity and complexity is reflected in the biology, too. CRISPR is an elegant bacterial immune system and an efficient gene editing tool… but ...
When it comes to labeling cells for flow cytometric analysis, the most common method is a cell surface label, where fluorophore-conjugated antibodies directly bind to epitopes of interest that are found in the extracellular space. The targeted epitopes can be motifs within ...
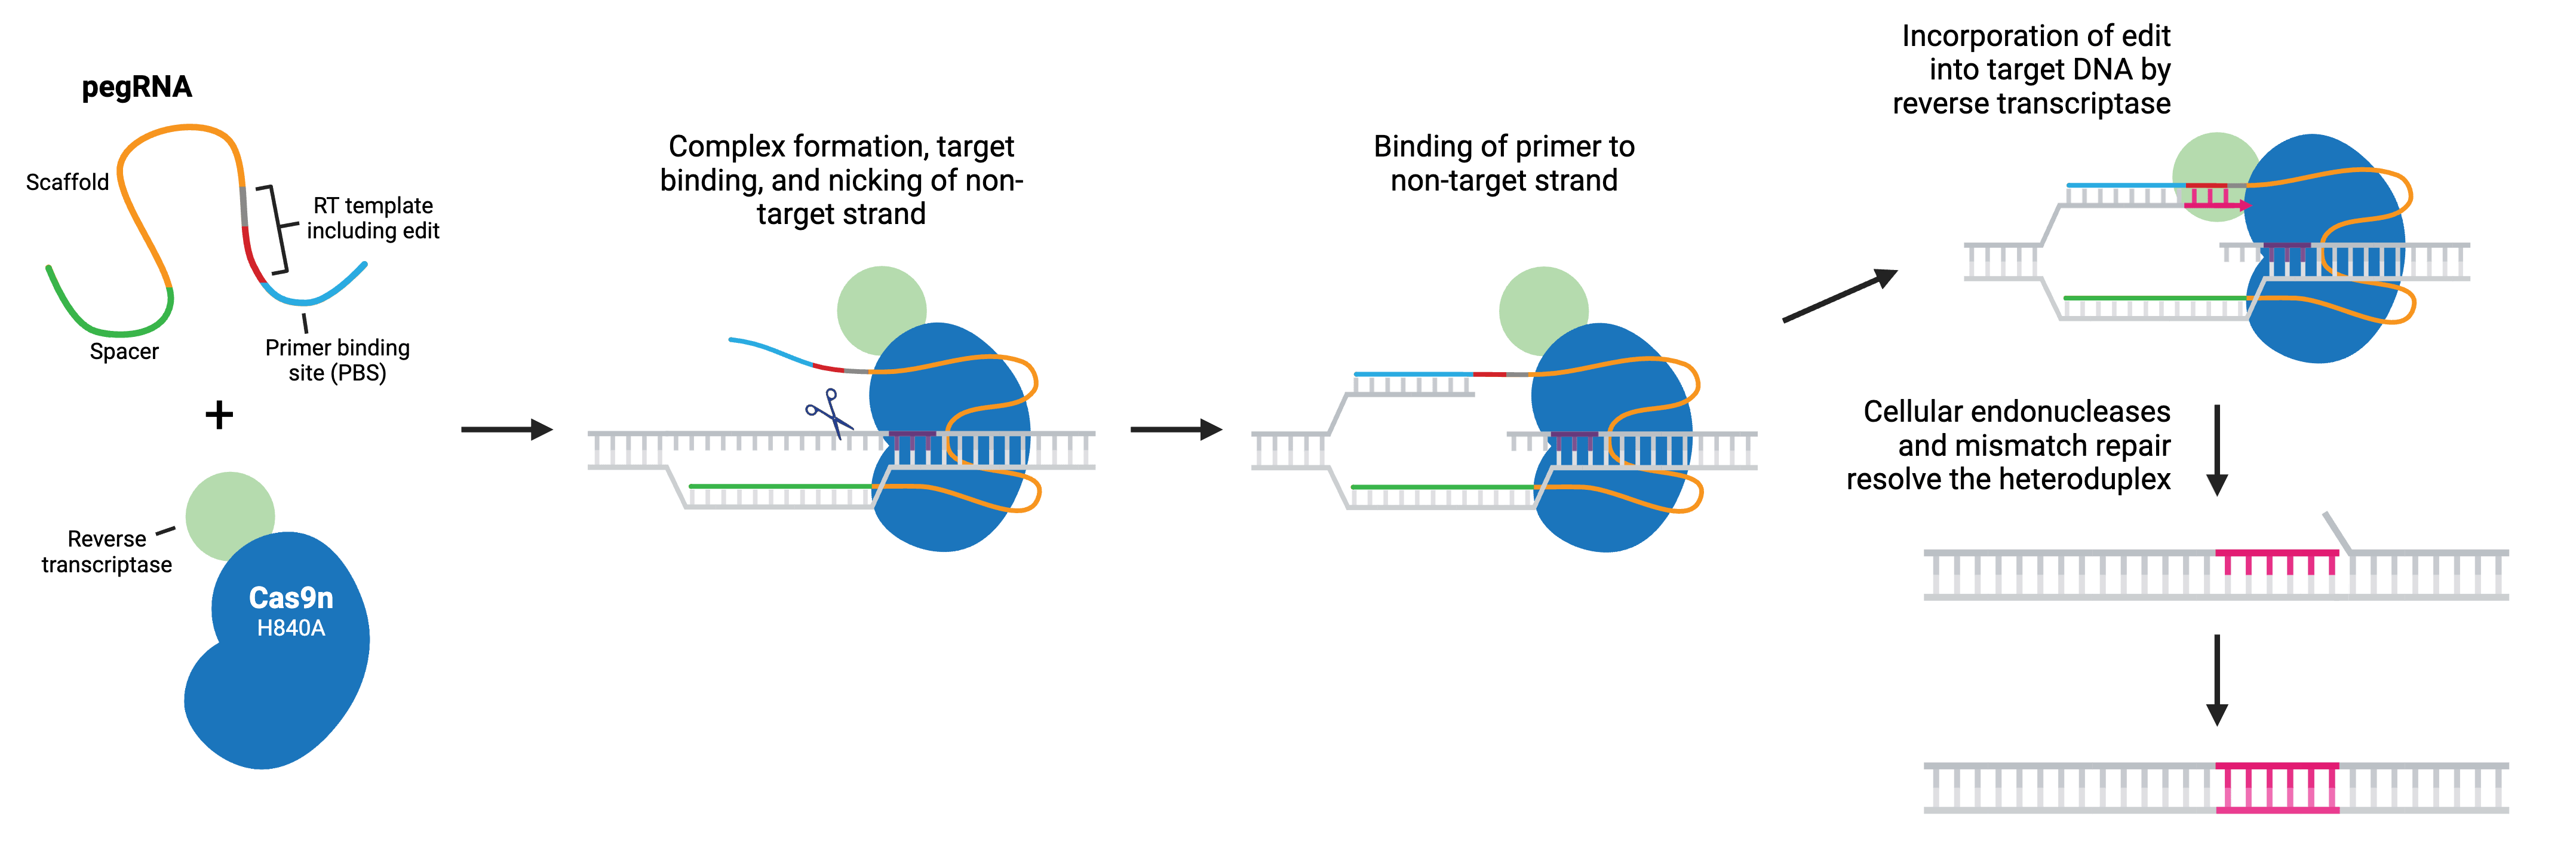
Prime editing is a versatile genome editing technology that allows precise modifications of DNA (replacements, small insertions, and deletions) without introducing DNA double-strand breaks (Anzalone et al., 2019; Chen & Liu, 2023). This method uses a prime editor (typically ...
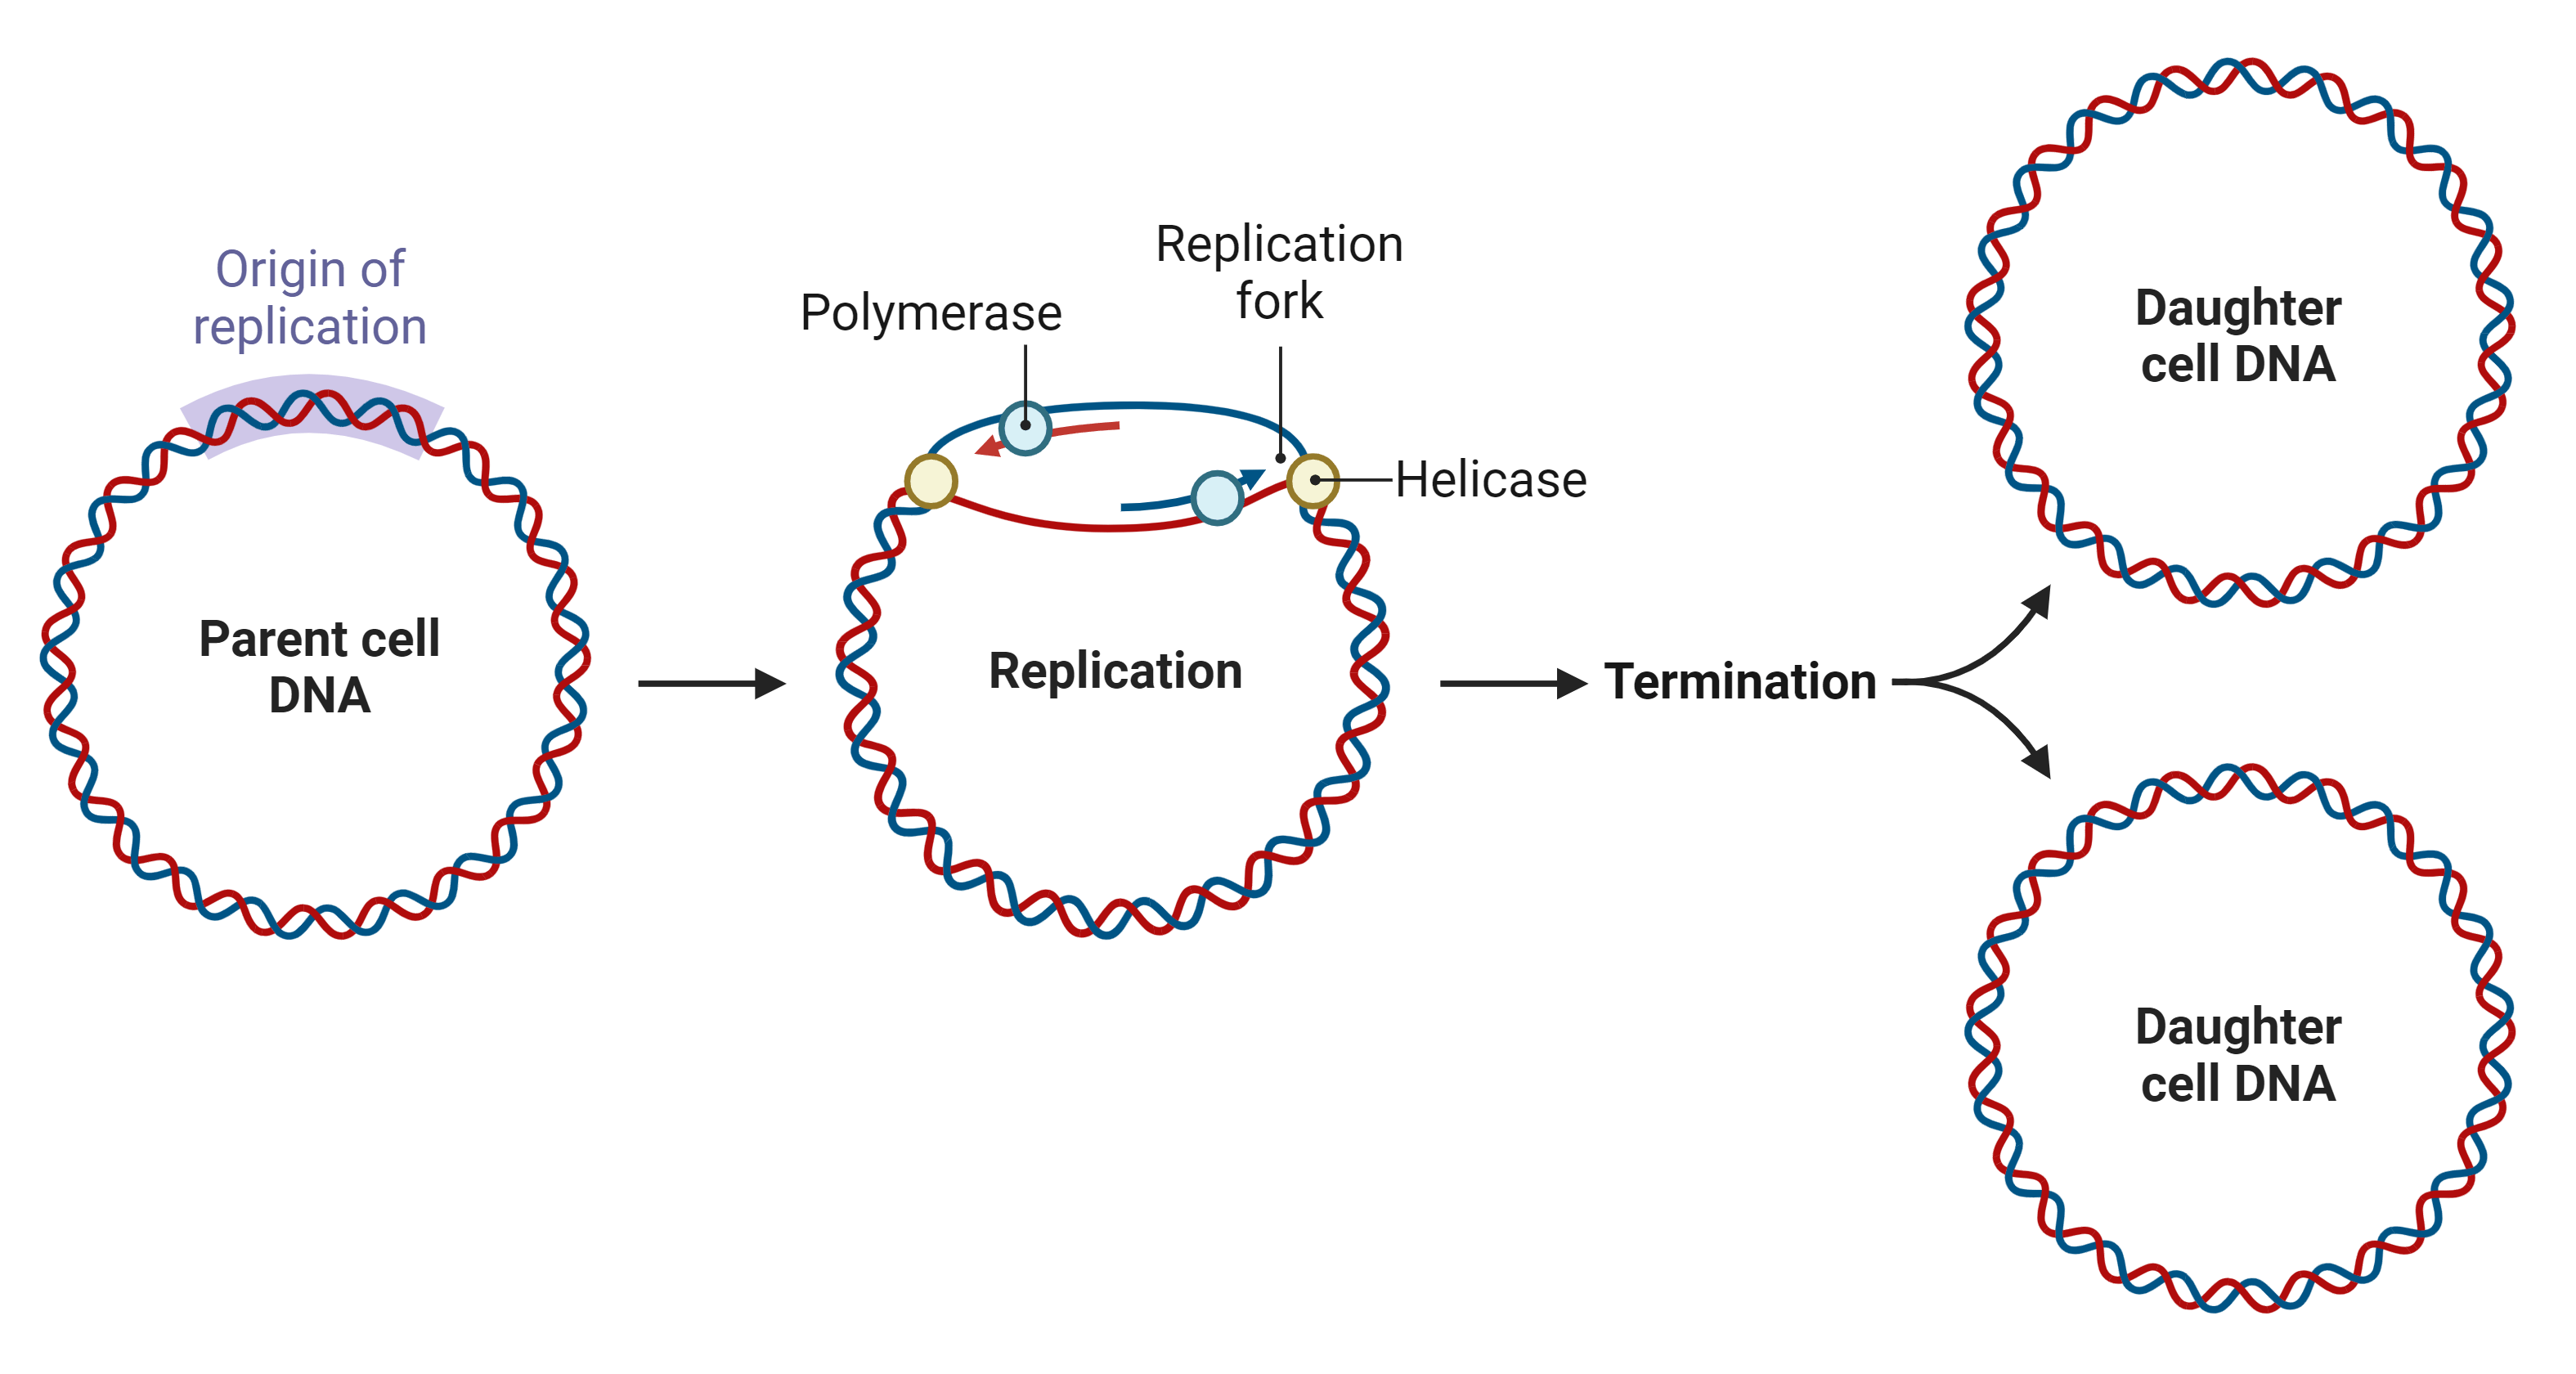
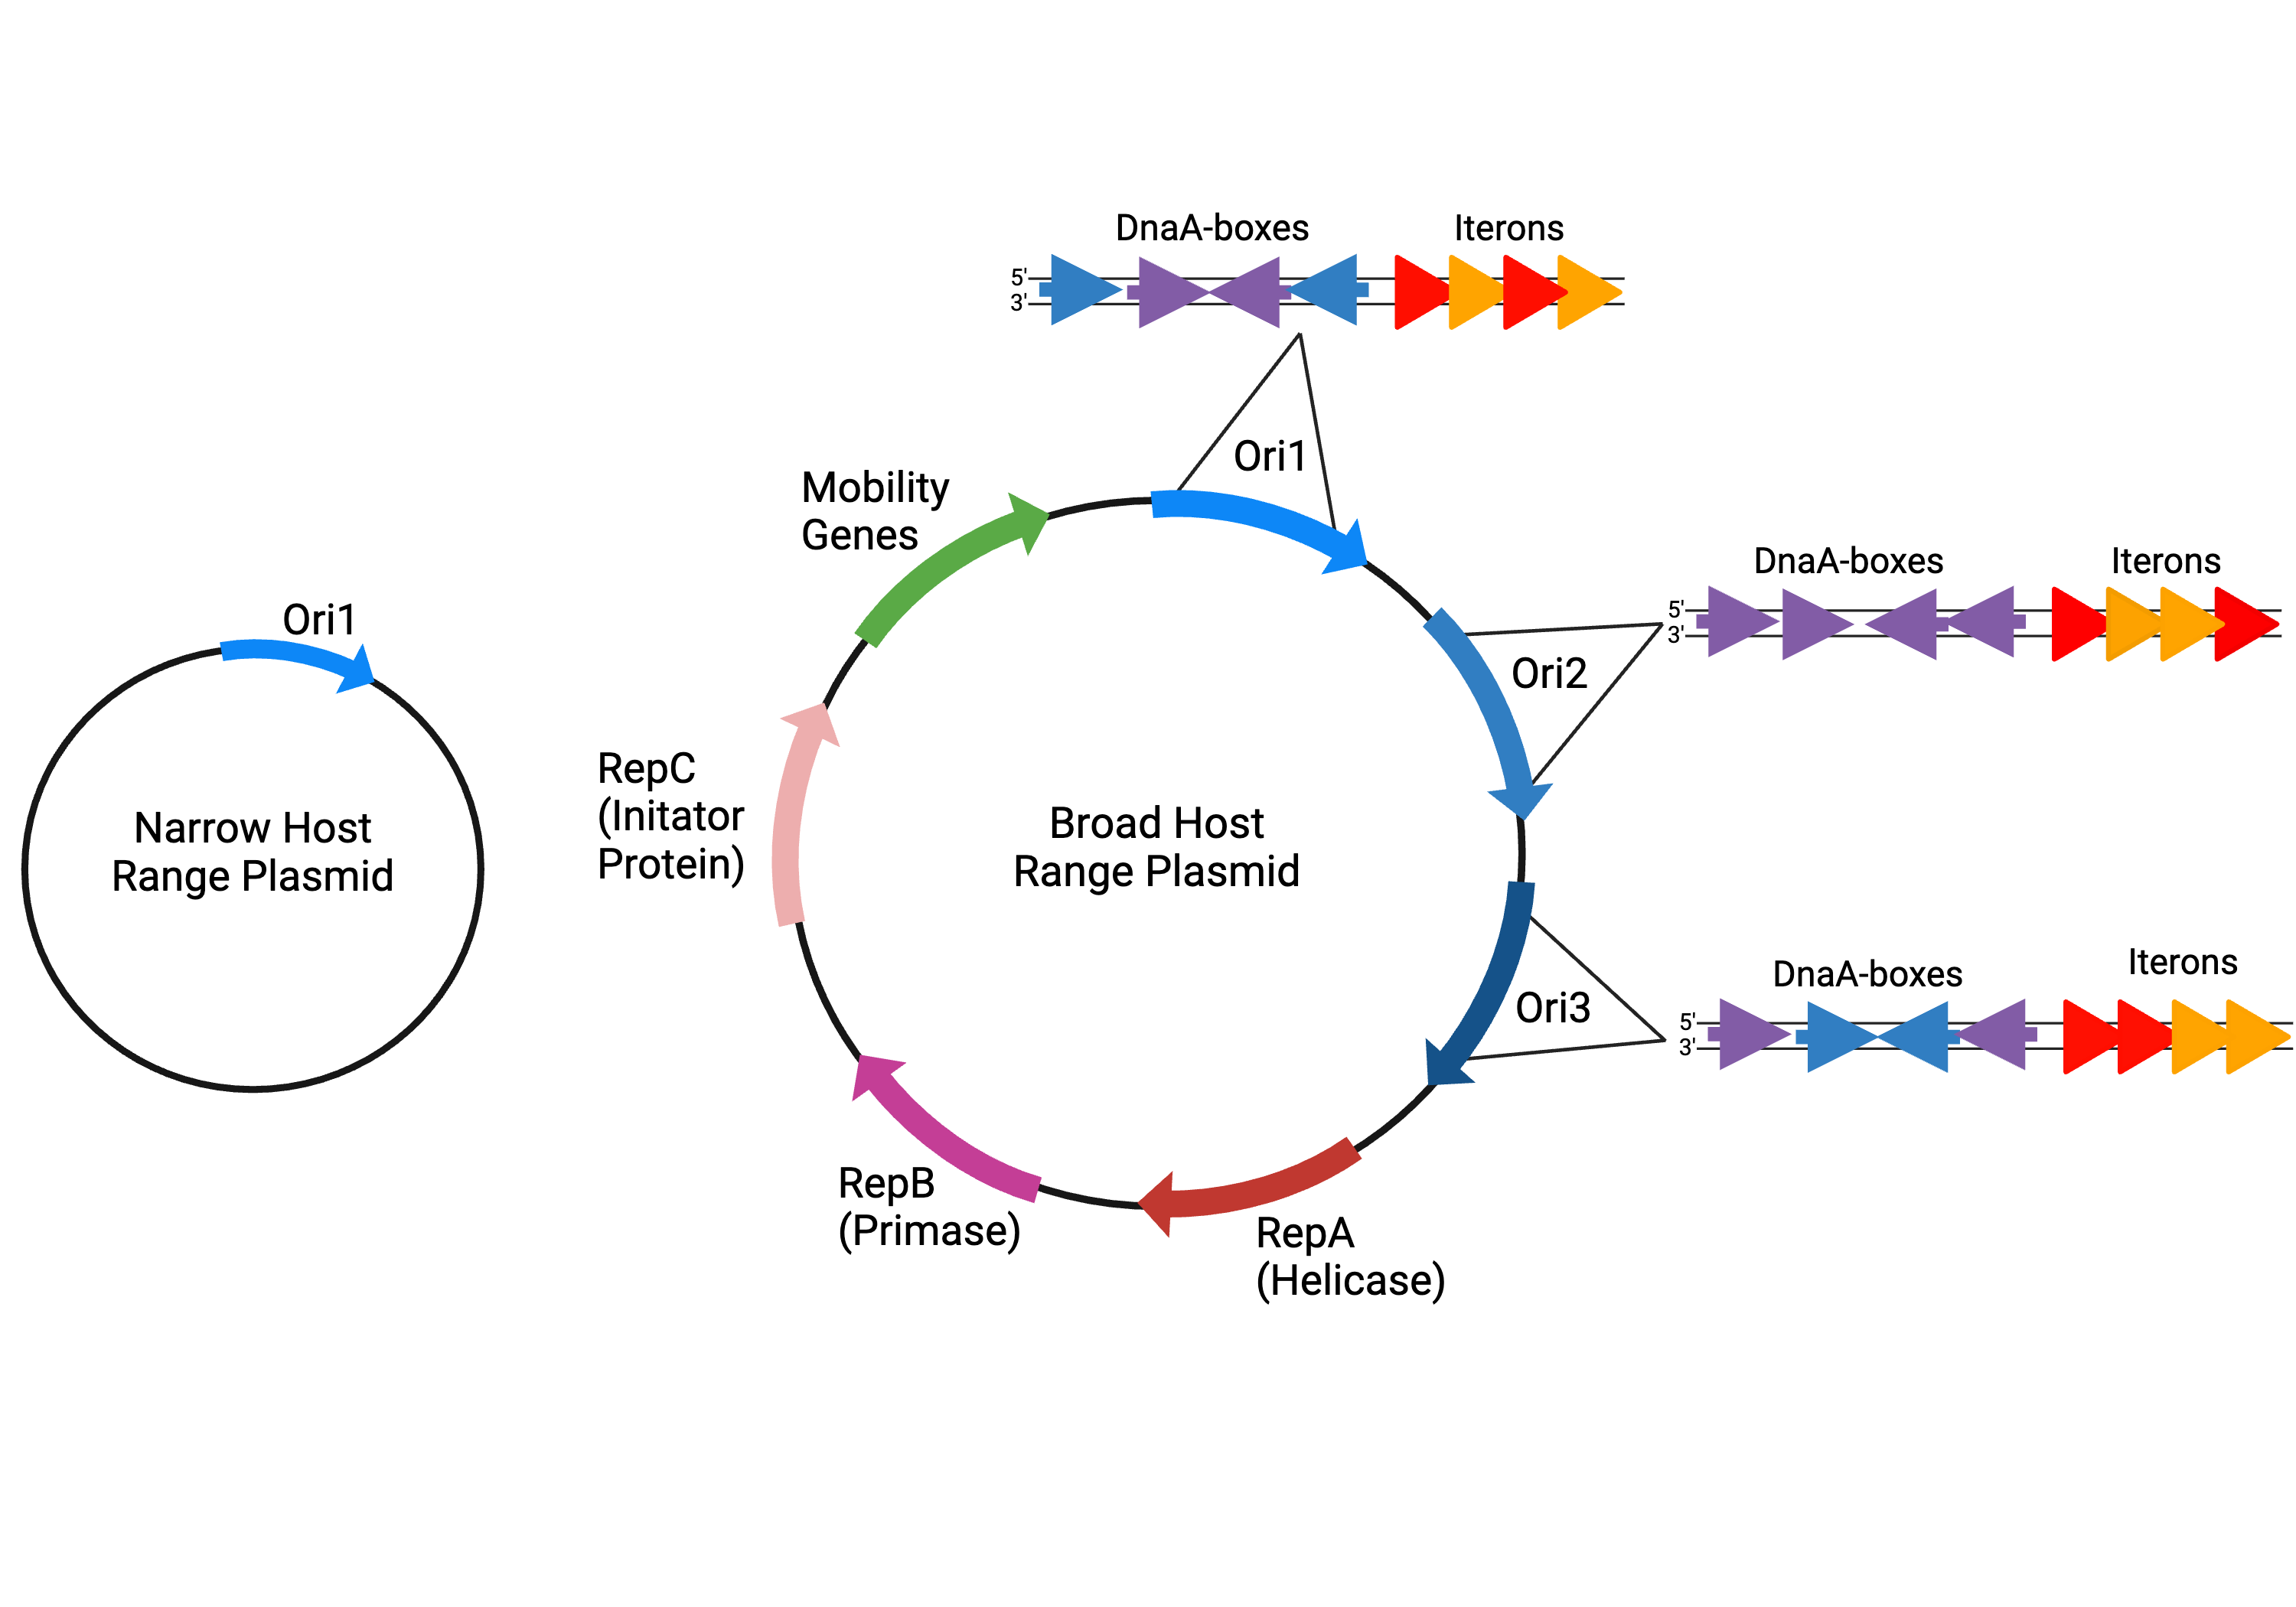
All plasmids rely on their host cell's replication machinery in order to replicate—but not always to the same extent. As described in our previous Origin of Replication post, DNA replication is initiated at the ori and may or may not be synchronized with the replication of the ...
This year marks Addgene's 20th anniversary! We've been celebrating throughout the year, and on Sunday, June 9th, we hosted our 20th anniversary party for all Addgenies to celebrate together. We were even able to have many of our remote workers travel to Addgene's headquarters in ...
When you are running flow cytometry, you’ll need various controls to help you set up and analyze your samples. While you are probably familiar with the basics of controls in experimental design, you’ll need a few controls specific to flow as an application. These controls will ...
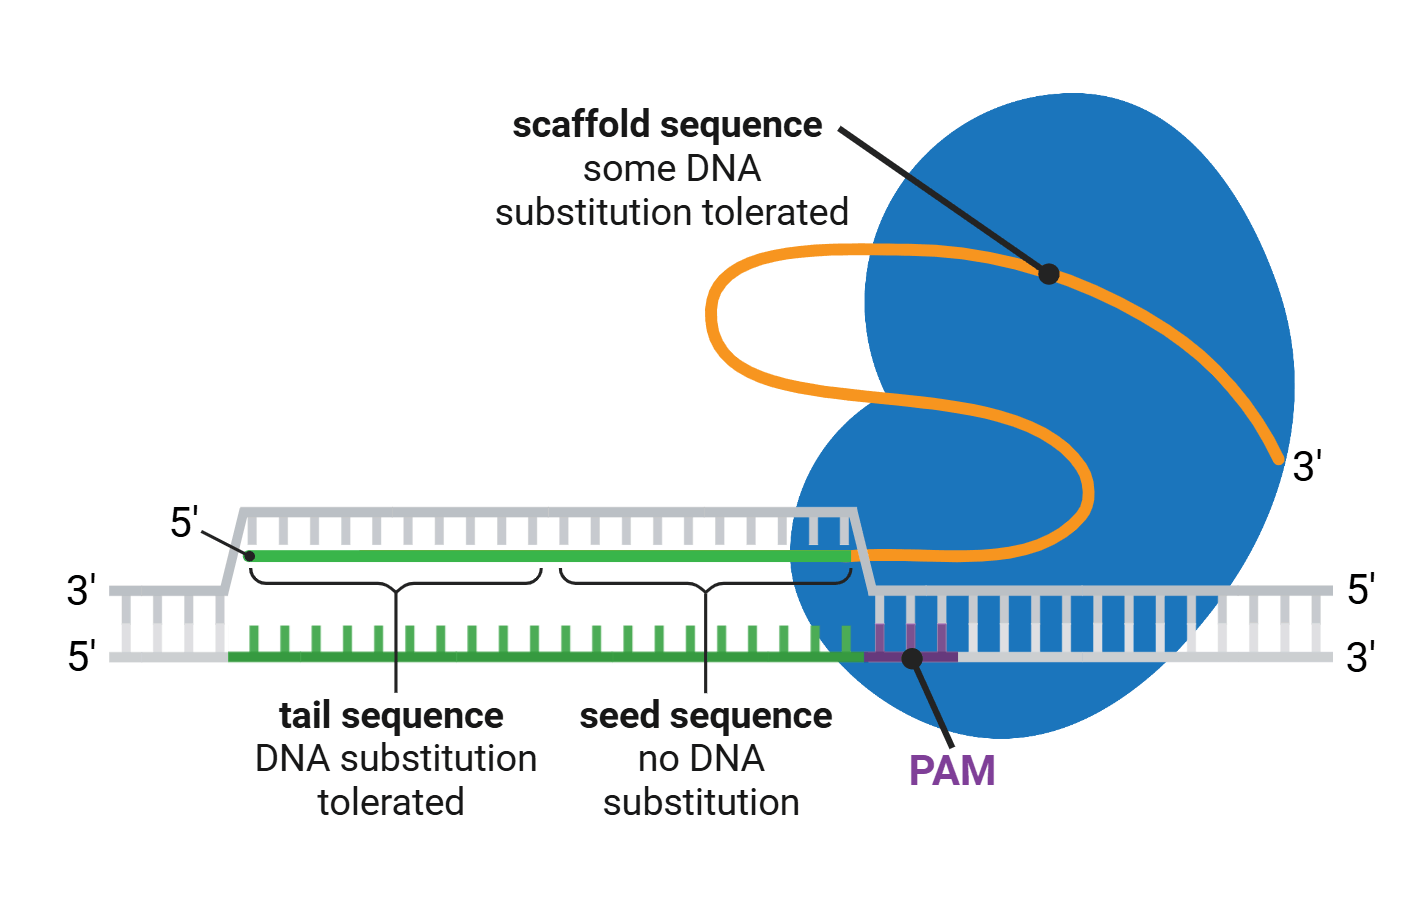
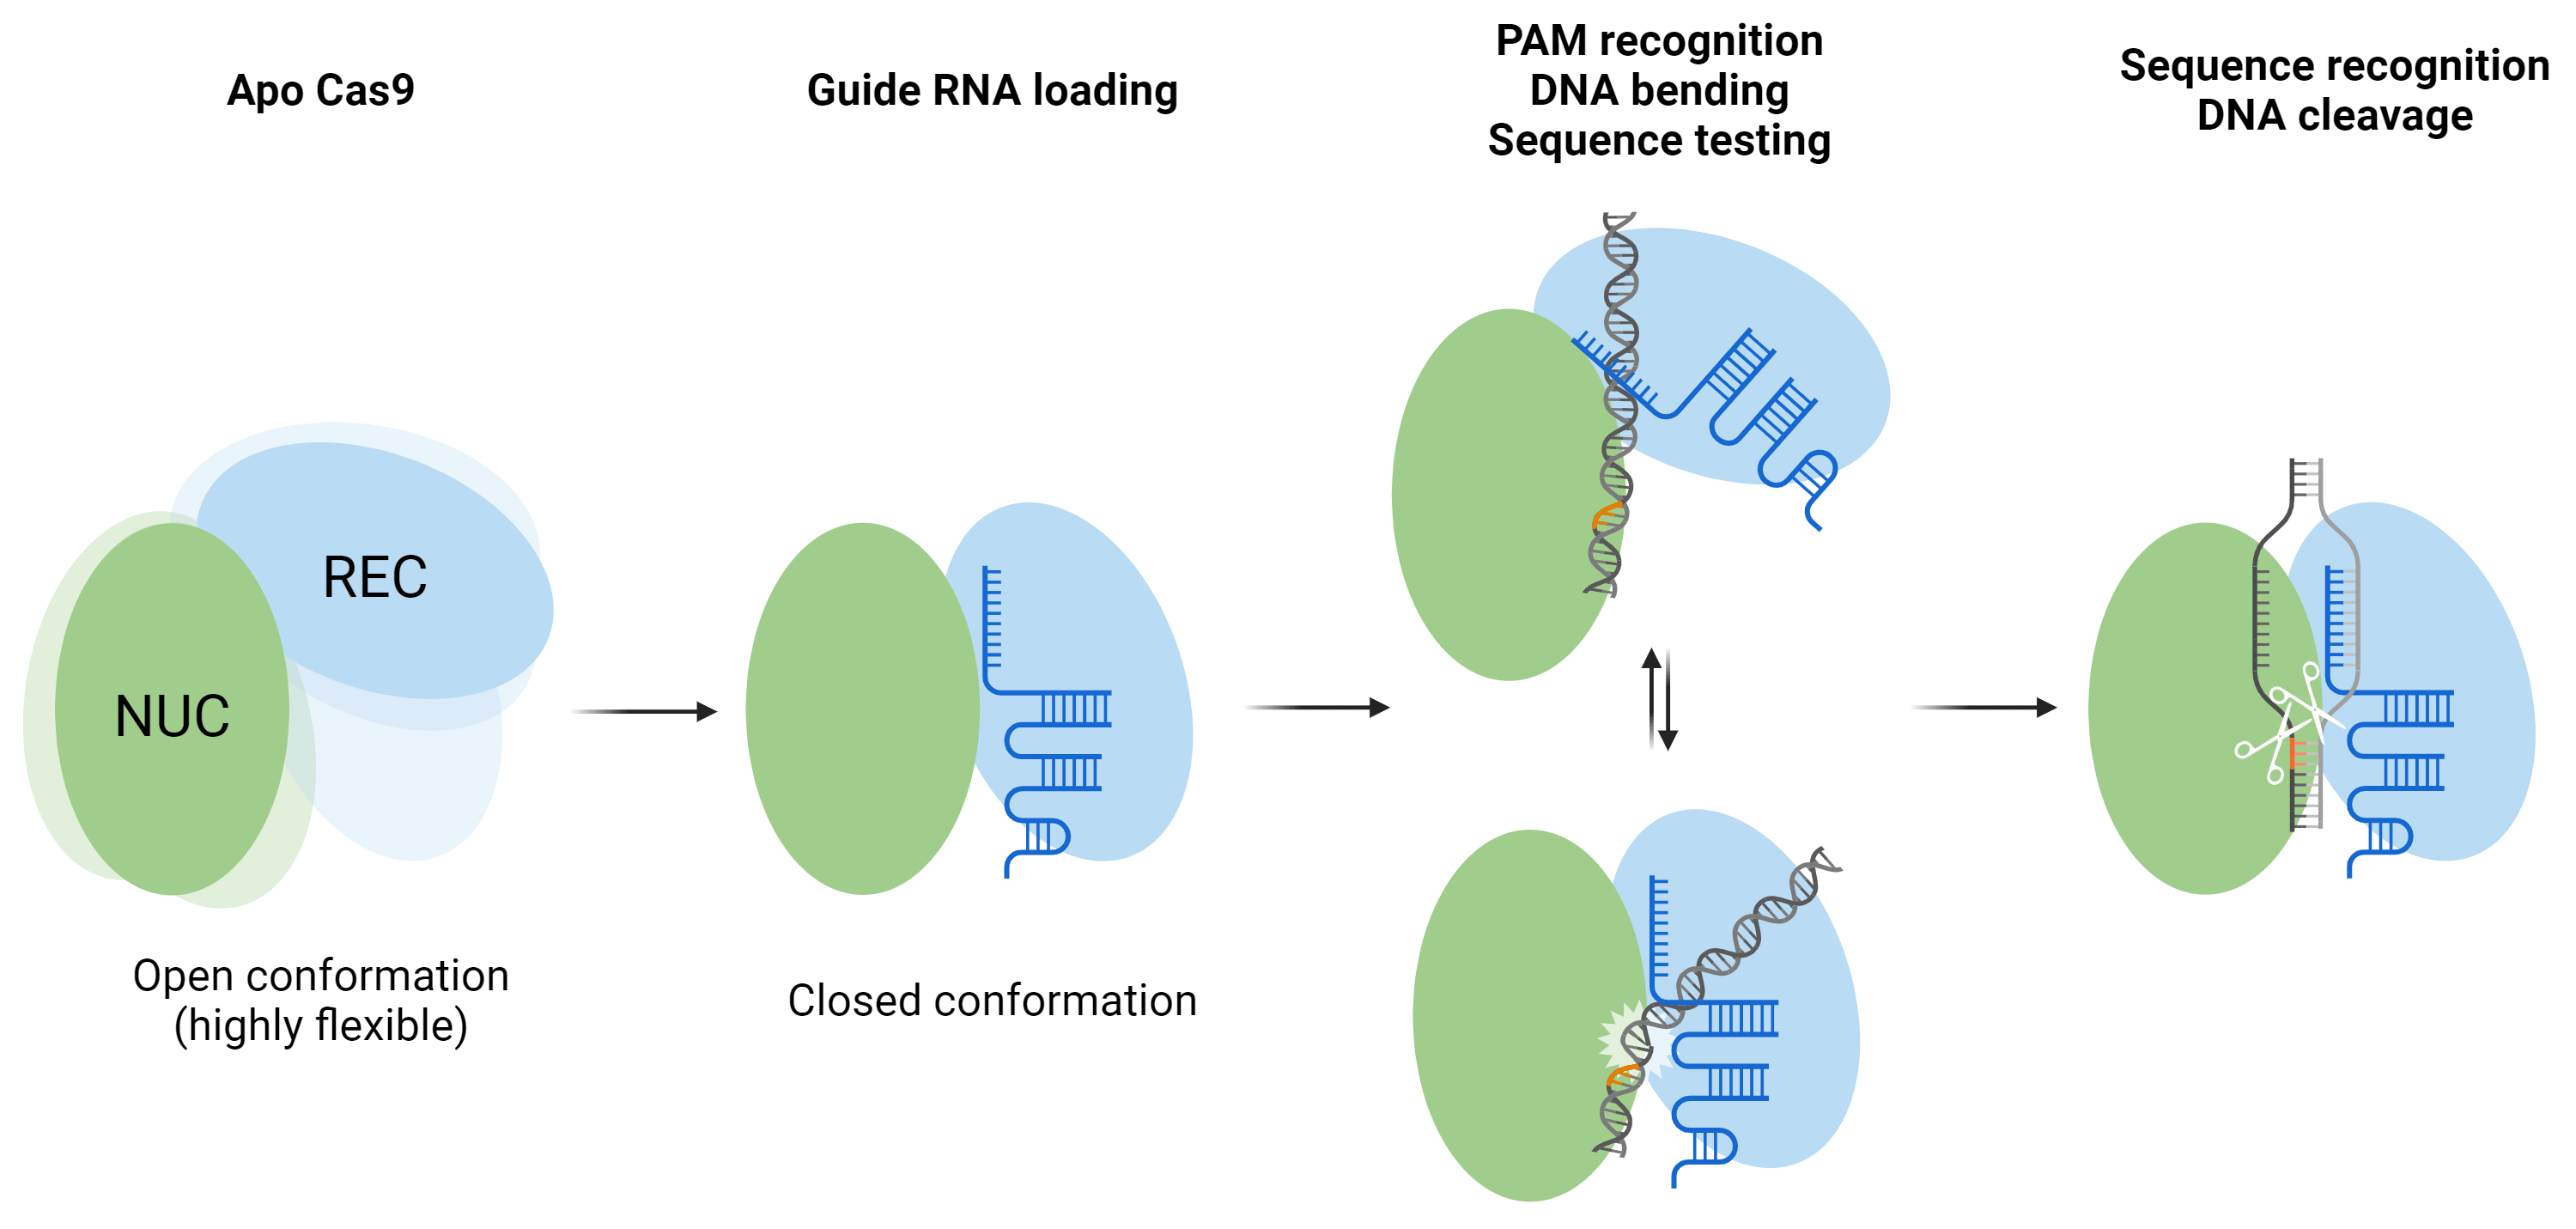
Have you ever designed a CRISPR guide RNA and wondered why it is limited to only 20 bases, or why it’s so important to choose a target sequence with a nearby protospacer-adjacent motif (PAM)? Cas9 is becoming an ever more ubiquitous tool for genome engineering, and studying its ...
If you’re depositing a pooled library with Addgene, you may be surprised to learn that we ask for an amplification protocol with your deposit. This is because repeated amplifications of pooled libraries can lead to issues such as recombination and loss of plasmid diversity, so ...
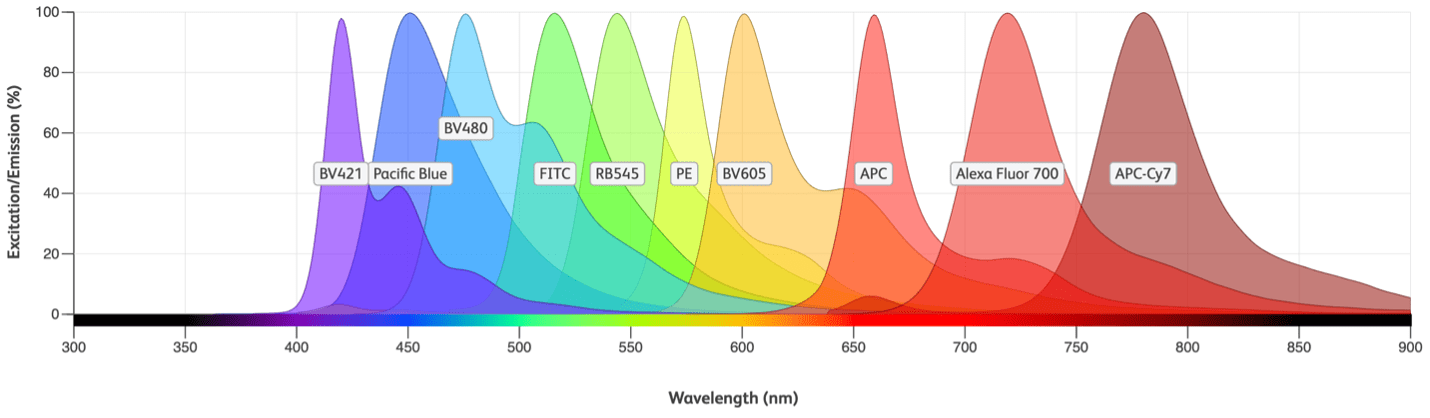
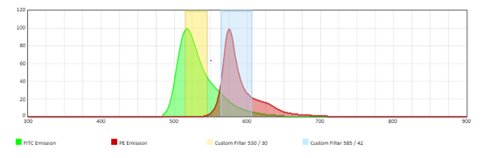
When analyzing your cells using flow cytometry, you are typically measuring the presence or absence of certain markers on the surface or the inside of your cells. While proteins themselves can emit intrinsic fluorescence when excited with ultraviolet (UV) light, they do so via ...
If you are job searching, you may be wondering if you need to go to the effort of writing a cover letter. After all, they’re less common than they were ten years ago, and it does take a bit of time to craft one. We still think they're useful, so we've updated our cover letter ...
In flow cytometry, compensation is the process of correcting spillover from one fluorescent channel to another. When you label your samples with multiple antibodies, the fluorescent probes on the antibodies may have similar emission spectra, meaning they will emit fluorescent ...
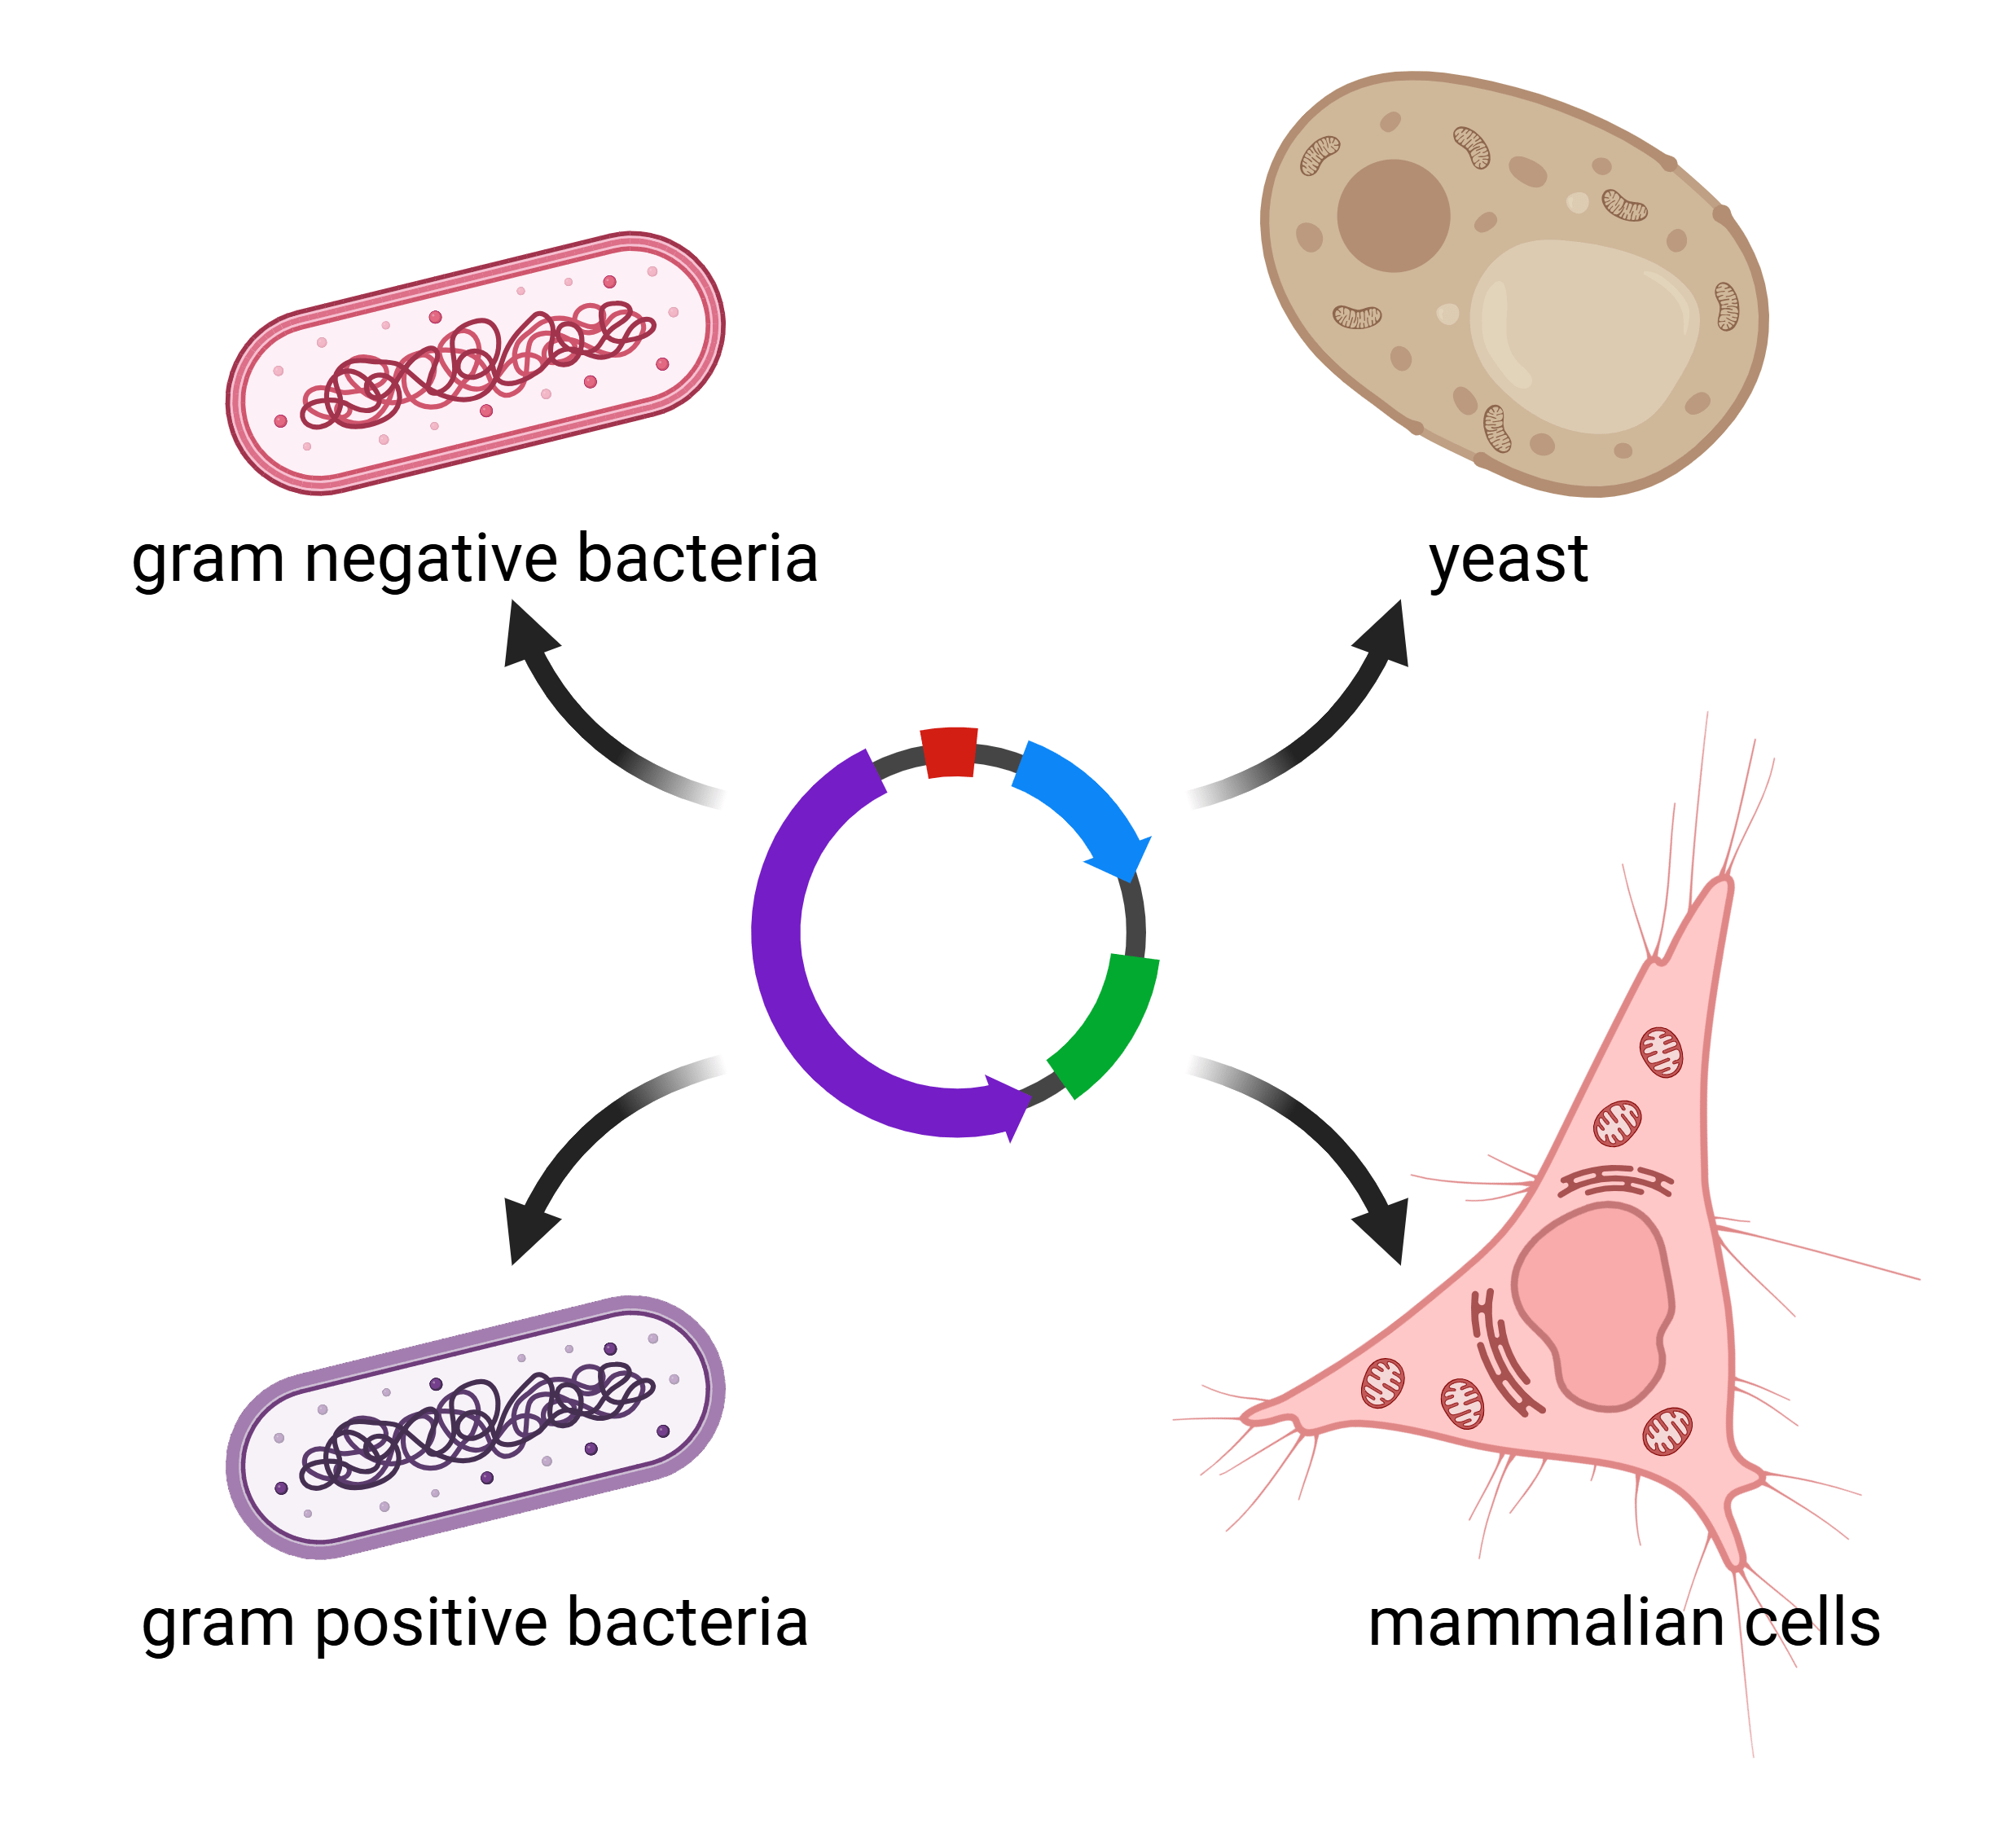
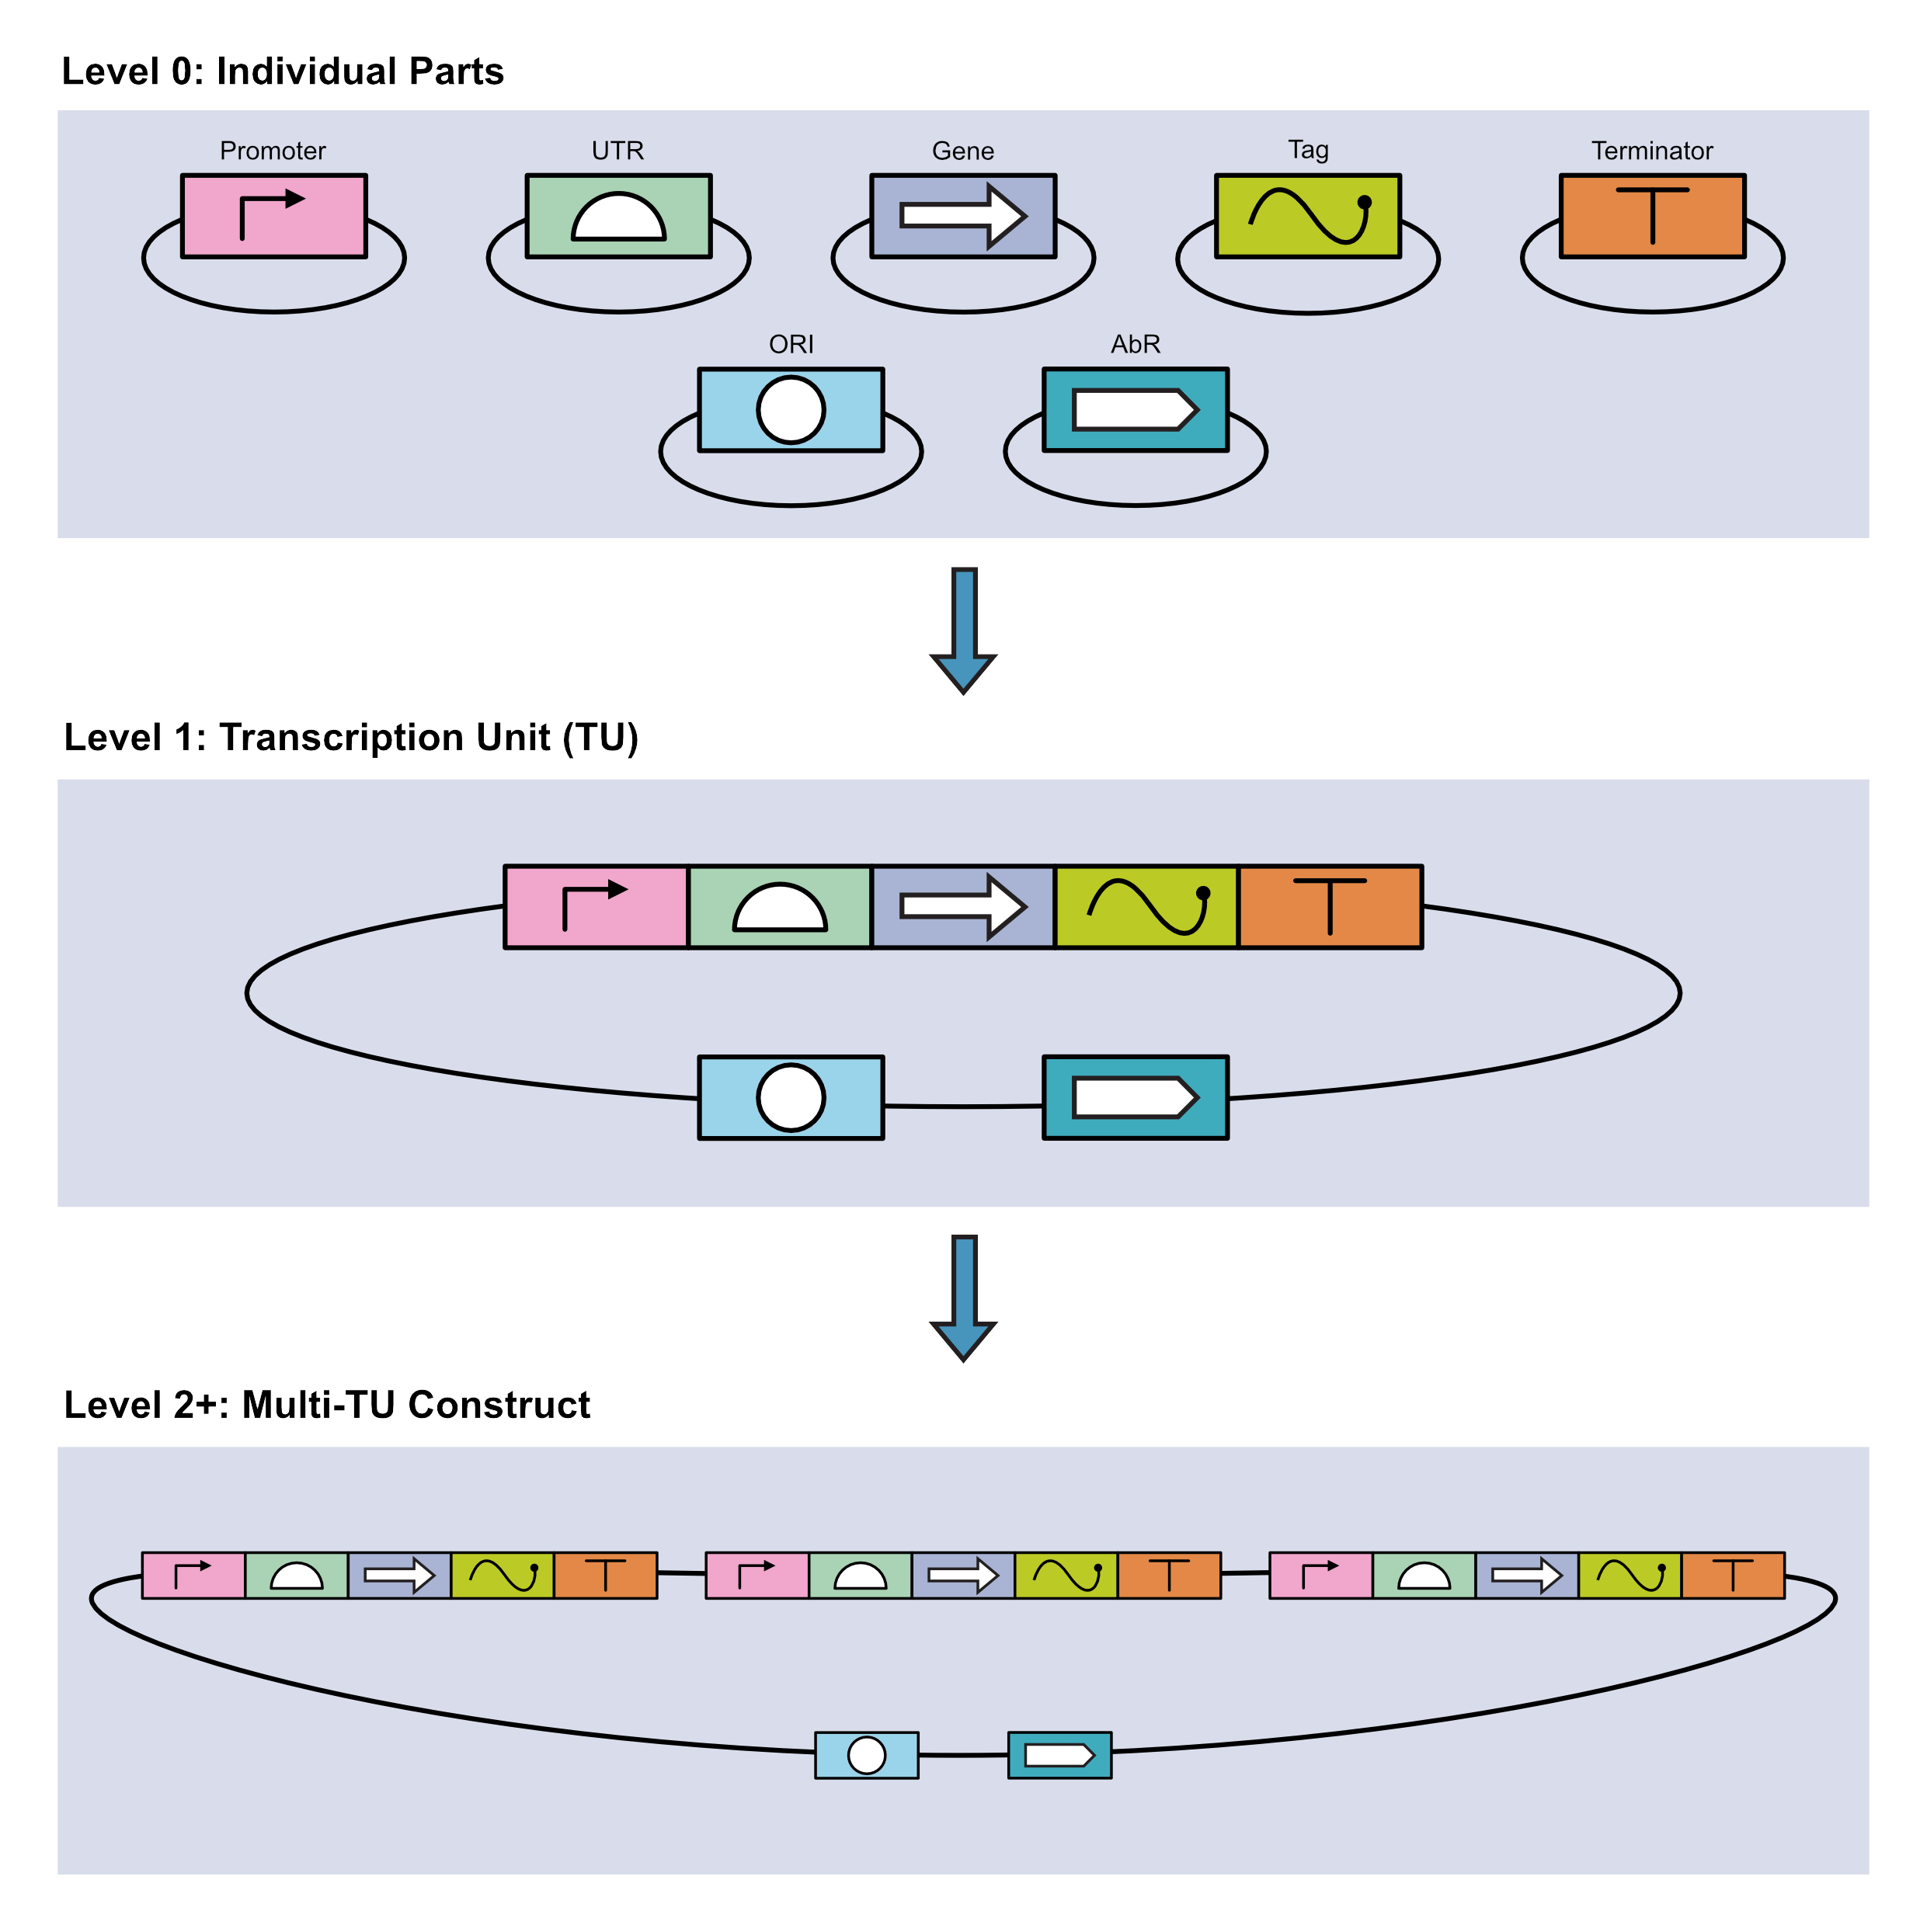
Modular cloning is a popular DNA assembly tool used to build single- and multi-gene constructs for a variety of applications. MoClo tools can be used in bacterial and cell-free expression systems, mammalian cells, yeast, flies, and even plants! In this blog we will review common ...
The UN General Assembly has declared 2024 the International Year of Camelids. The declaration is intended to raise awareness of the economic and cultural importance of these animals to human populations around the world. Here at Addgene, we love camelids too, though not just for ...
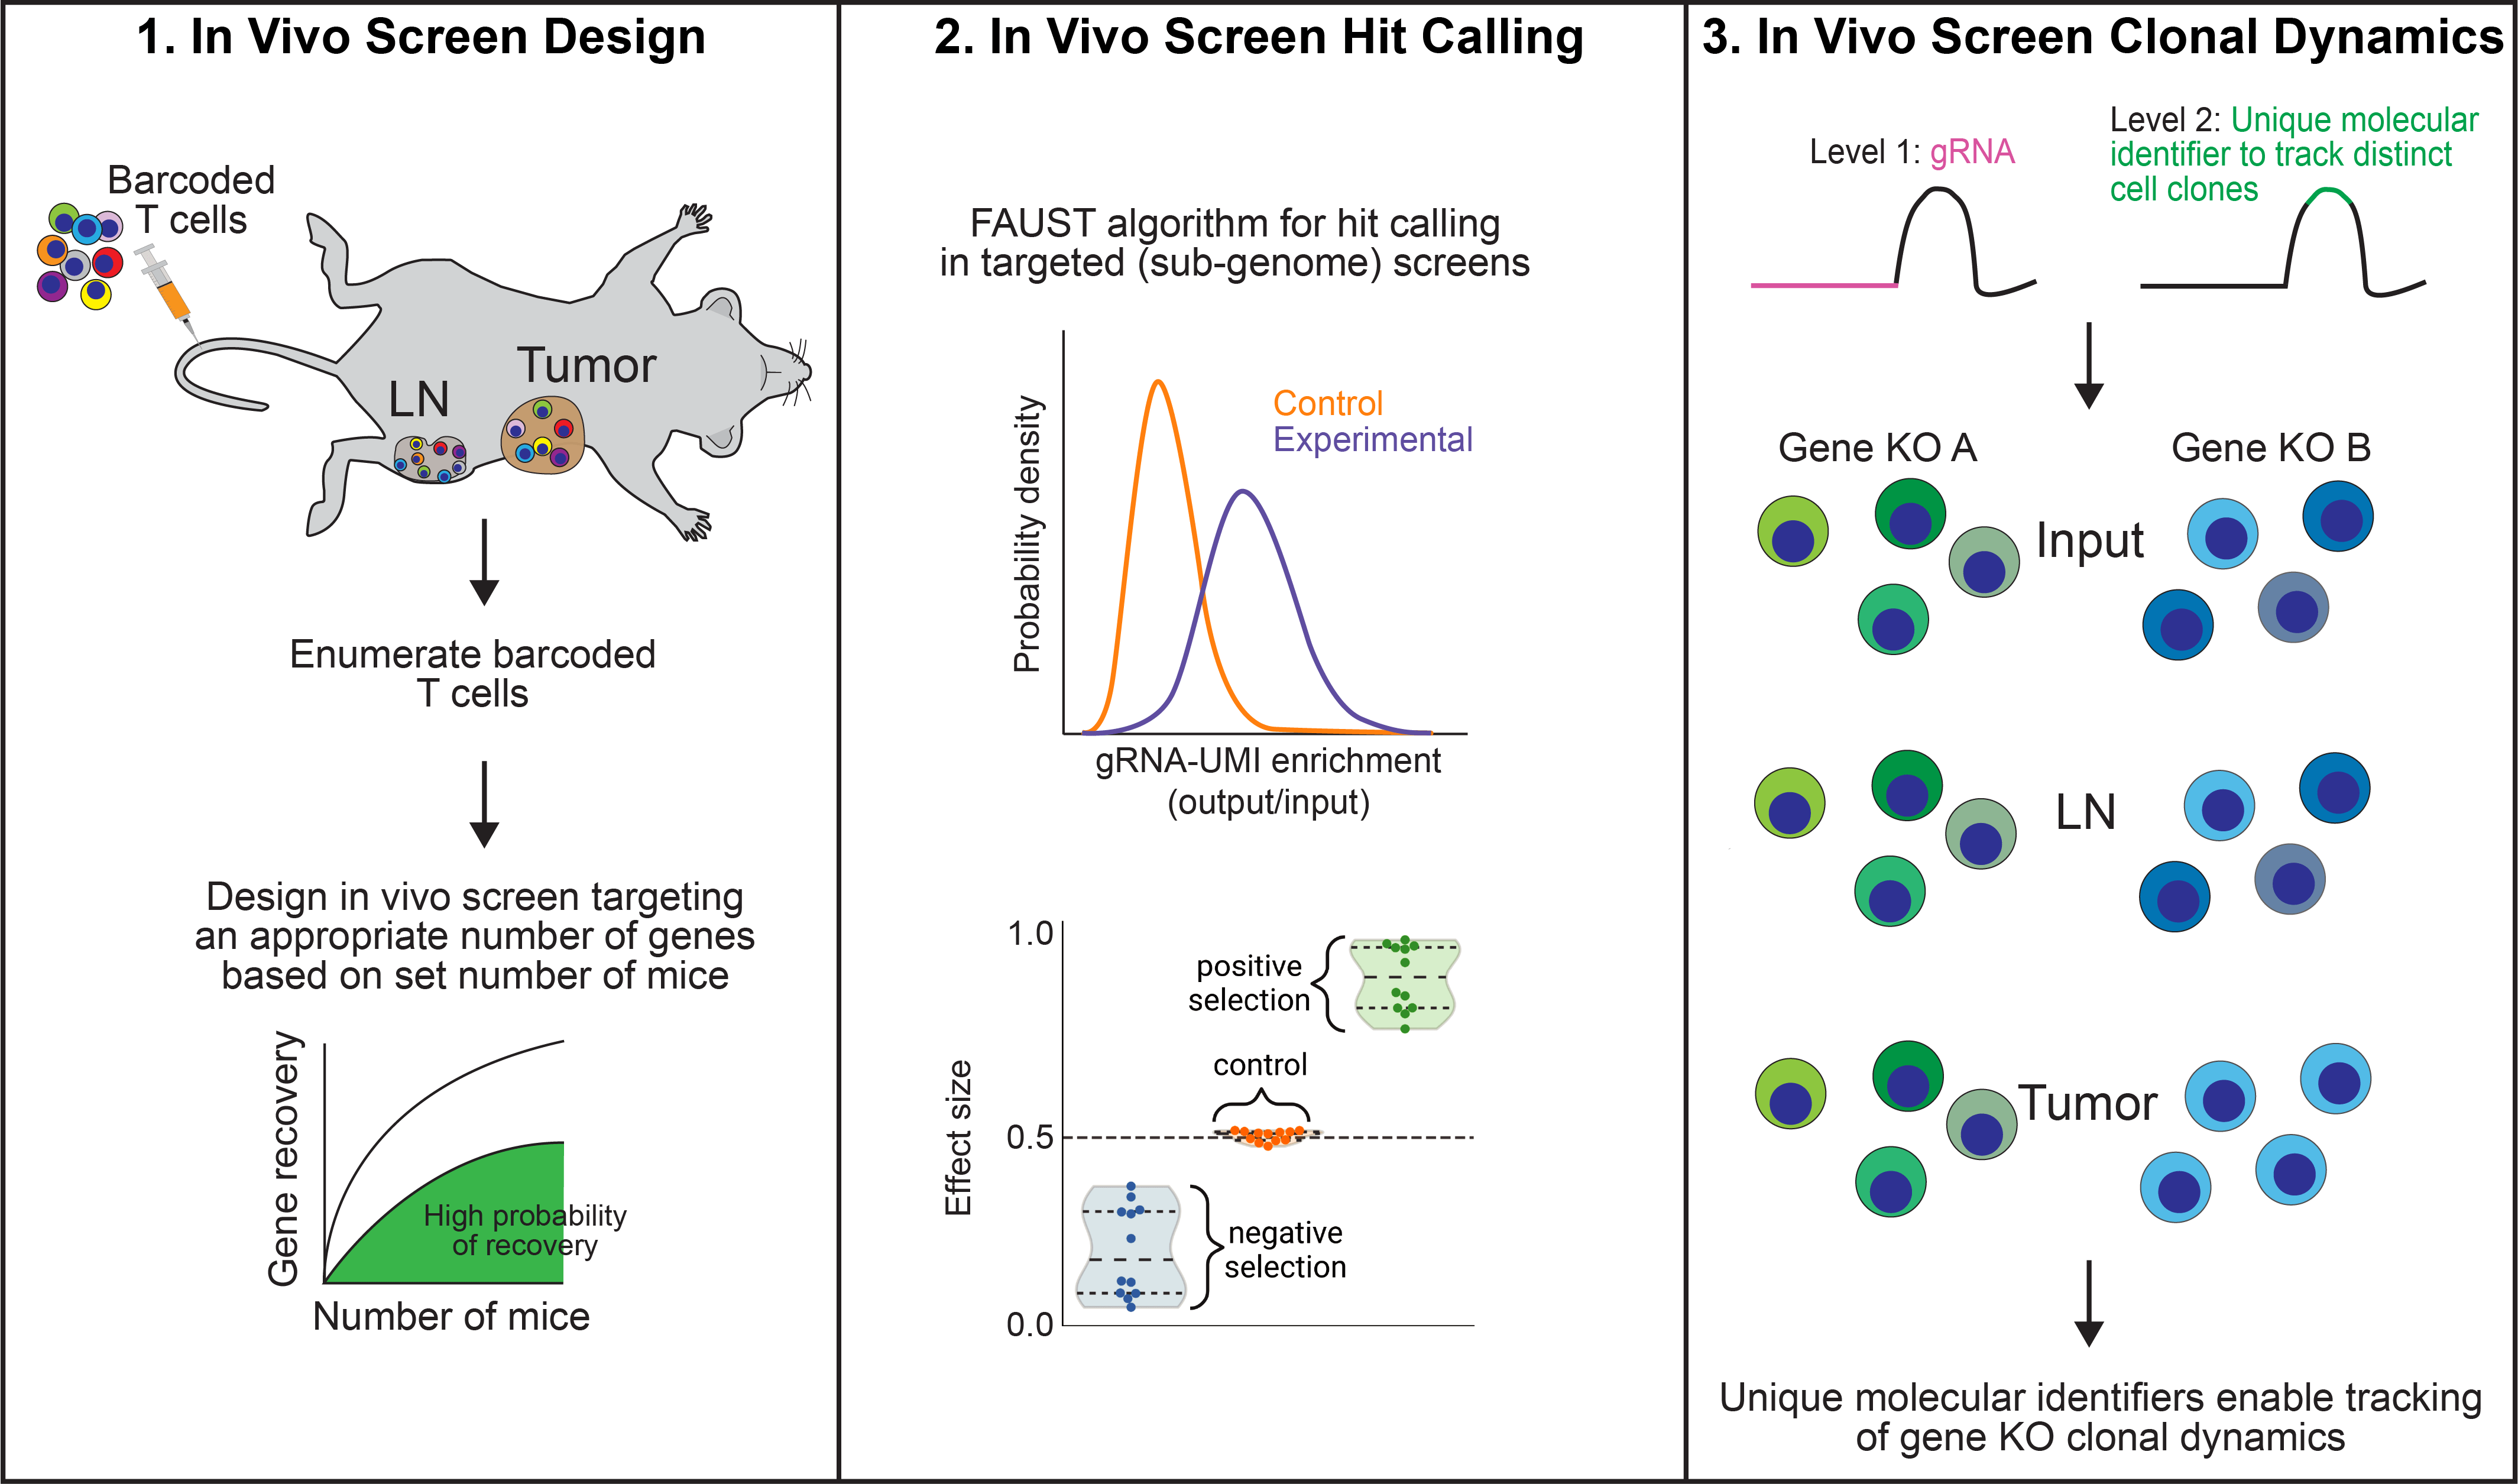
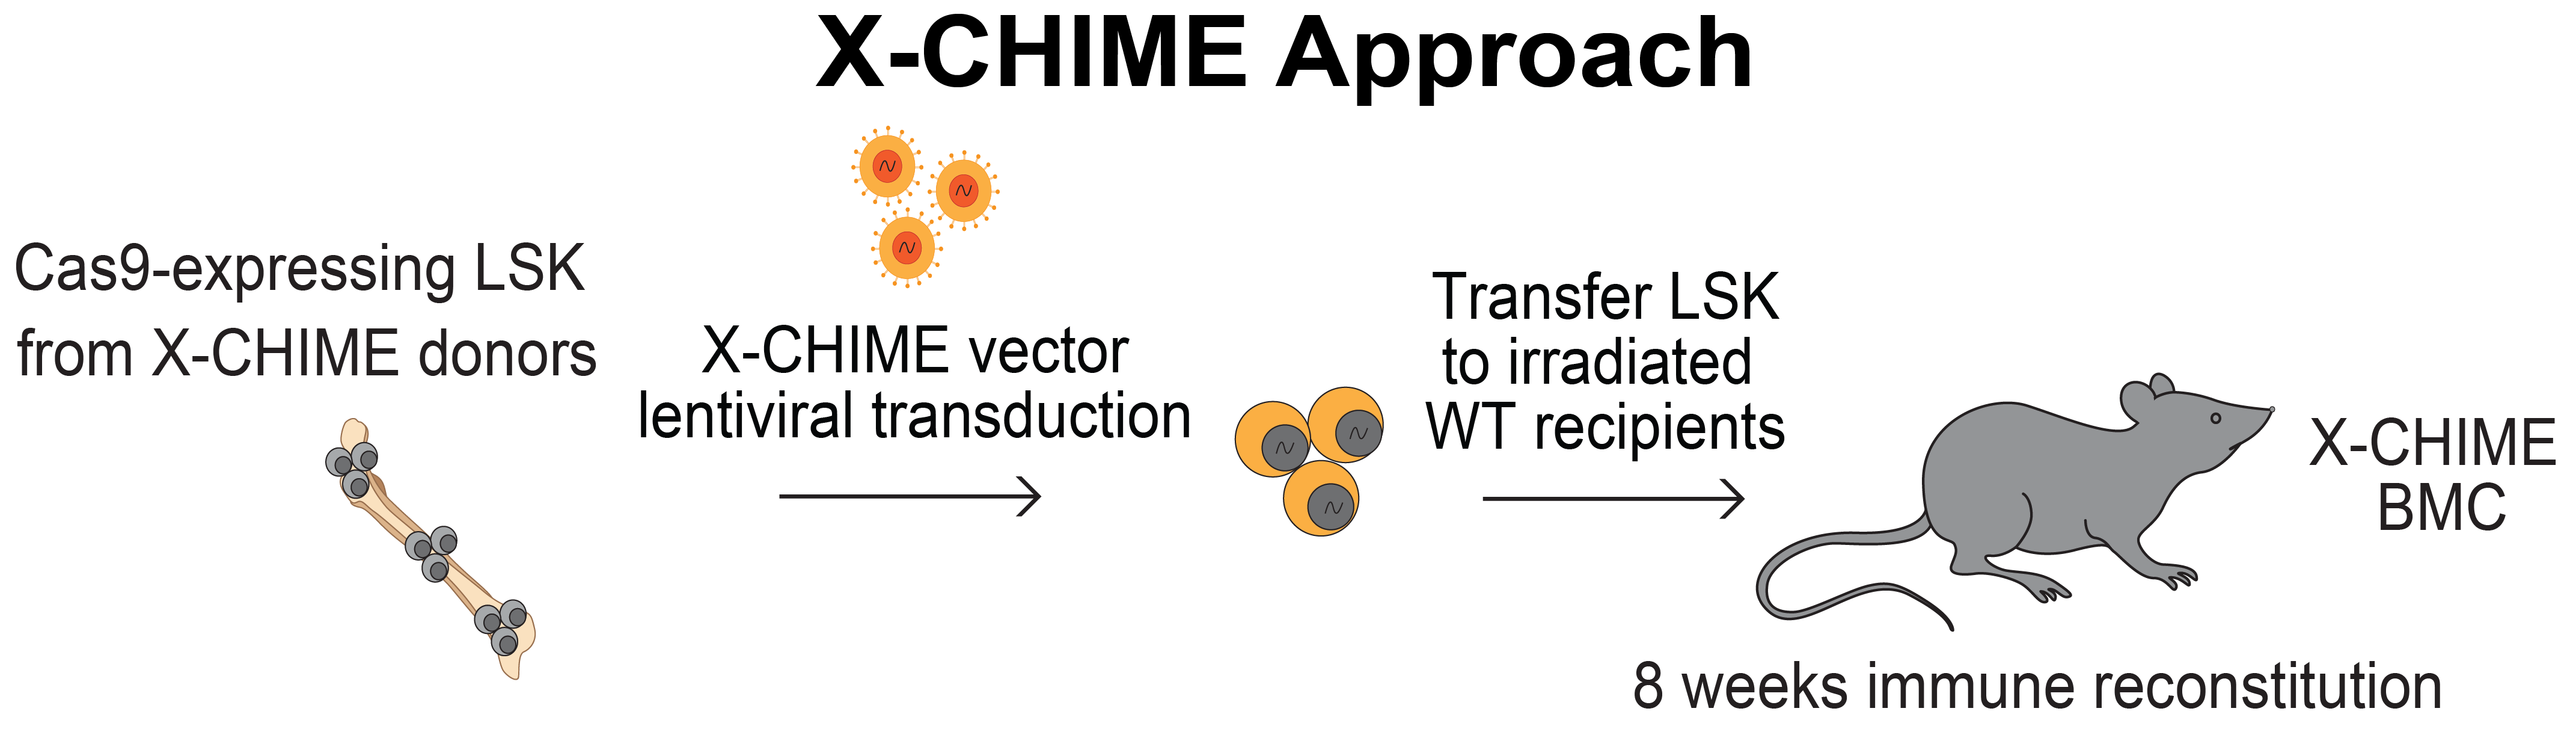
FITS In vitro CRISPR screens in immune cells have identified many putative regulators of immunity. However, in vitro screens cannot faithfully model the complex spatial, cellular, metabolic, and cytokine microenvironment that exists in vivo. Over the past five years, in vivo ...
The triple T’s of biology are transformations, transfections, and transductions! In this blog we will discuss all things transductions. If you’ve ever wondered how they are different from or similar to the other Ts, we have your answers. If you know the basics but are here ...
In the pursuit of knowledge and groundbreaking discoveries, the world of academia often emphasizes structured methodologies and rigorous research plans. However, amidst the organized chaos of lab research and PhD studies, there lies a hidden gem that has the potential to ...
As we celebrate twenty years at Addgene, we are sharing stories of our repository’s positive impact on science and scientists around the globe. Our first story focuses on a technology that has changed virtually all of biology…CRISPR.
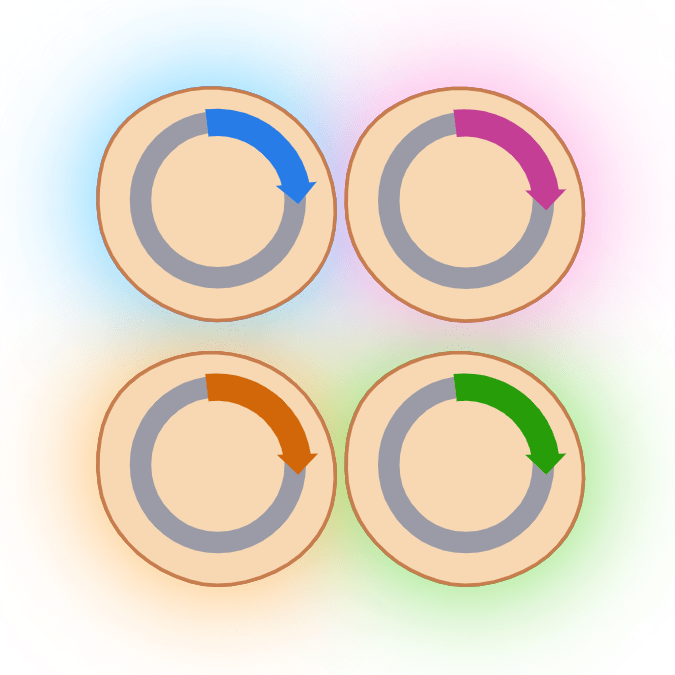
If you take a look in a typical lab freezer, you’ll probably find lots of different plasmids containing the same protein of interest tagged with different fusion proteins for different experiments over the years — a green fluorescent protein, a red fluorescent protein, a fancy ...
Understanding the characteristics of natural plasmids and how they function in nature can inform us on how to create better recombinant vectors. In this blog post, we’ll define plasmid host range, identify a few of the features that confer broad host range in plasmids in nature, ...
Starting today, you may notice some changes to our website! Part of sharing science and making access to materials easier is improving the tools you use to share and access them. Addgene’s product, development, and content teams have made some changes to the look and feel of ...
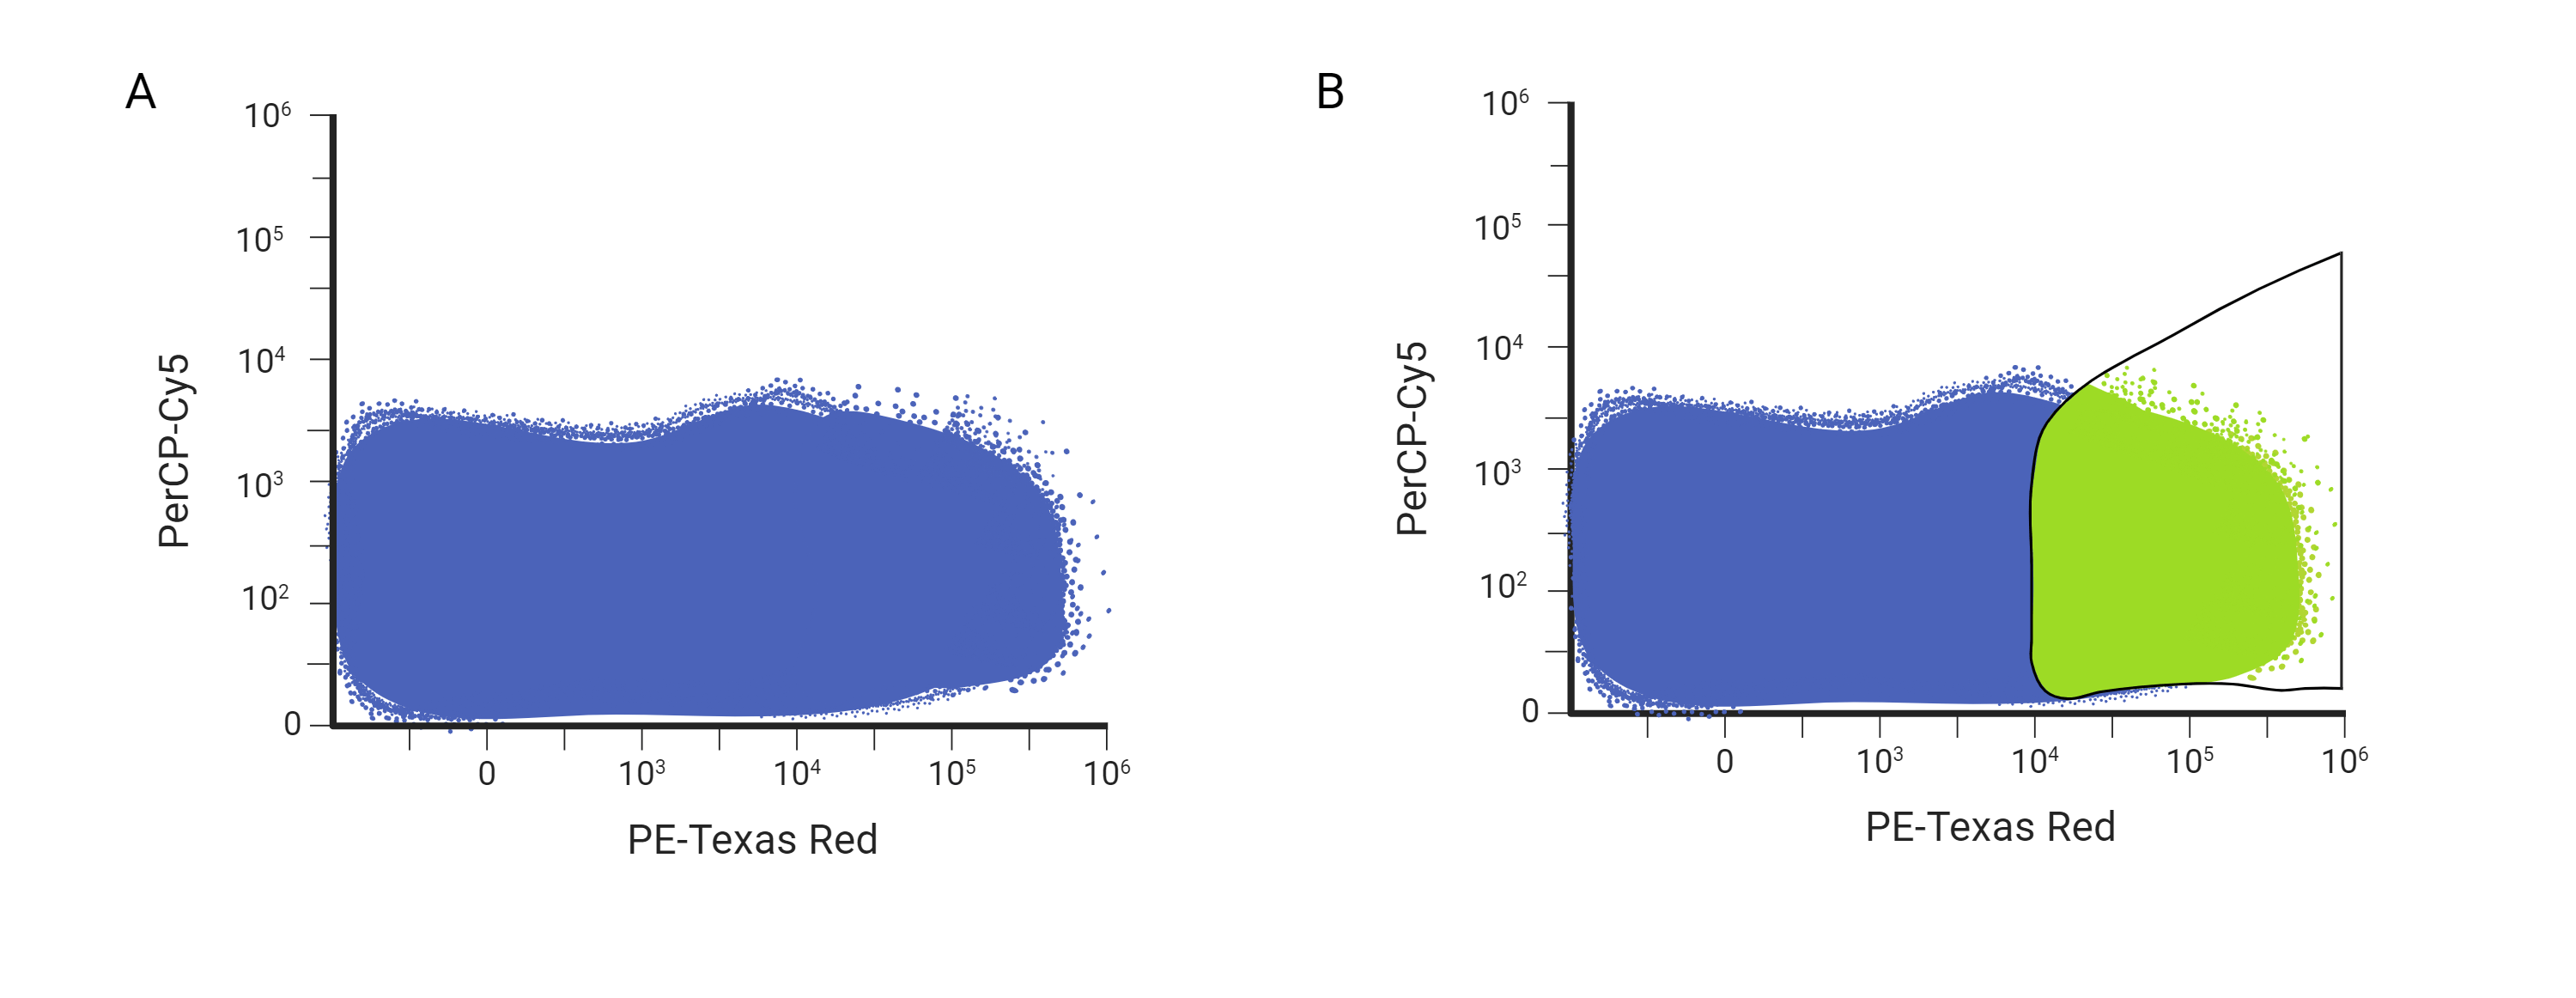
When using flow cytometry to analyze your samples, it is necessary to set up a sequence of gates to be able to select and precisely measure your cells of interest. In many experiments you’ll be working with a heterogeneous cell population, for example from a processed piece of ...
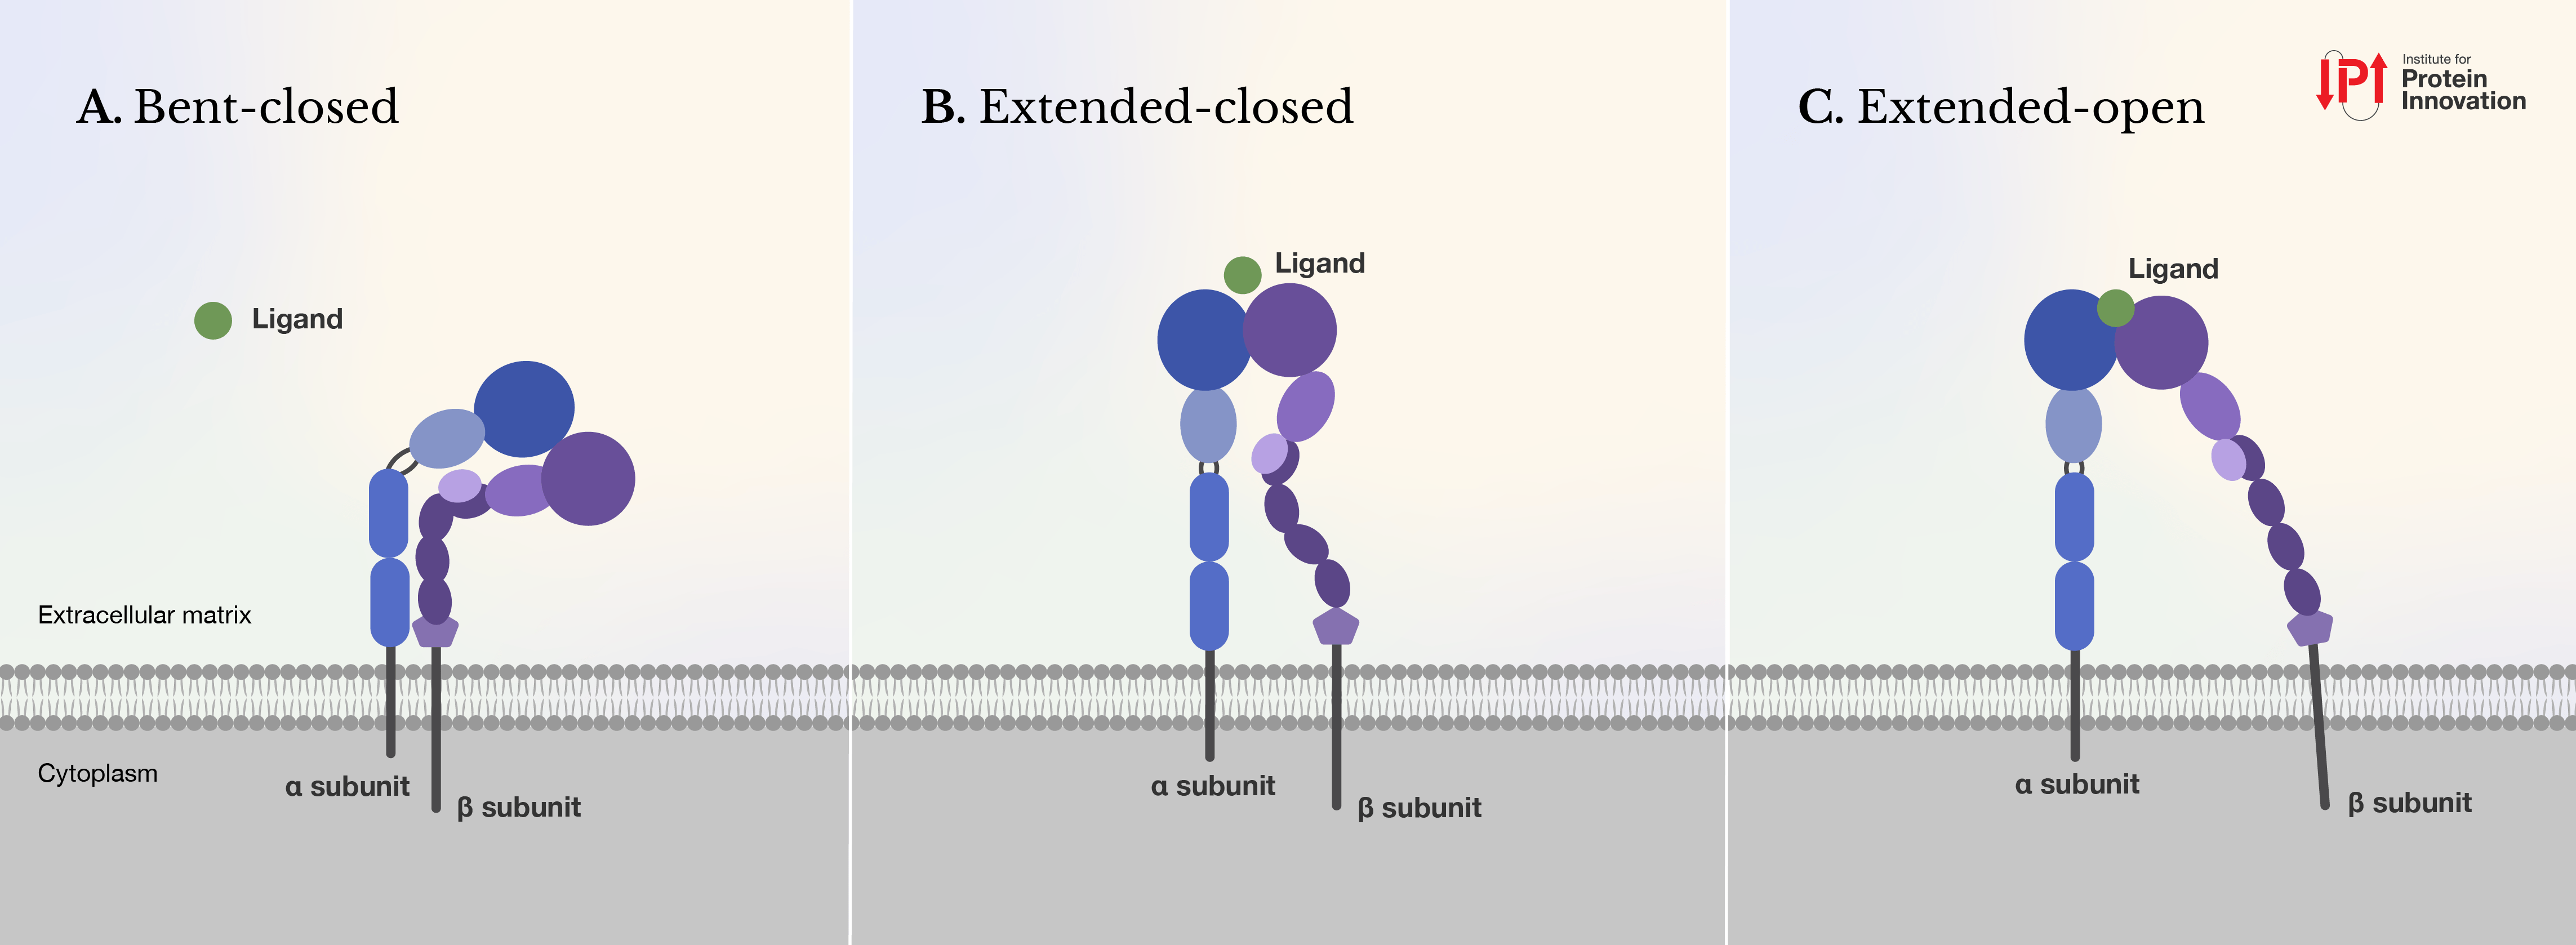
Integrins are essential cell surface receptors involved in complex signaling pathways and the linkage of intra- and extracellular environments. Found on nearly every cell in the human body, integrins are key to a diverse array of processes, including cell adhesion, migration, ...
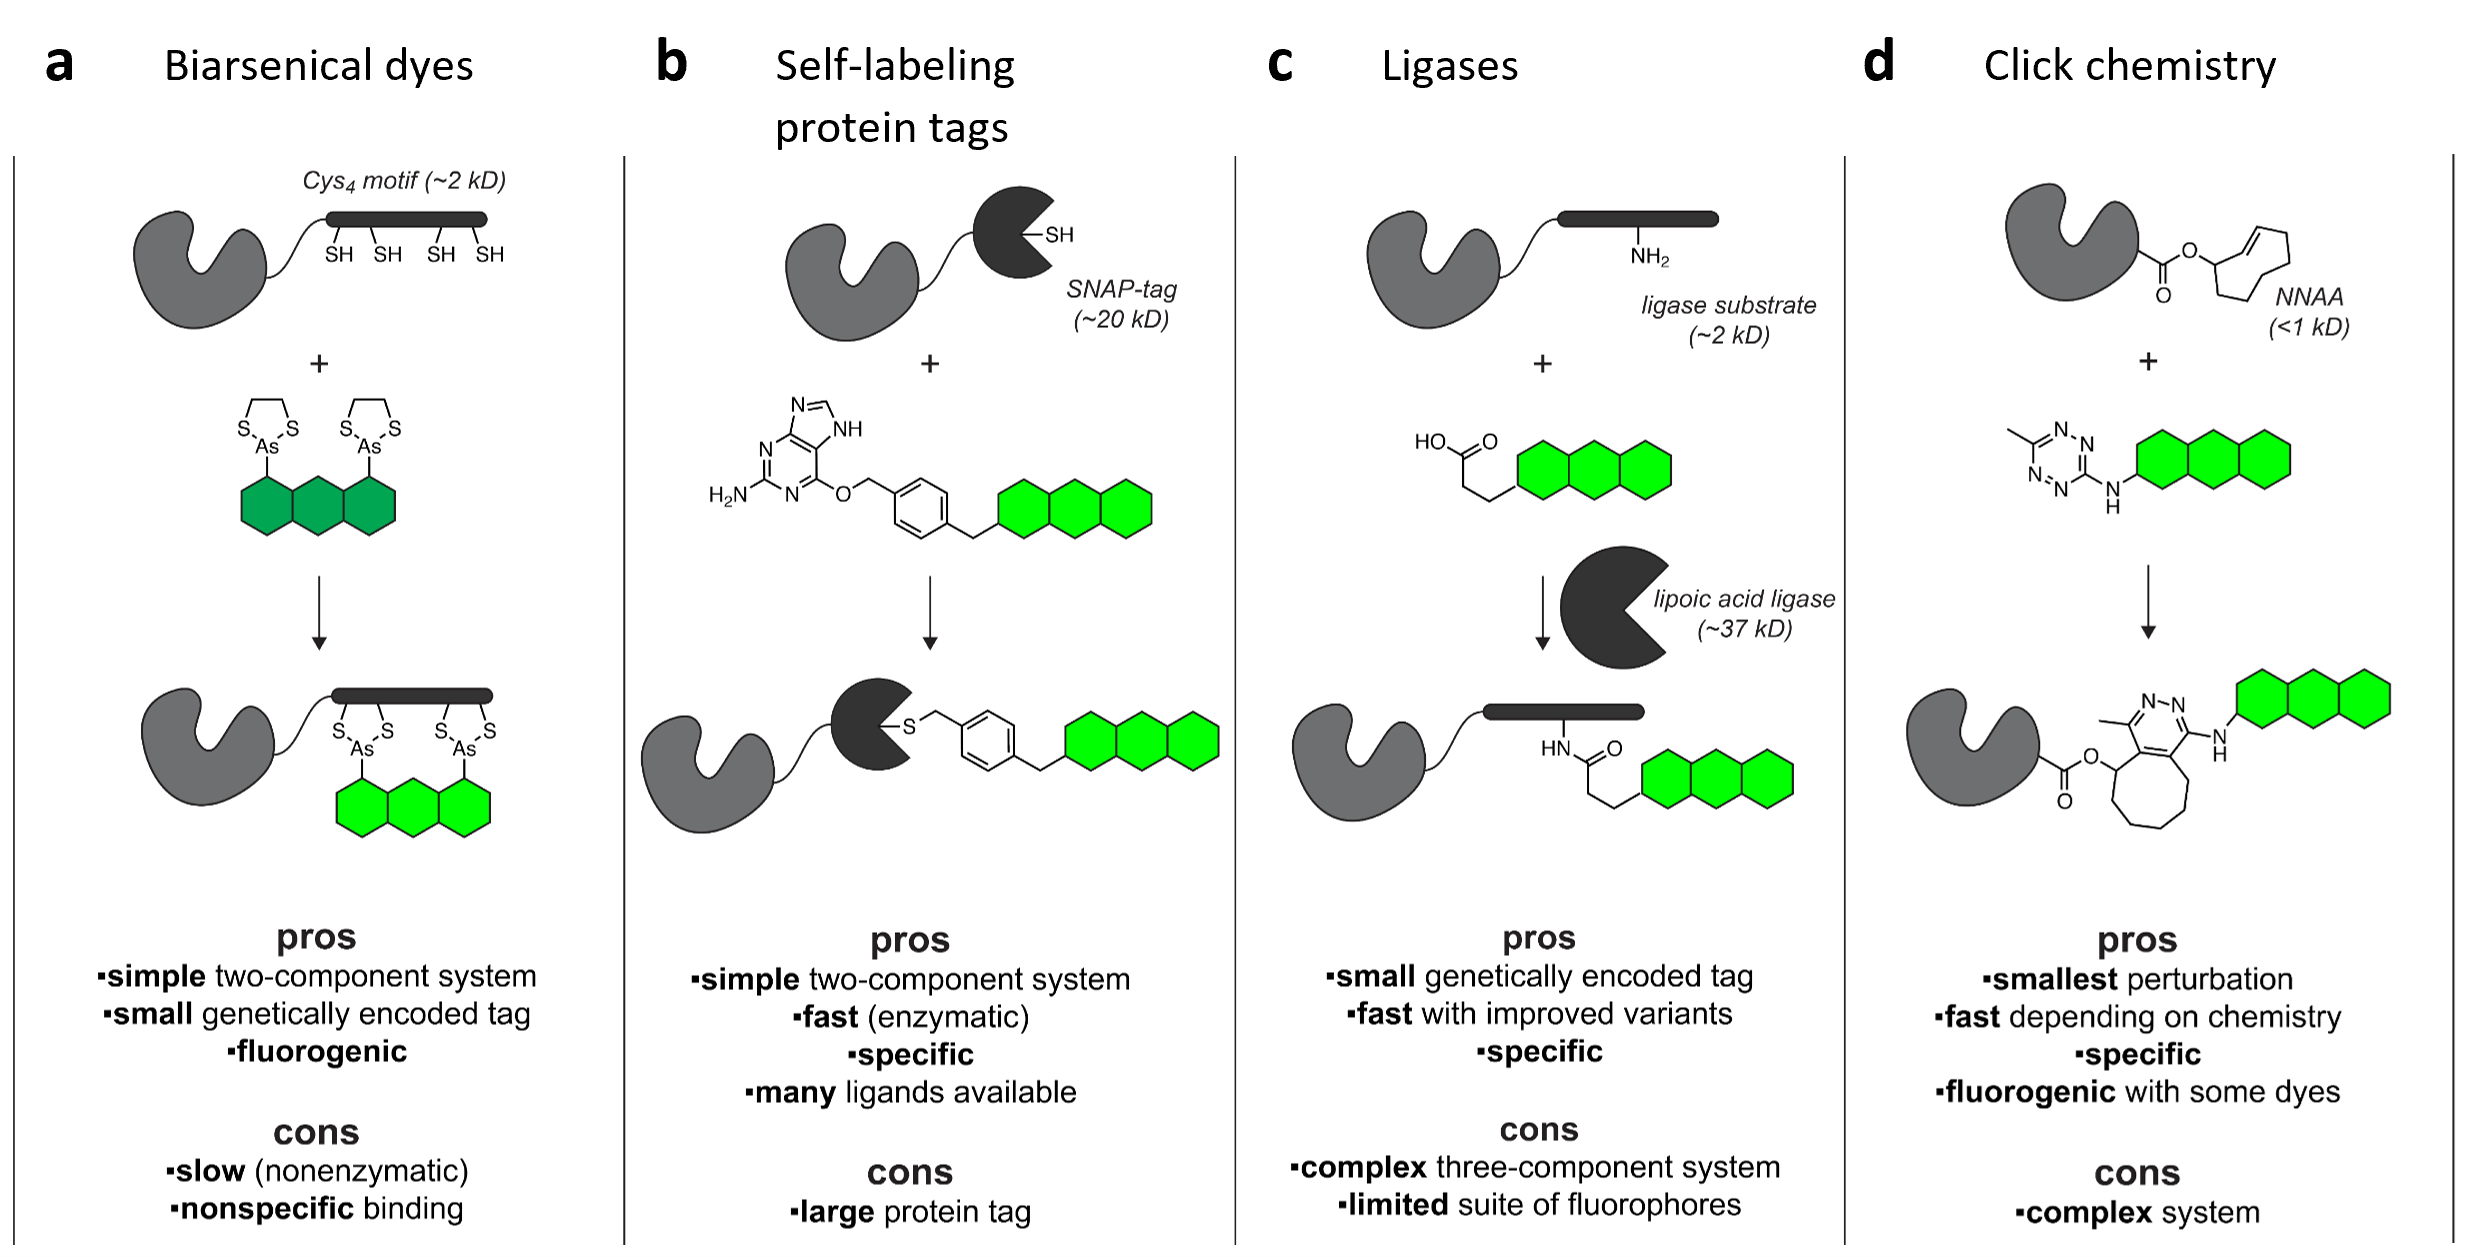
While the antibodies present throughout our bodies carry out plenty of roles just the way they are, the research antibodies in your refrigerator often need a little help to be useful. Mainly because, well, antibodies are kind of hard to see. To solve this issue, researchers ...
Throughout their history, fluorescent dyes have enabled the visualization of both organic tissues and cell cultures, opening biological interiors to many inquisitive scientists. Seeing inside these specimens has offered illumination on biochemical processes that are crucial in ...
Our popular Antibodies 101 animation is becoming a TikTok series! Follow @addgene on TikTok for bite-sized portions of antibody concepts. Each short video answers an Antibodies 101 question, like "what is an antibody?" or "what is an IgE isotype?"
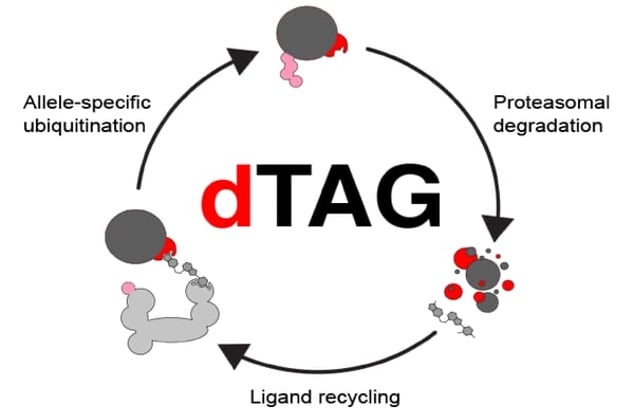
In the last decade, the use of degron tags has become increasingly popular for the modulation of endogenously and exogenously expressed proteins. Here we will review what advantages degron tags can offer over other protein control methods and compare the commonly available types ...
As a plasmid repository, we are no strangers to cloning. If you’re reading this, then chances are you have been in the cloning trenches yourself. Modular cloning, or MoClo, is a systematic cloning strategy designed by synthetic biologists to perform large scale, one-tube cloning ...
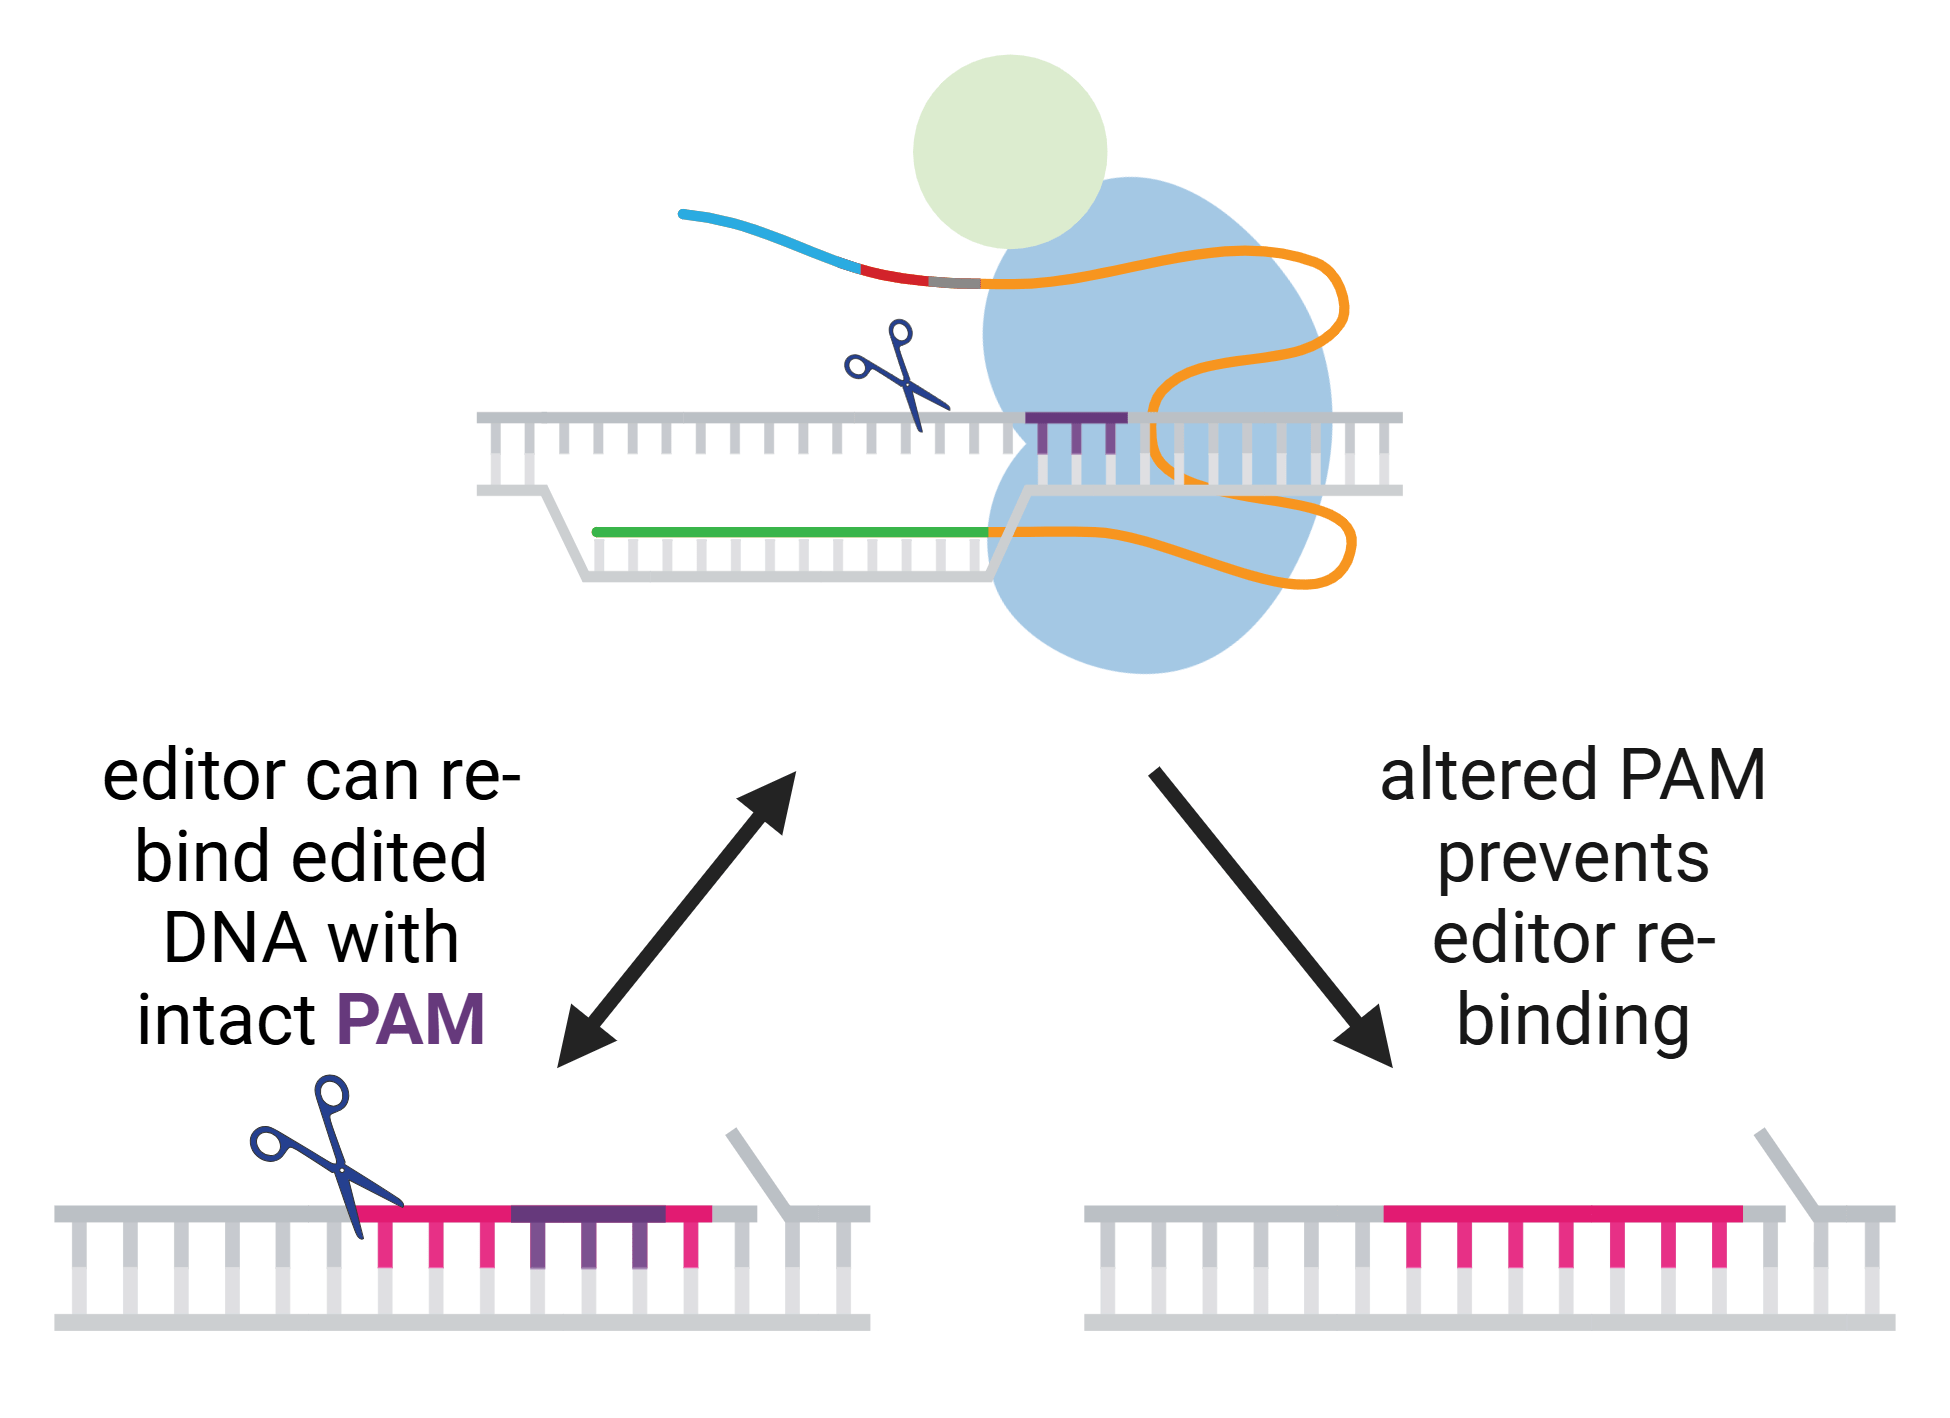
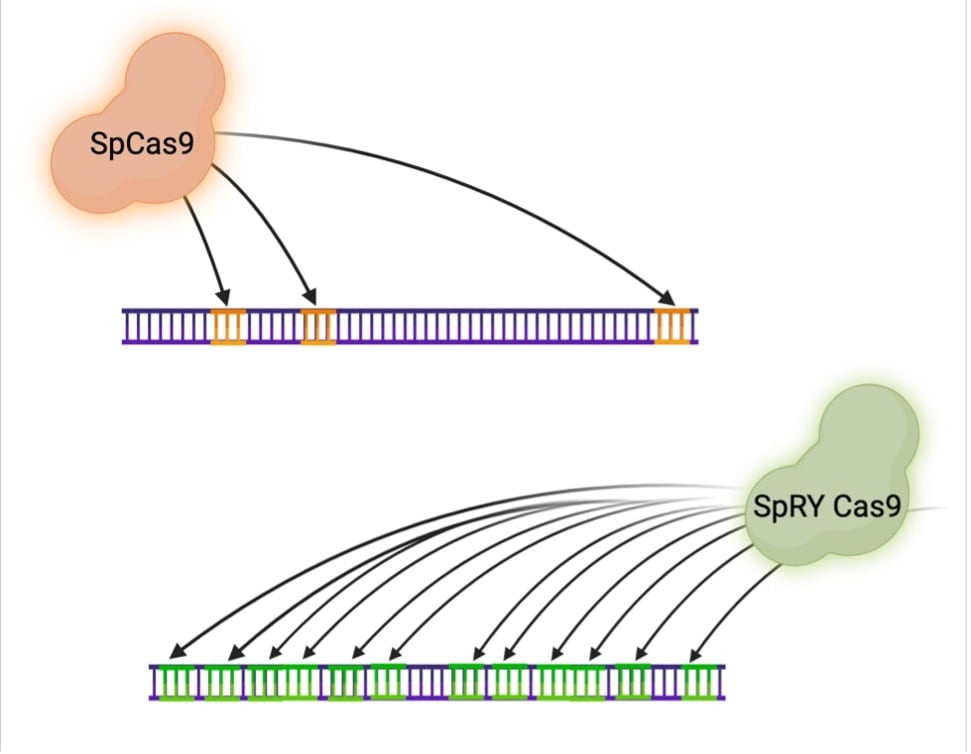
The PAM… that sneaky little bit of sequence that you hope is present next to the "perfect" guide sequence for your genome engineering experiment. With CRISPR entering the clinic for correction of disease-causing alleles, and the growing need for gene editing in research, the old ...
What's new in Addgene's ready-to-use viral vectors repository? Quite a bit! In this post, we'll share the 21 additions we've made to our viral vectors repository this year (and it's only March!)
At Addgene, it is our mission to make it easy for you to share plasmids. To achieve this goal, we will archive any plasmids you've deposited with us and distribute them to scientists worldwide. What's more, depositing is free! We've written this post as a step-by-step guide to ...
Ready to learn about antibodies? Our latest animation is here to help! Join Abi as they explain what antibodies are, their role in the immune response, and the different antibody isotypes found in mammals.
Addgene was built on the concept of accessibility: making plasmids more accessible to scientists around the world. In 2004, that was a fairly simple goal… and we had no idea how much our understanding of what accessibility is would change over the next twenty years. But learn we ...
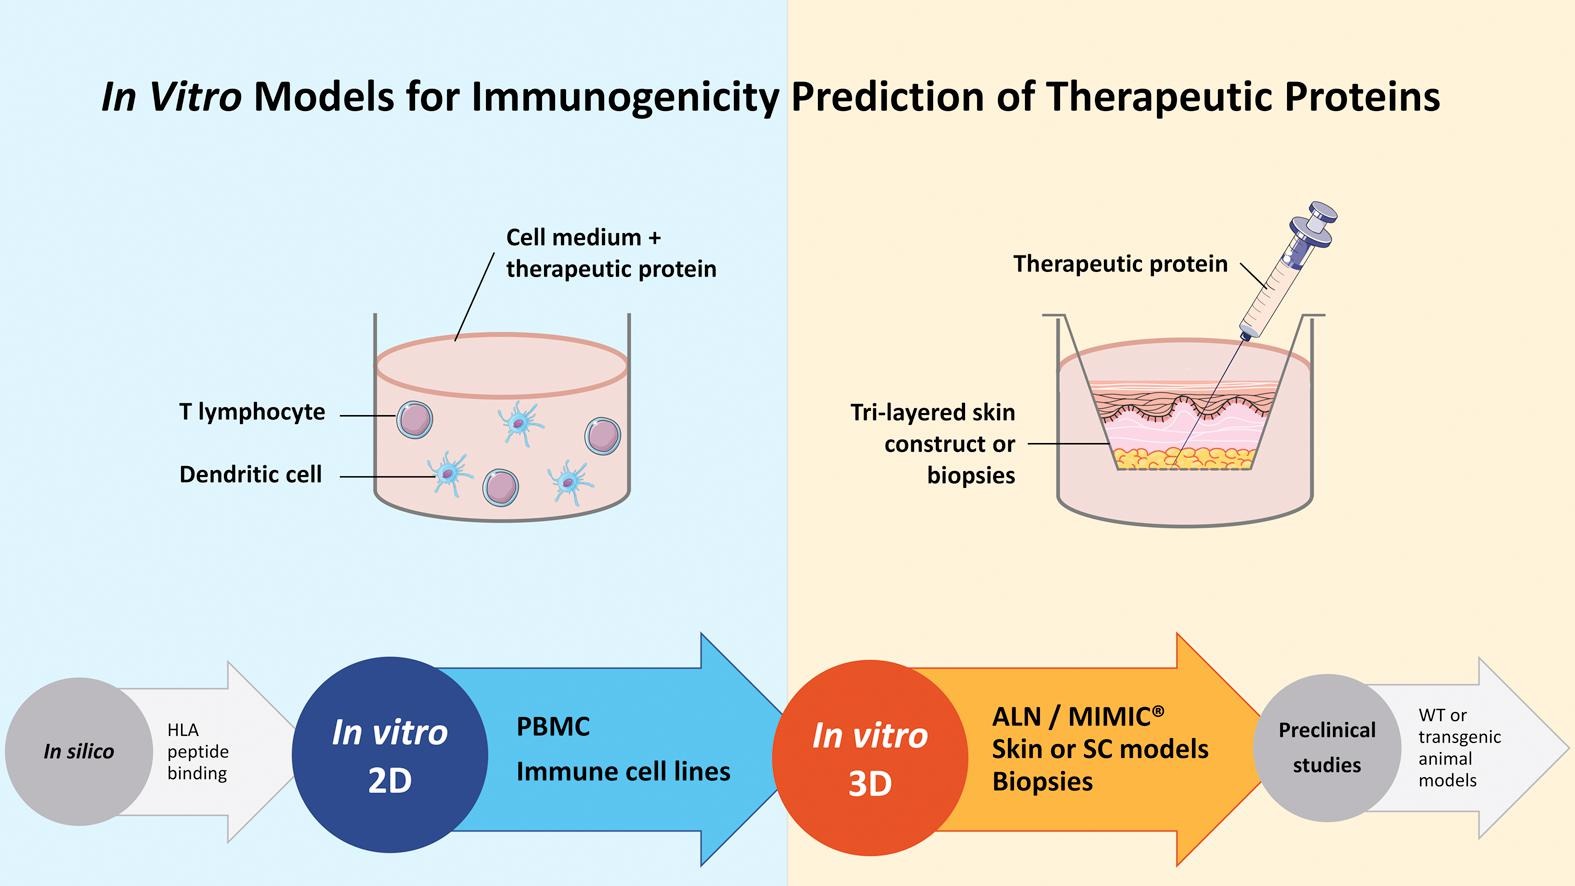
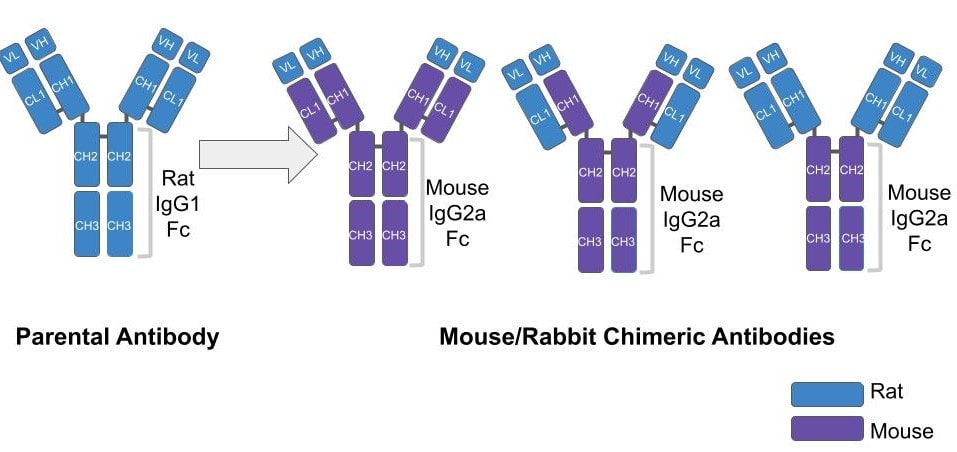
Monoclonal antibody drugs are popular therapeutics for a plethora of disease conditions, from cancer to autoimmune disorders. Antibodies administered as drugs are still immunogenic, meaning that they elicit an immune response from the body. Several factors contribute to the ...
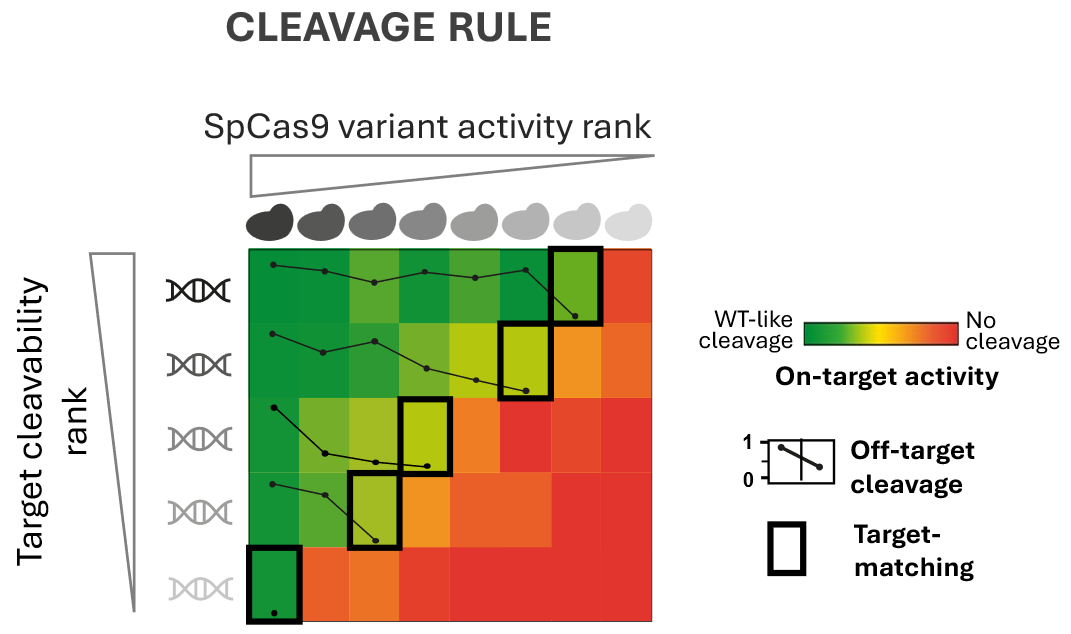
“Off-target effects” a vague catch-all term for unintended consequences in an experiment. For CRISPR work, this often means DNA cleavage at unanticipated sites. While off-target effects are nearly impossible to eliminate, it’s essential to understand them in order to design the ...
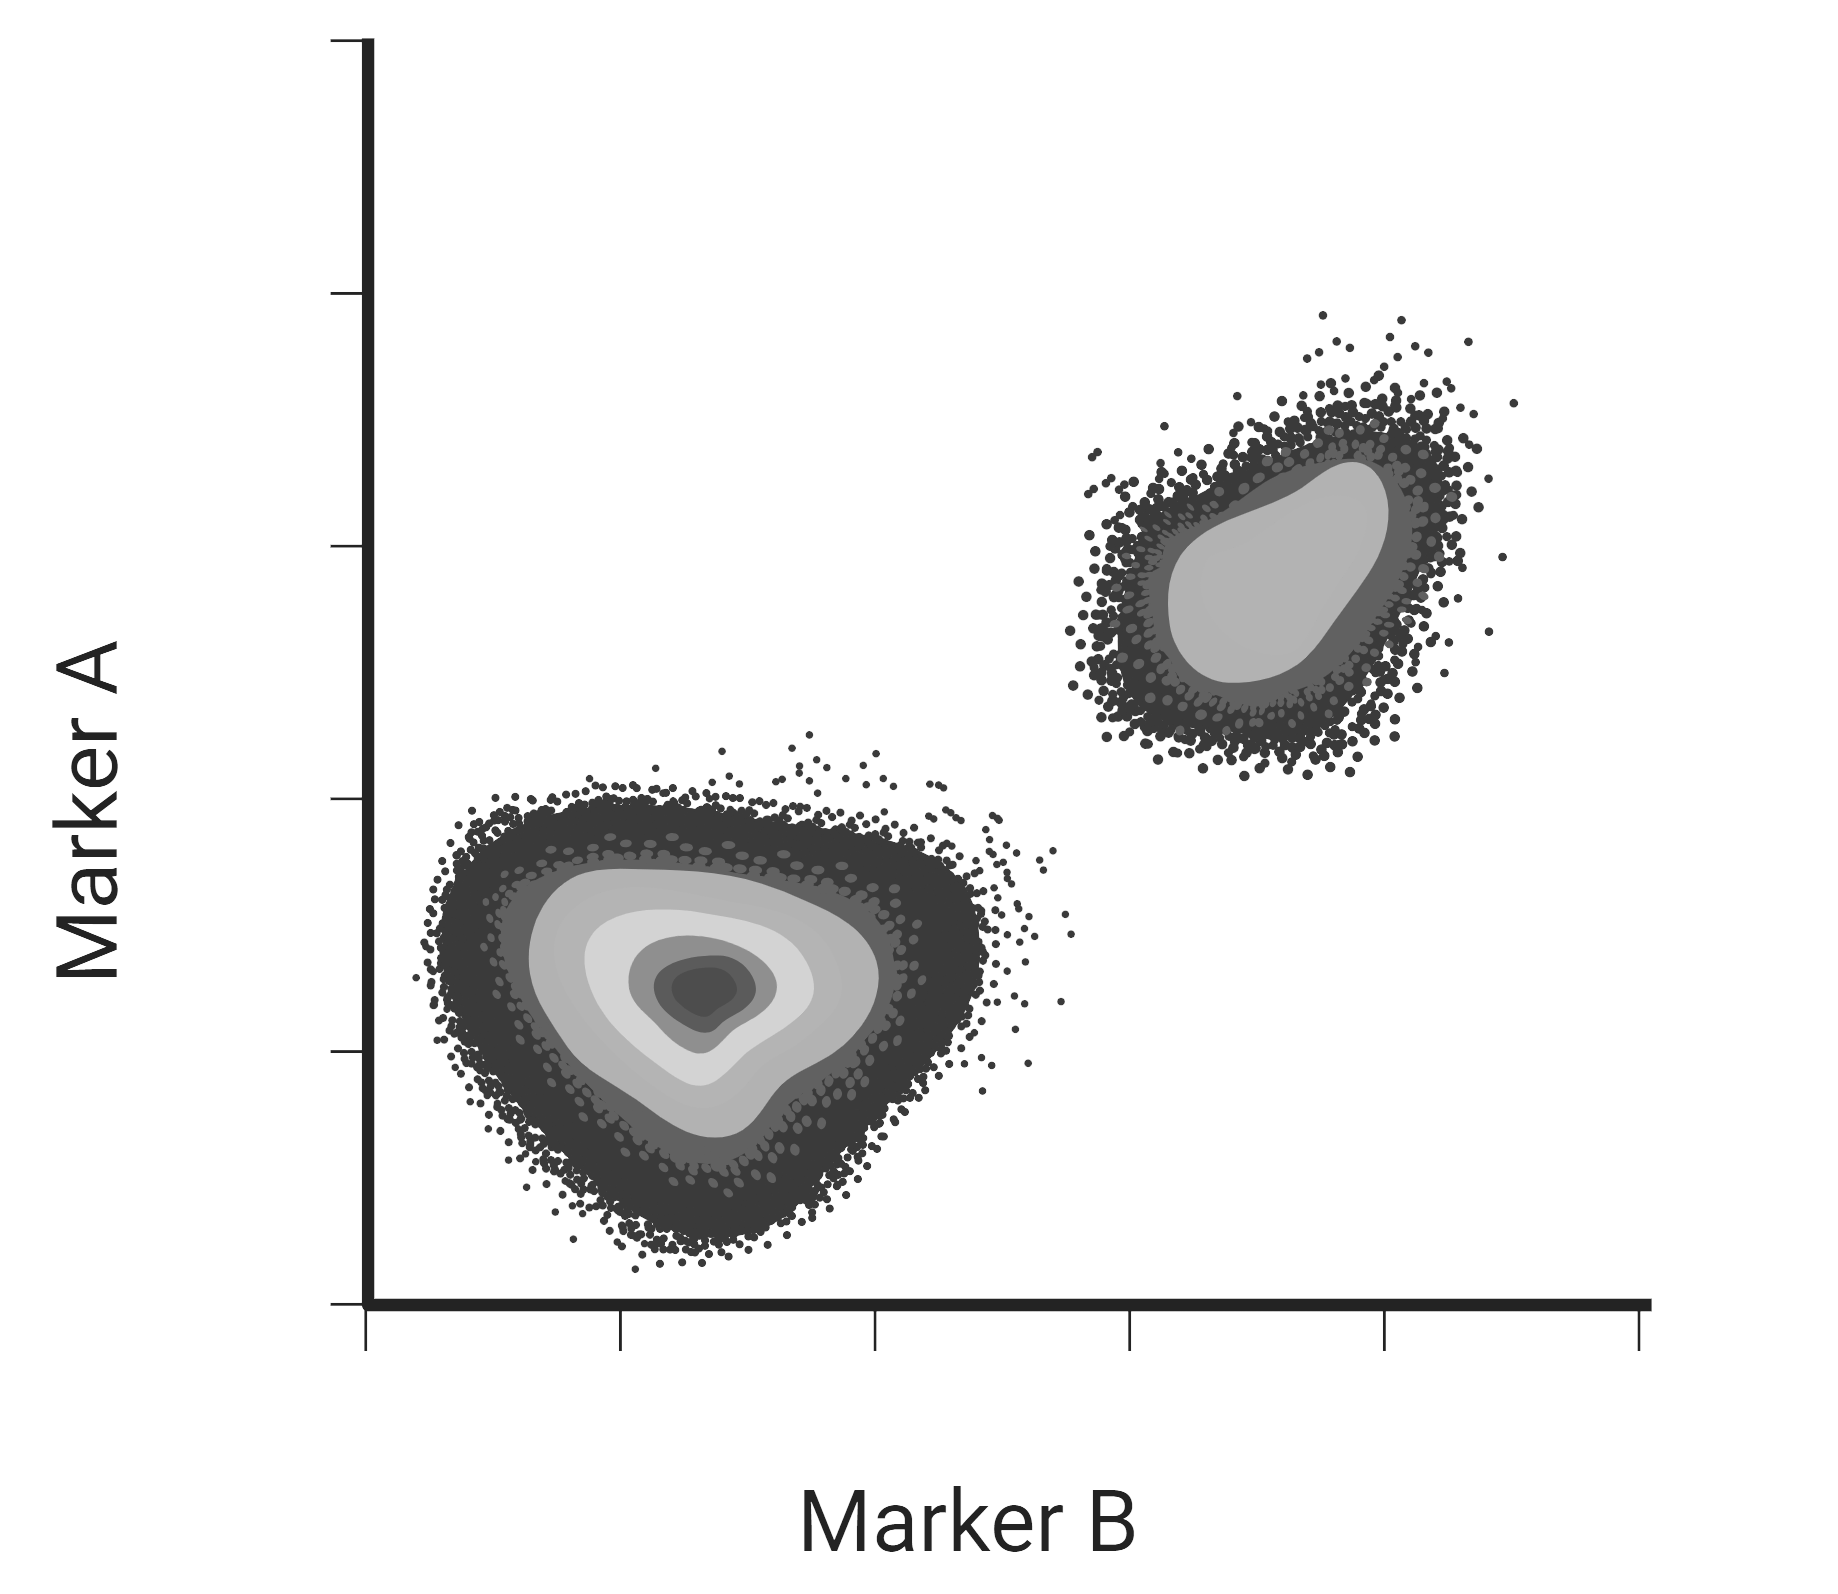
If you’re interested in studying immunology or subpopulations of cells, you’ll soon find yourself encountering flow data in the literature. Data reported from flow cytometry experiments can be a little challenging to understand if you’ve never done any flow. But in order to plan ...
Addgene is excited to announce we now offer an export license application for rabies materials! Some of the materials in our repository, including rabies plasmids, are export-controlled materials in the USA, where Addgene is located. The export license, if granted, allows us to ...
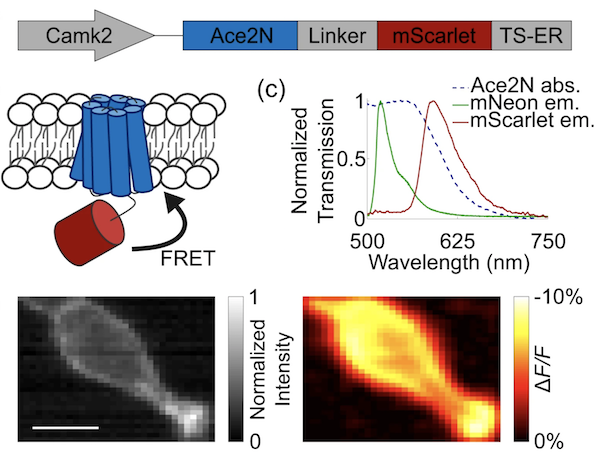
Cellular communication and function depend on potential energy. Cellular activities like action potentials, muscle contractions, and the control of voltage gated ion channels all depend on transmitting and sensing electrical potential. Thankfully, there is a tool to measure ...
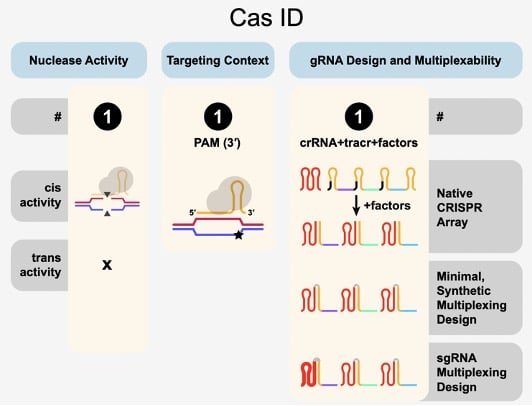
Once upon a time, not so long ago, spCas9 was the only Cas enzyme widely available and applied by researchers for gene targeting. Fast forward a decade, and the CRISPR field has exploded with dozens of Cas enzymes and variants available. Without a comprehensive resource, it can ...
With renewed energy and optimism that comes at the start of every new year, it is a wonderful opportunity to once again reflect on our achievements in the last year and share the exciting things to come in the new year. I am proud of what we accomplished in 2023 and thrilled to ...
¡La primera edición de nuestro libro electrónico CRISPR 101 ya está disponible en español!
Annotation of genes in immune cells typically involves the creation of germline knockout mice, which is time-consuming, as it only changes one gene at a time. CRISPR-based systems enable gene knockout in immune cells in a high-throughput manner, but these systems have not been ...
Addgene is announcing we have chosen to stop all activity on X, formerly Twitter. If you are interested in engaging with us on social media, you can find us on Bluesky: @addgene.bsky.social; or @addgene on Instagram, TikTok, Facebook, and LinkedIn. We are also exploring other ...
Today marks Addgene's 20th anniversary! We've done so much in the past two (2!) decades that it's hard to summarize, but we wanted to mark the occasion by trying.
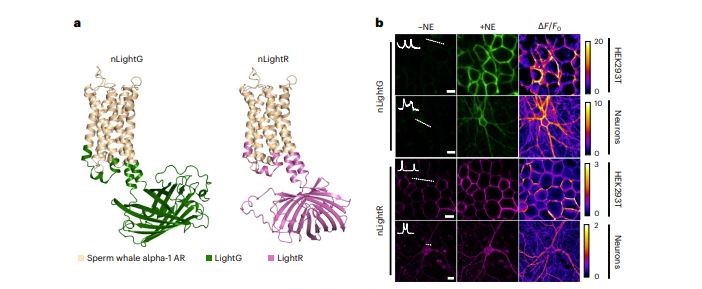
Neuromodulators like dopamine and norepinephrine have important functions in the brain but have been difficult to study without biosensors to directly visualize their activity. In 2019, the first generation of norepinephrine sensors was developed, named GRABNE, which helped ...
It's December, and that means it's officially the start of Addgene's winter holiday celebrations! We're kicking it off by sharing all the incredible guest posts and stories featured in our blog in 2023. Some of these were written by guest authors, while others chose to work with ...
Every few months, we highlight a subset of the new plasmids, antibodies, and viral preps in the repository through our Hot Plasmids articles. Today, it's time for another edition of Hot Plasmids!
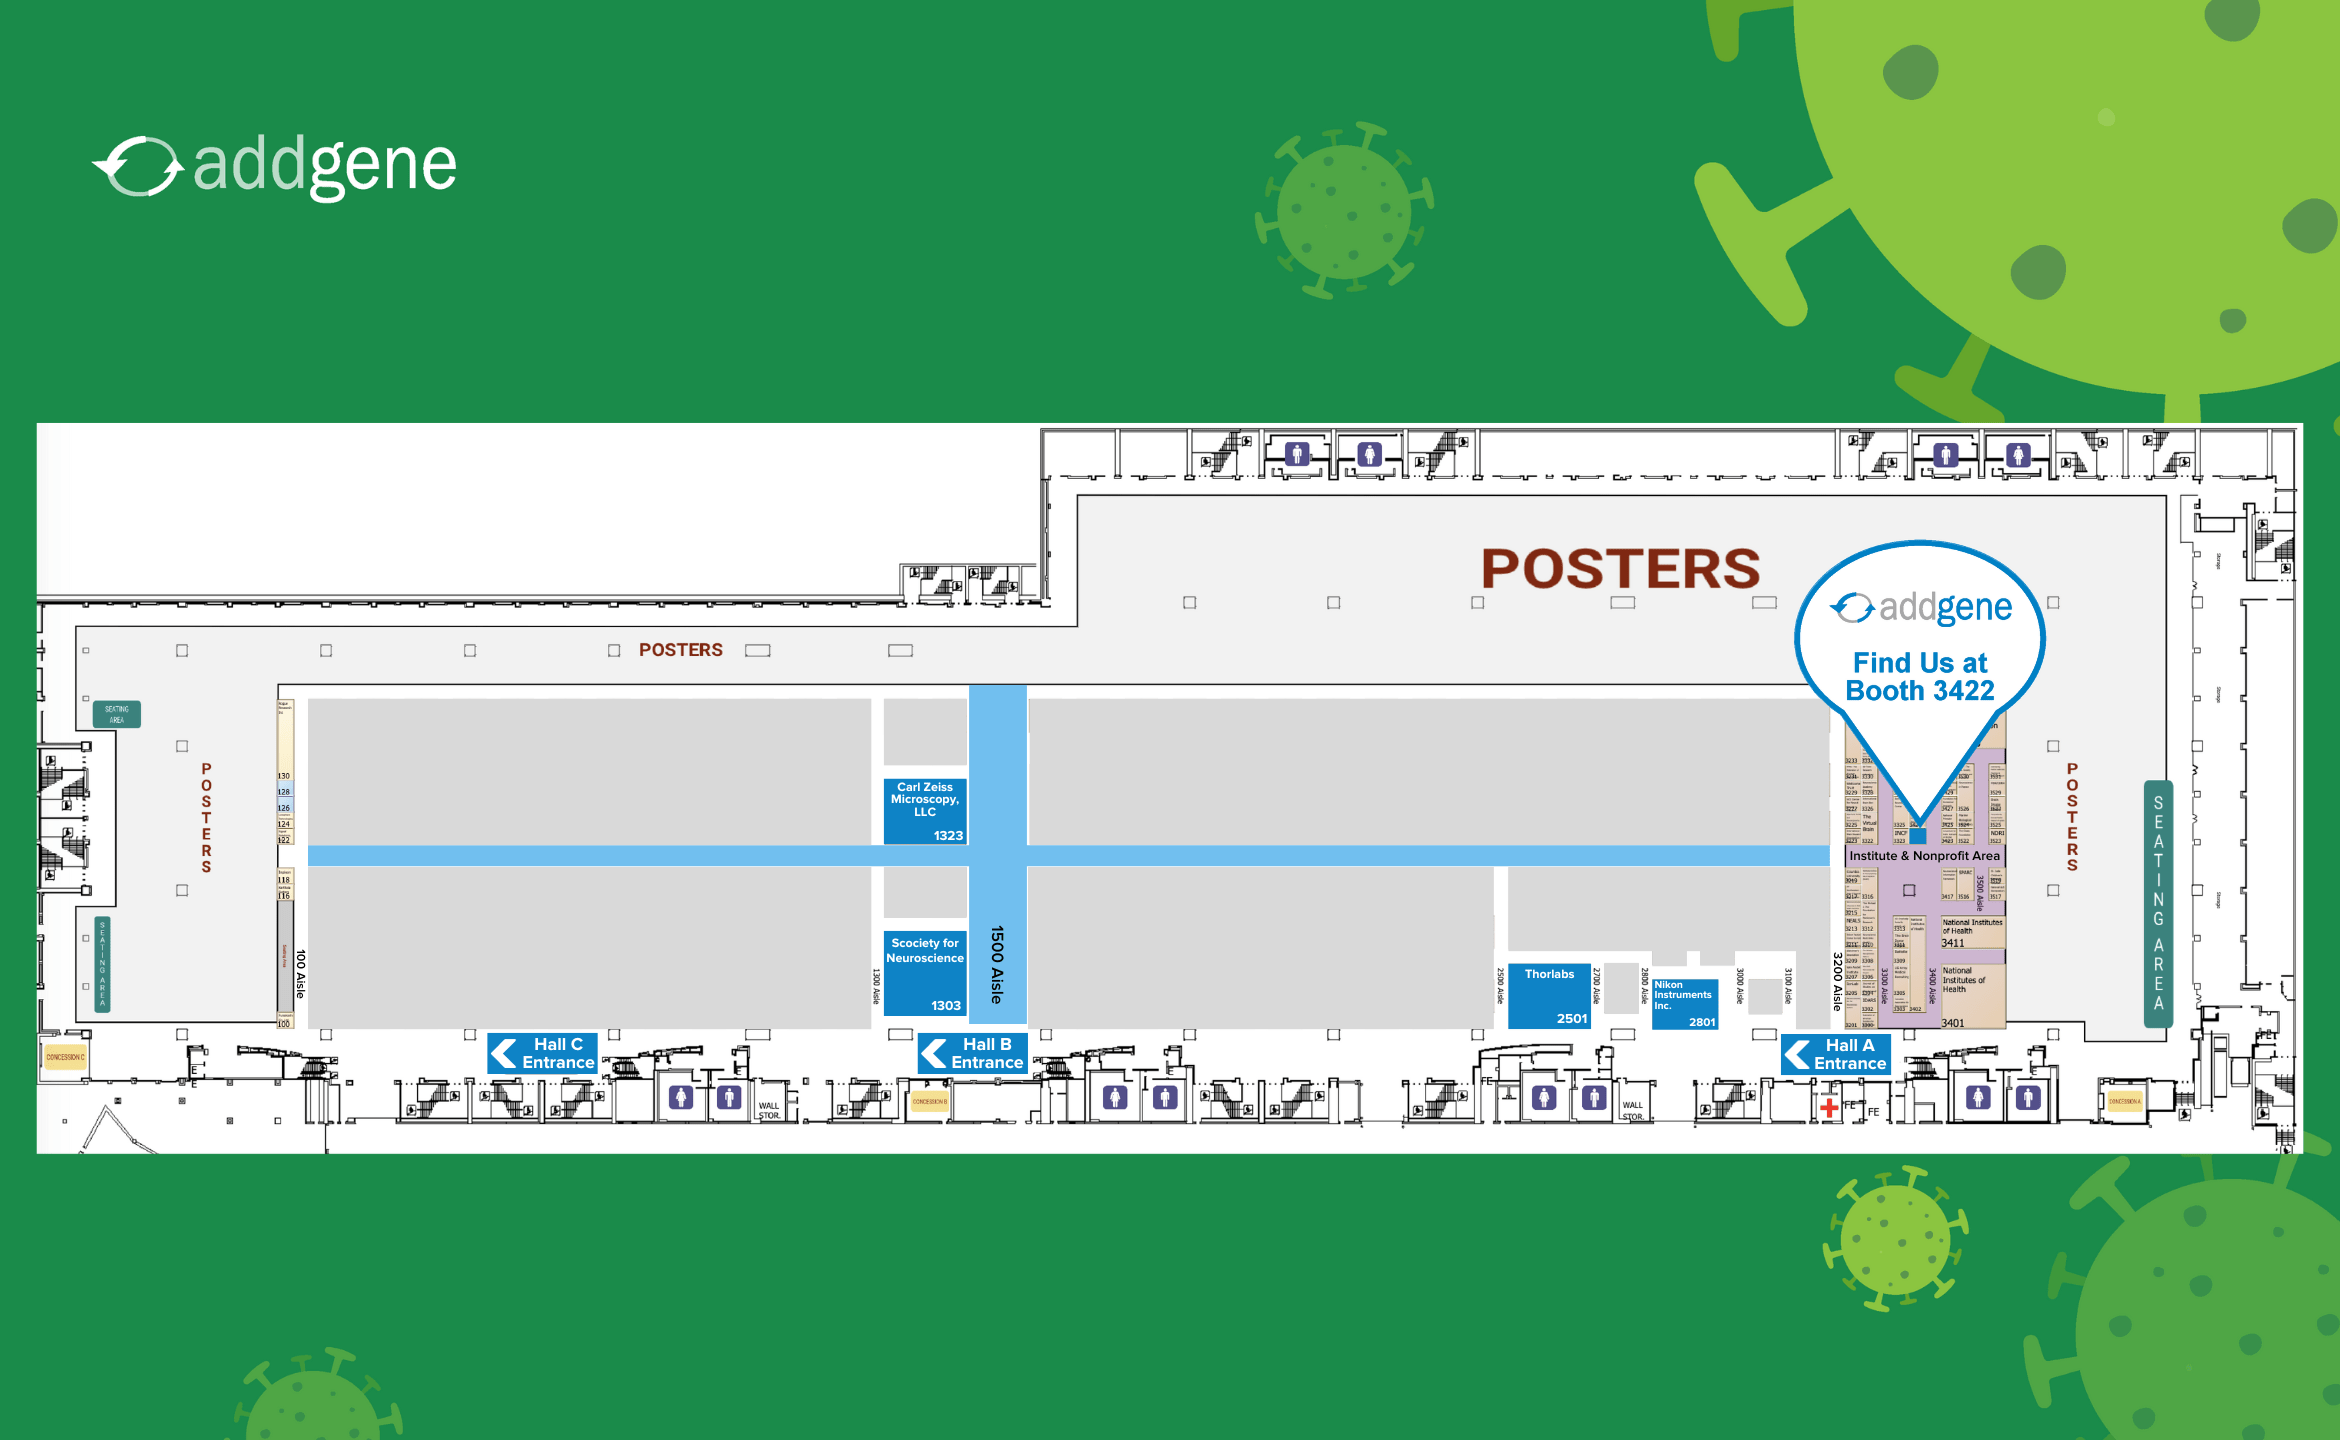
Getting ready for Society for Neuroscience Conference 2023? So are we! Come say hi to us at Addgene's booth, #3422, in the nonprofits section.
There can be no doubt that CRISPR/Cas9 technology has been a breakthrough for the genome-editing field and the greater scientific community. In 2014, we wrote a blog post on CRISPR’s potential for correcting monogenetic diseases. Now, almost 10 years later, CRISPR’s potential ...
Looking for a fast and inexpensive way to determine your antibody's purity? Check out our latest protocol video, "Coomassie Purity Stain of Recombinant Antibodies."
Addgene has a growing catalogue of viral preps available to request. In this post, we’ll walk you through how we produce both our AAV preps and our lentiviral preps.
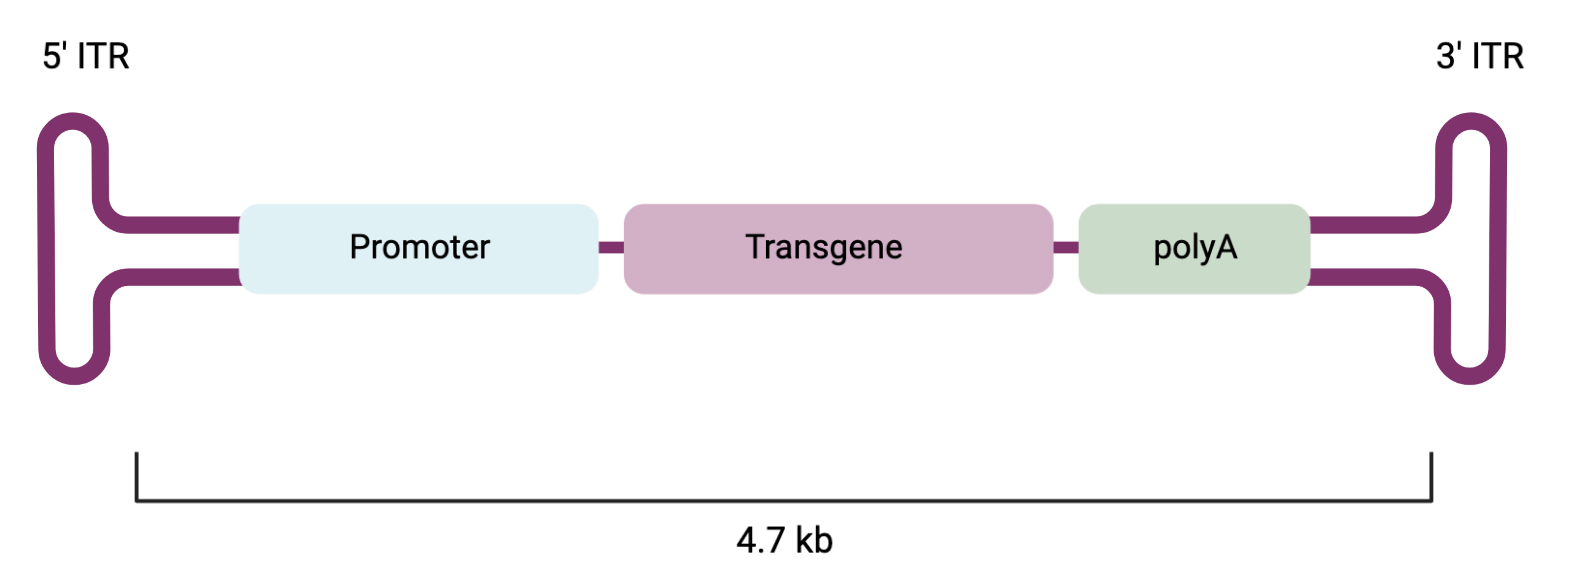
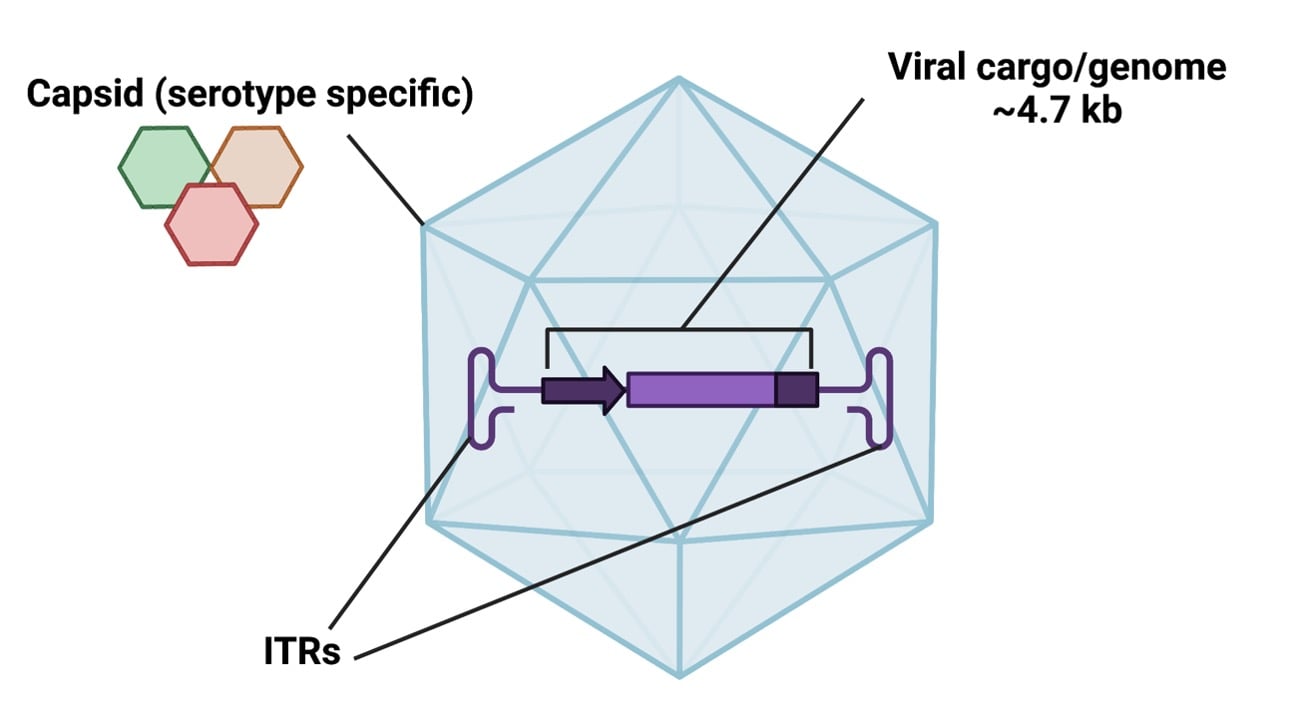
Adeno-associated viruses (AAV) are an important biological tool that allow scientists to express a gene of interest in a cell or animal model. AAV plasmids contain several important elements, but among the most important are the inverted terminal repeats (ITRs). ITRs are the ...
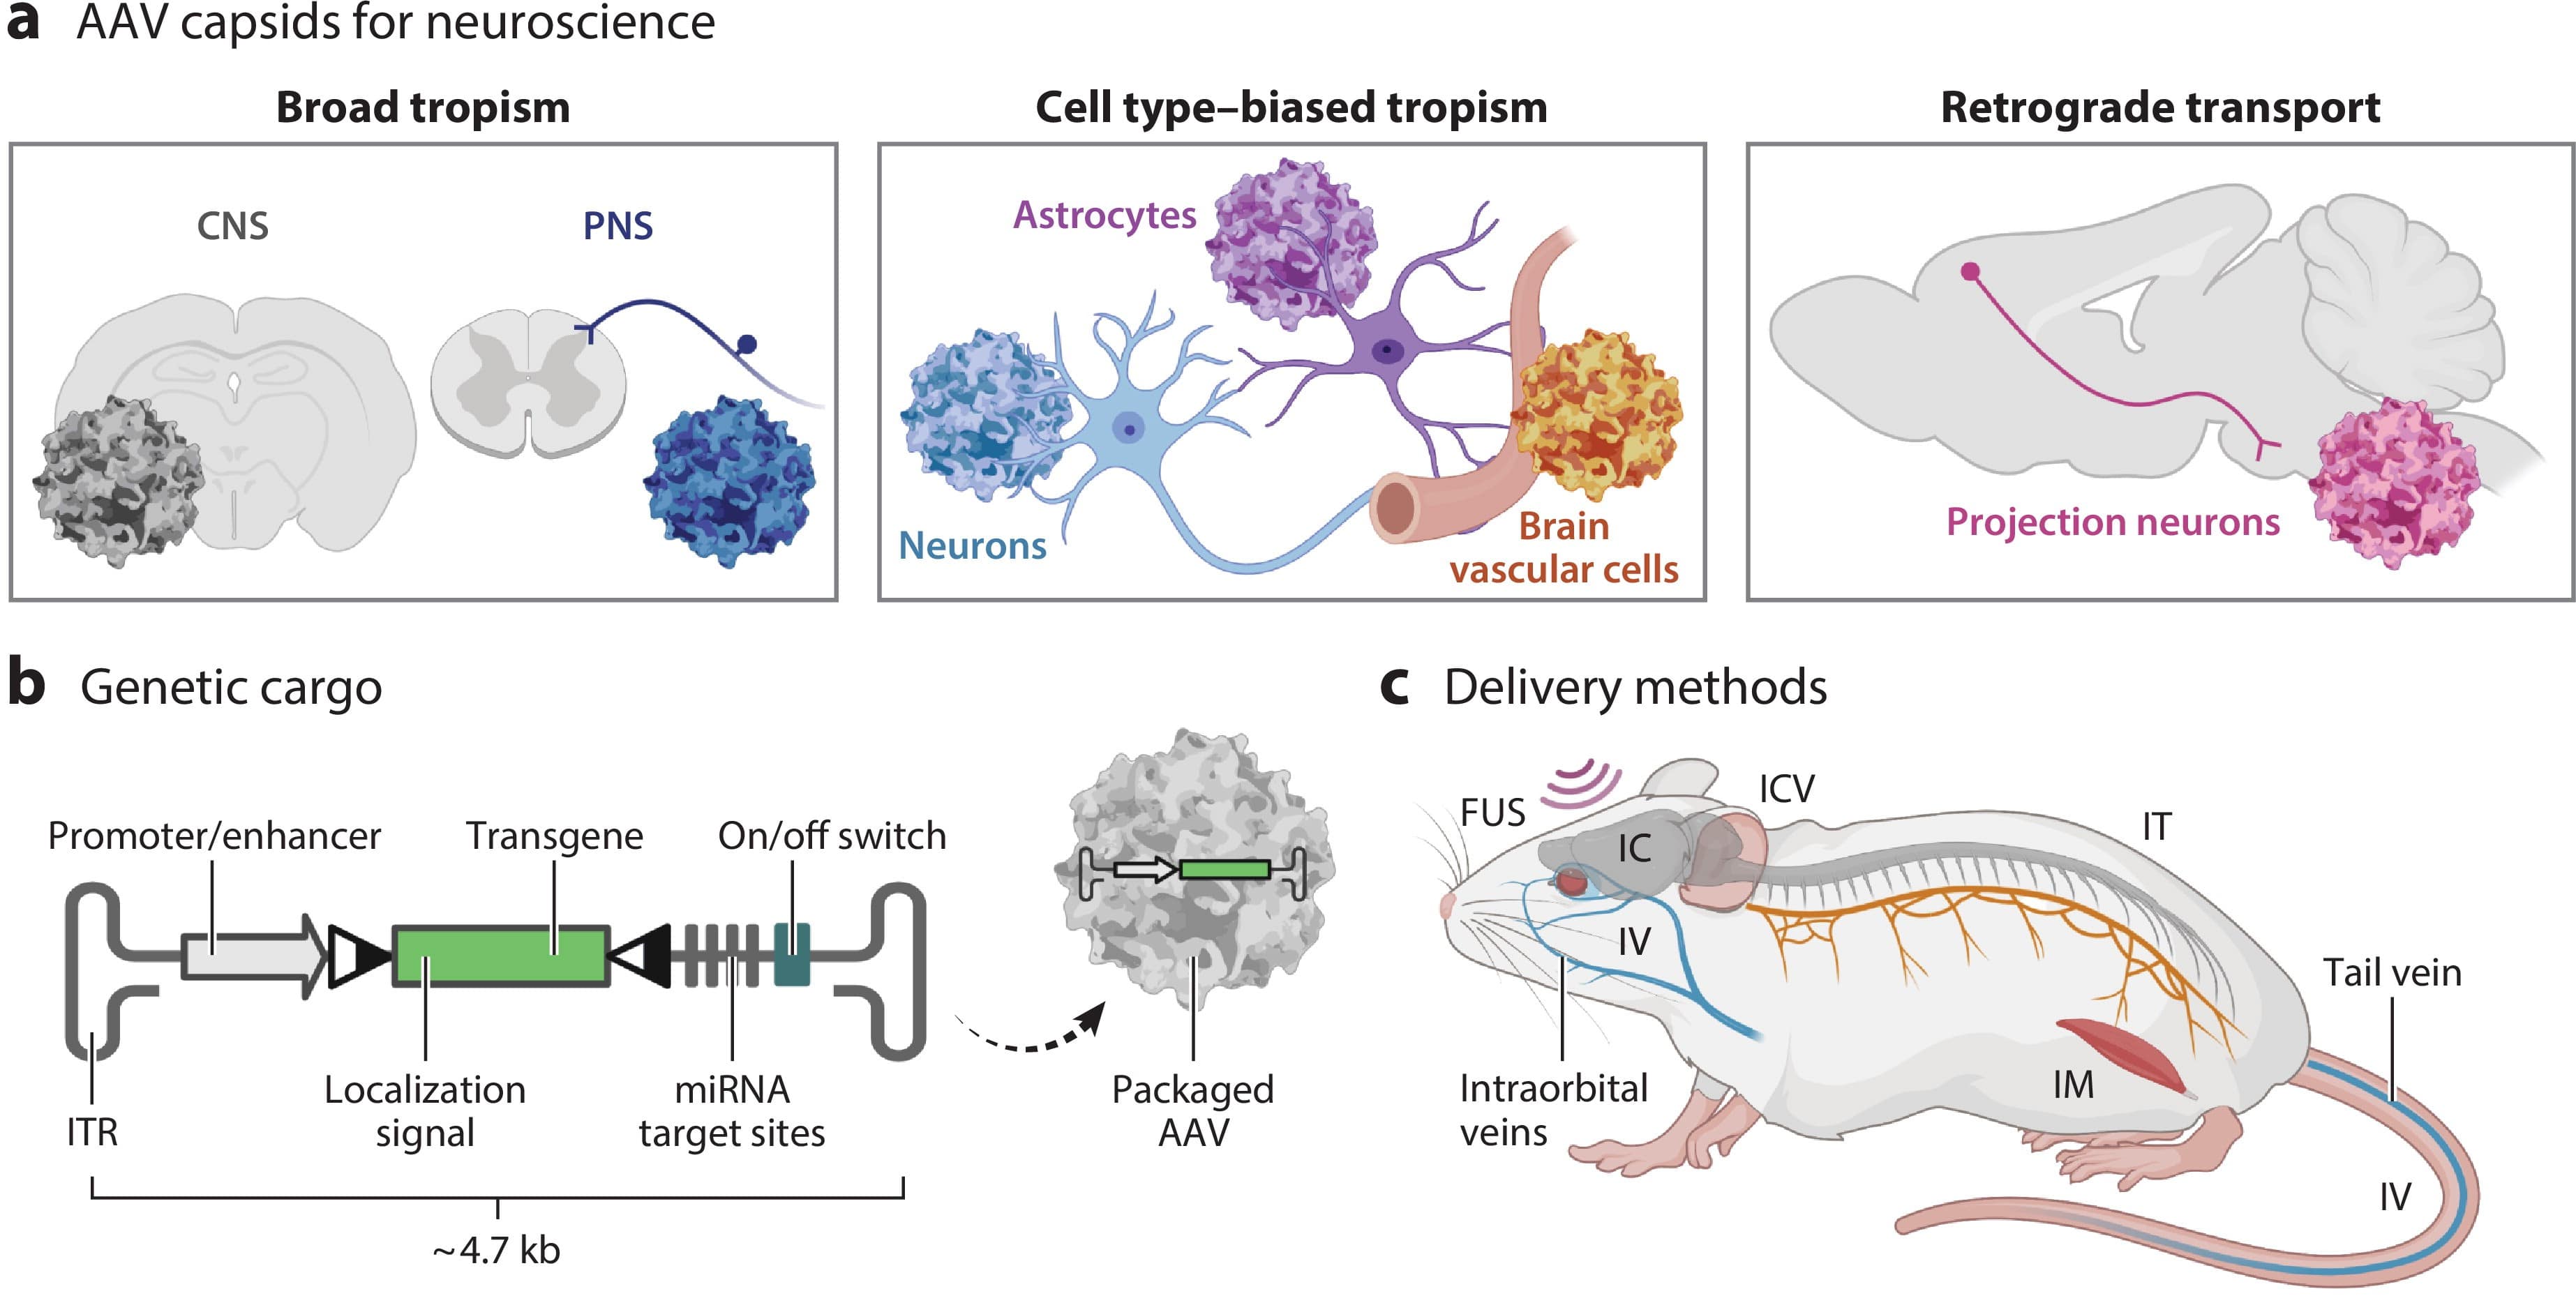
The blood-brain-barrier (BBB) exists to prevent substances in the blood, like proteins and viruses, from crossing into the brain. While helpful from a biological standpoint, it makes delivering AAVs to the brain difficult. Traditionally, delivery is achieved through the use of ...
Plasmids need antibiotic resistance genes so that you can specifically isolate bacteria containing your constructs of interest. But does it matter which antibiotic resistance gene you select? In this blog, we’ll break down the mechanism of action of the most common antibiotic ...
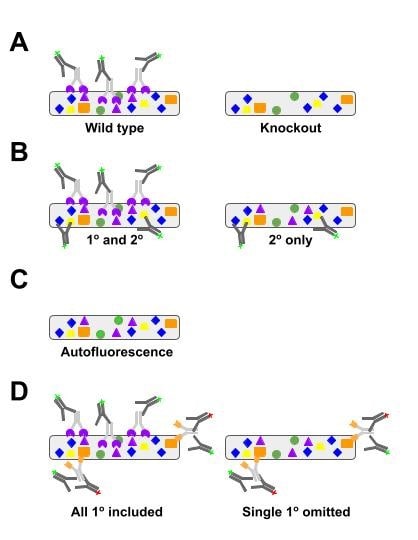
In a world where so much is out of your hands, it’s helpful to focus on something controllable, like experiments (and their controls!). This blog post will discuss the ins and outs of controls for biological experiments, starting with general controls and then moving on to ...
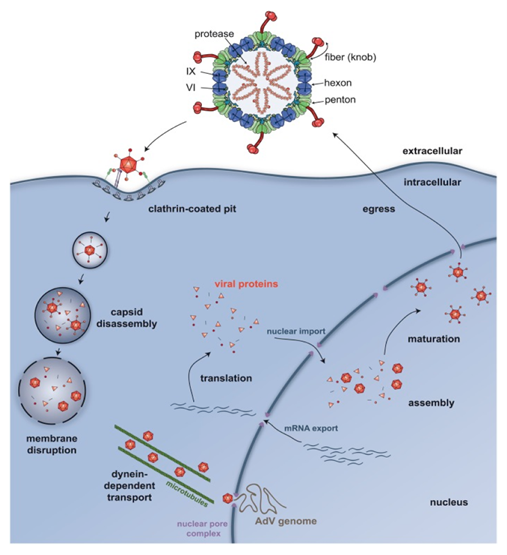
In April 2022, physicians in Scotland began noticing unusual cases of acute hepatitis in the pediatric population. Once ~400 cases had amassed in places around the world, hypotheses began to develop that this illness was caused by either SARS-CoV-2, Adenovirus type 41 (AdV-41), ...
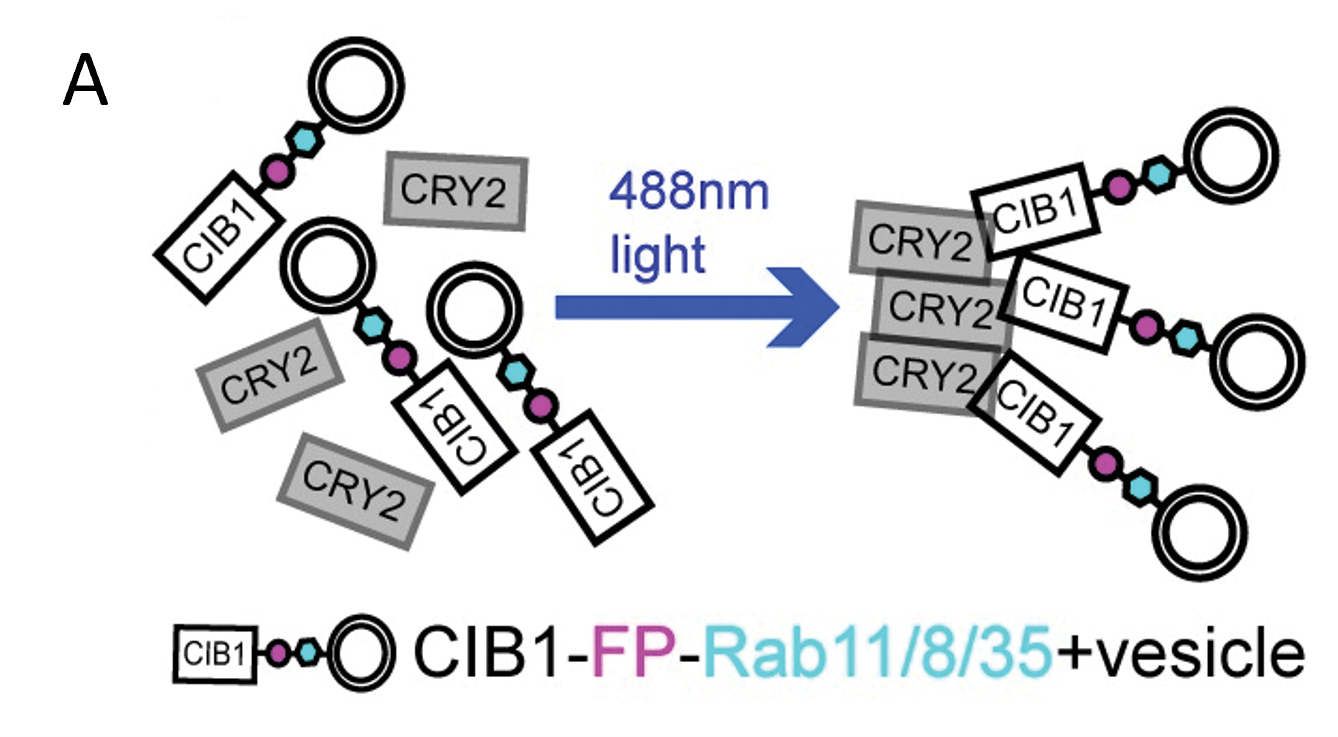
Optogenetics gives you the power to control cells or organisms with the flip of a switch. You may be familiar with popular light-sensitive ion channels used to control activities like neuronal signaling — think of a mouse with an LED brain implant or a worm wiggling back and ...
We’ve all either been there or are going to be there – undergraduate students, rotation students, joining a new lab at any career stage, learning a new technique while visiting a lab, or maybe even training on a new technique with a coworker. Being a new trainee (even if you’re ...
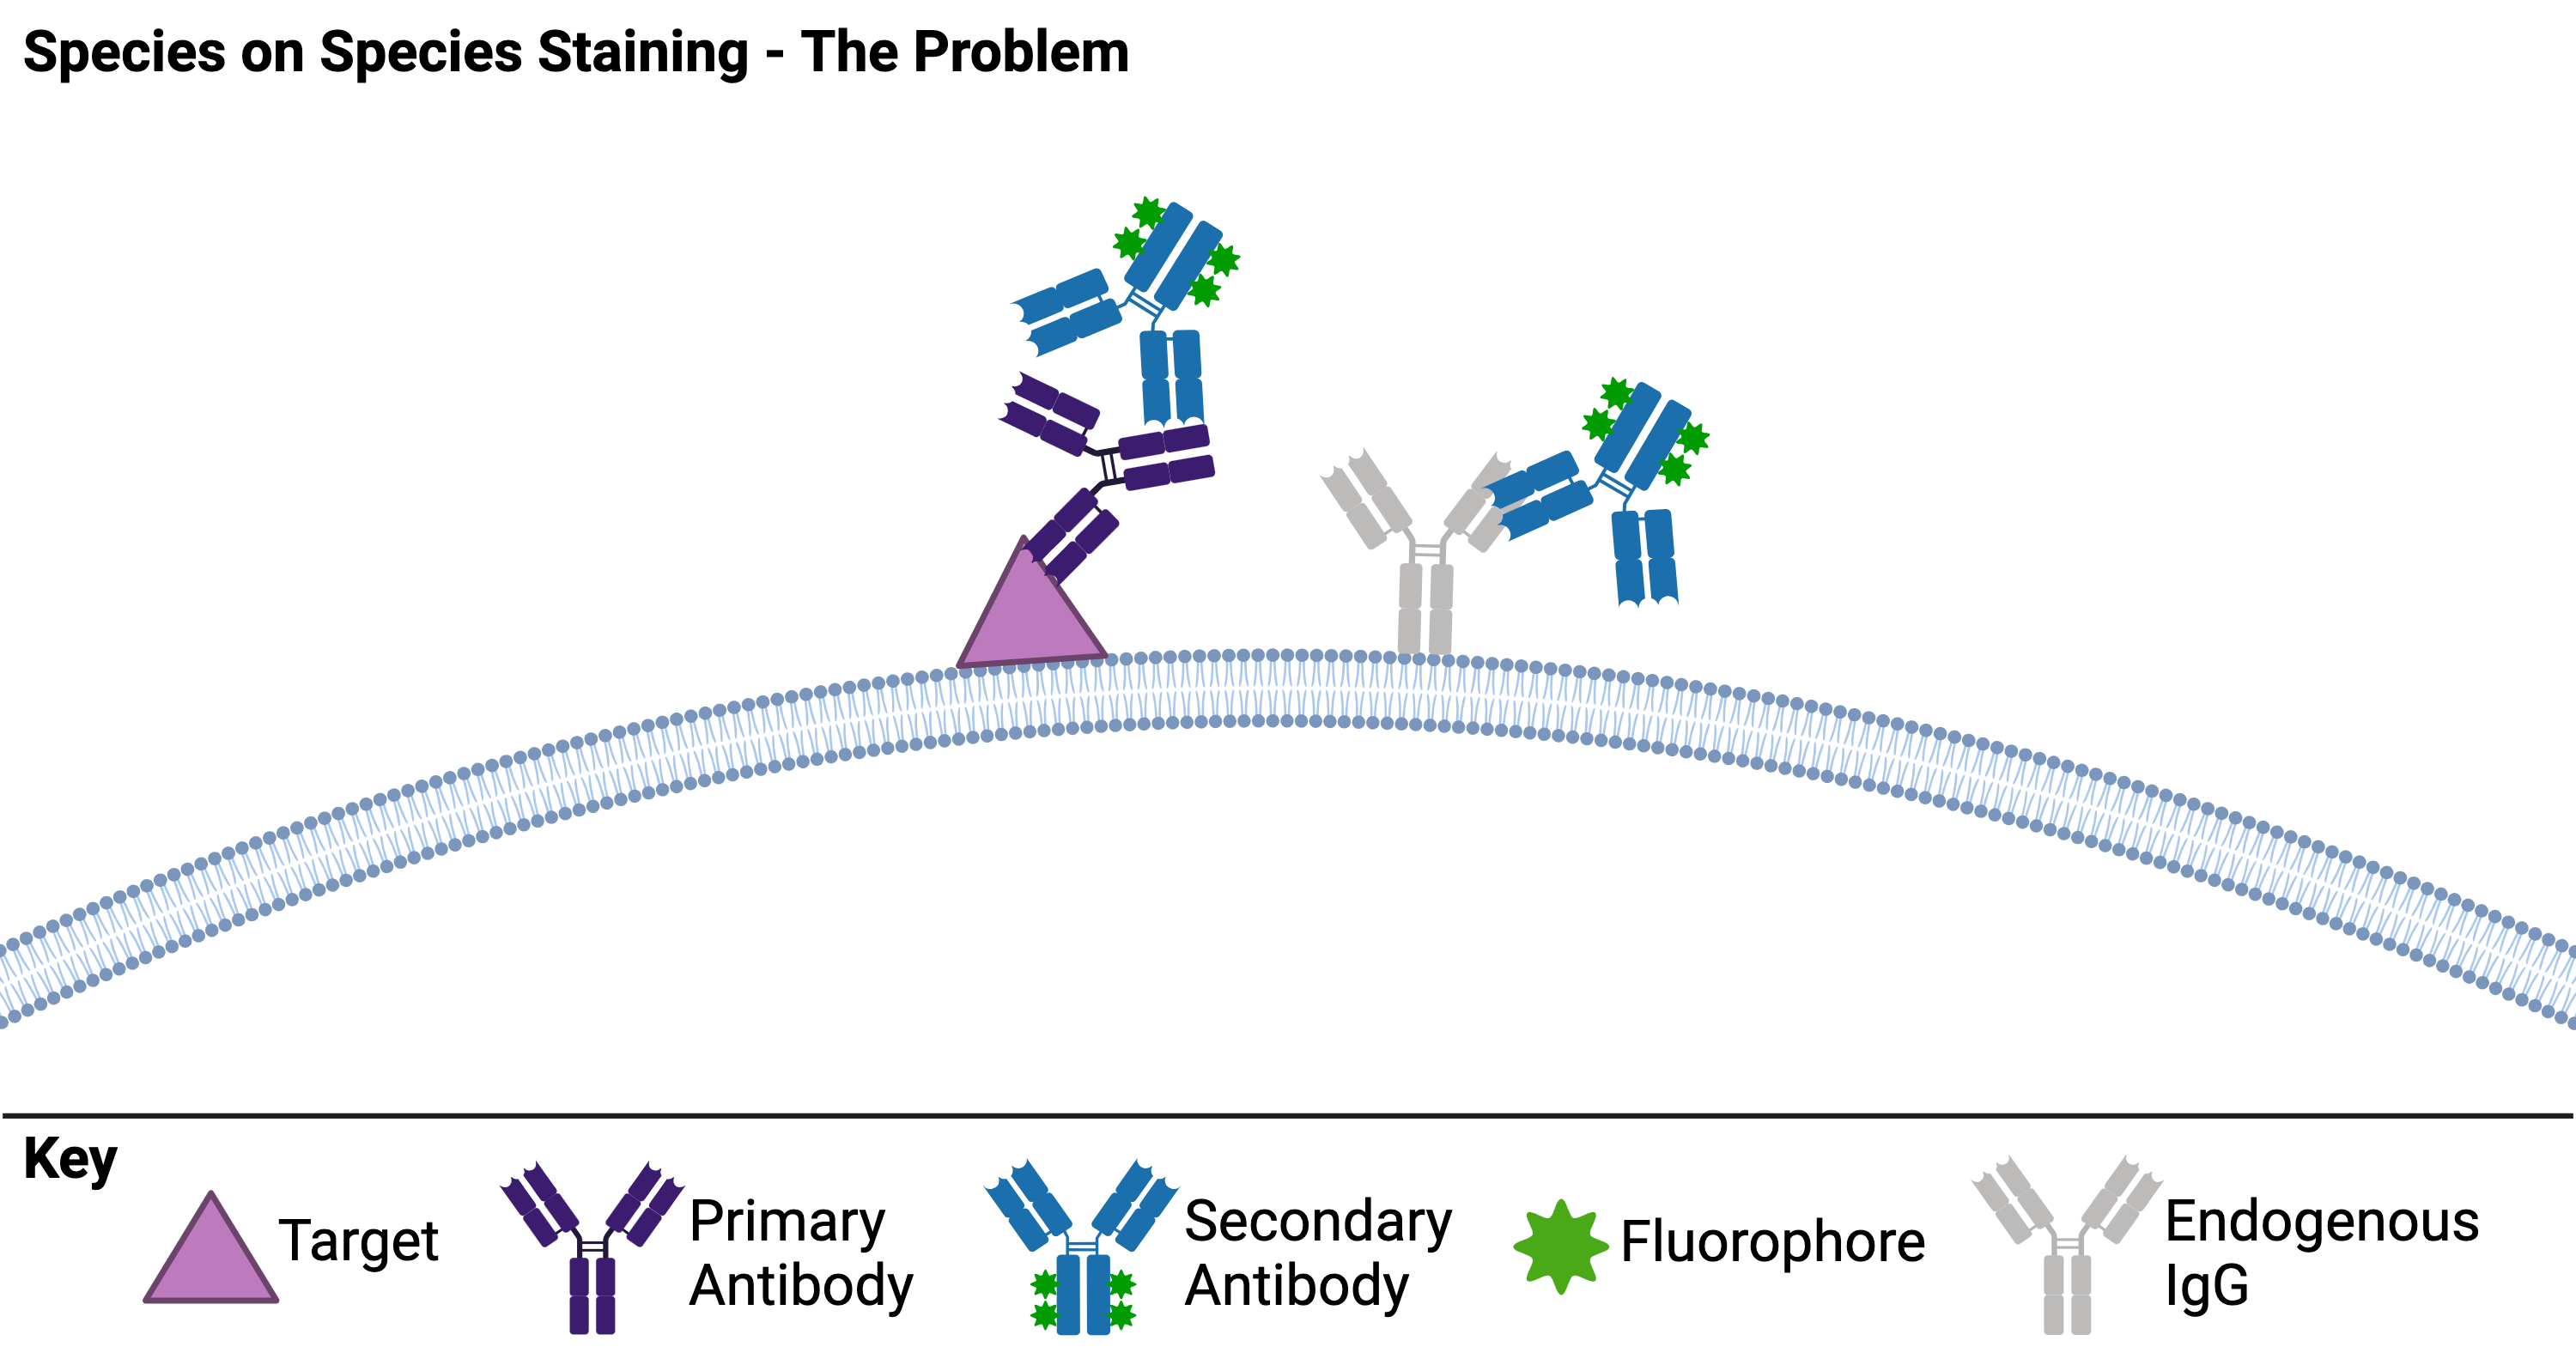
Fighting with antibodies to produce immunohistochemistry images that are crisp, bright, and lacking in non-specific staining can be a challenge in the best of cases. But it can be particularly challenging when your only antibody option is from the same species as your tissue ...
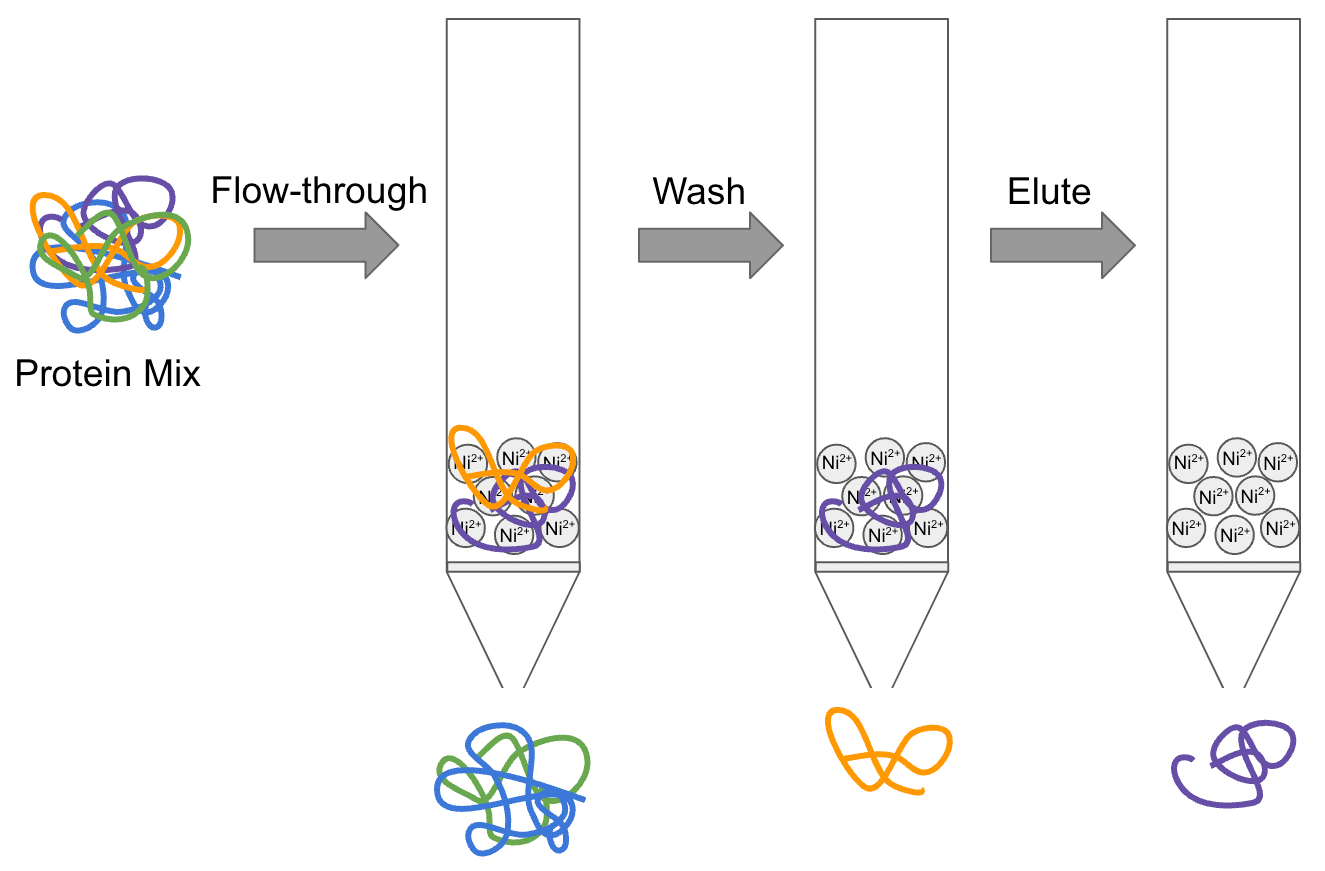
You’ve designed the perfect experiment – controls, conditions, and everything in between – now all you need are some of your favorite proteins purified to carry out your plan. With a little thoughtful planning, affinity tags can make protein purification a cinch. Types of ...
I spent about seven years working in research labs, and then pivoted to writing full-time in mid-2020. As I left the ivory tower and walked down into its foothills, I began to have conversations with many people who eagerly follow progress in synthetic biology, and want to be ...
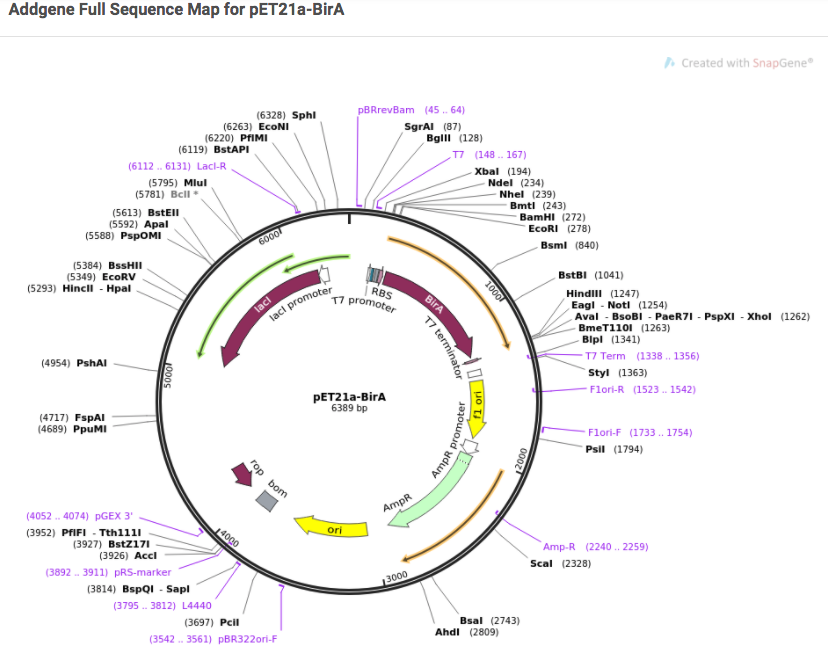
Primer design. Plasmid mapping. DNA sequence analysis. We all have our favorite tools for tackling these particular tasks, but they tend to be scattered about the internet. To help you keep your virtual molecular biology toolbox organized, today’s post features a list of free ...
We are excited to announce the fourth edition of our popular eBook, Plasmids 101, is now available!
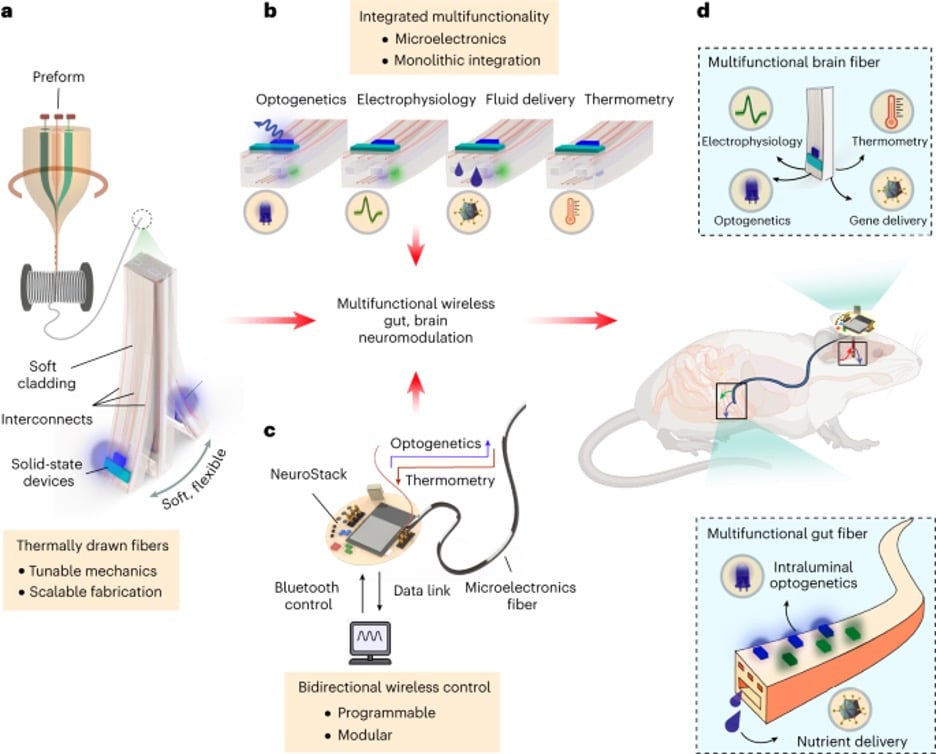
I often wonder about the gut-brain axis (admittedly for self-serving reasons – I want to understand my obsession with the combination of chocolate and peanut butter), but it’s an undeniably difficult connection to study on a molecular level. The brain is constantly influenced by ...
If you’re interested in learning a new skill, getting access to equipment you don’t have, or maybe both, a visiting scientist stint may be ideal for you. Here, we will chat about who might want to explore this role, how to seek out such an arrangement, and how to operate once in ...
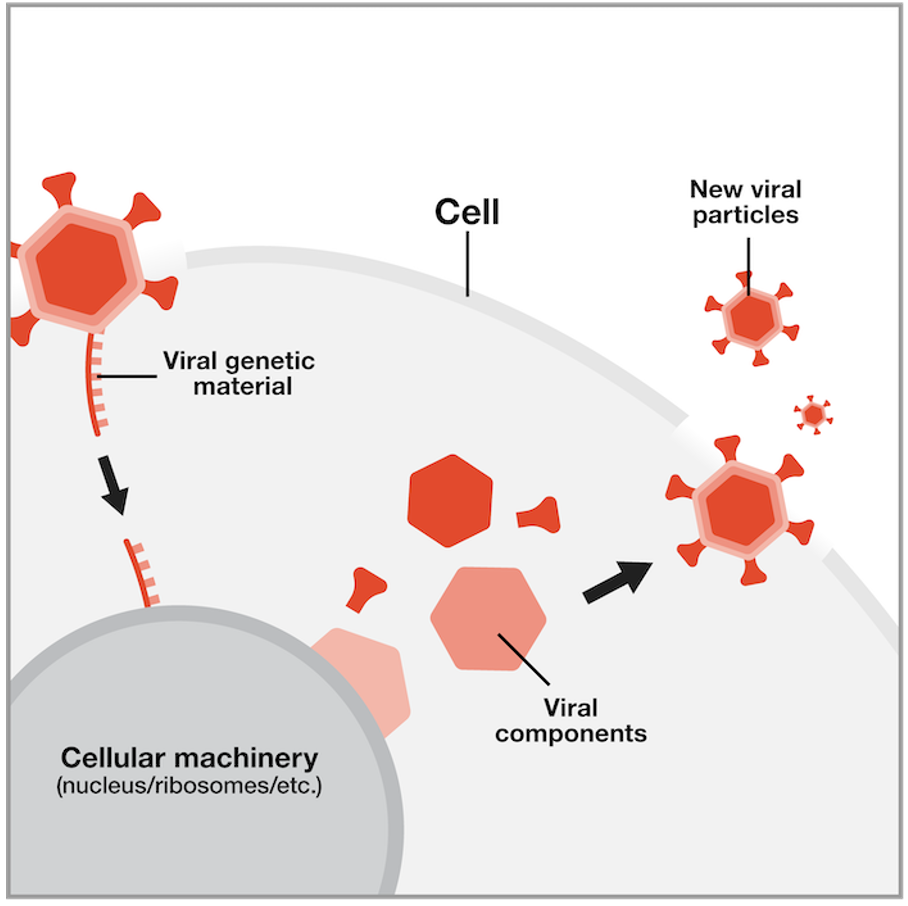
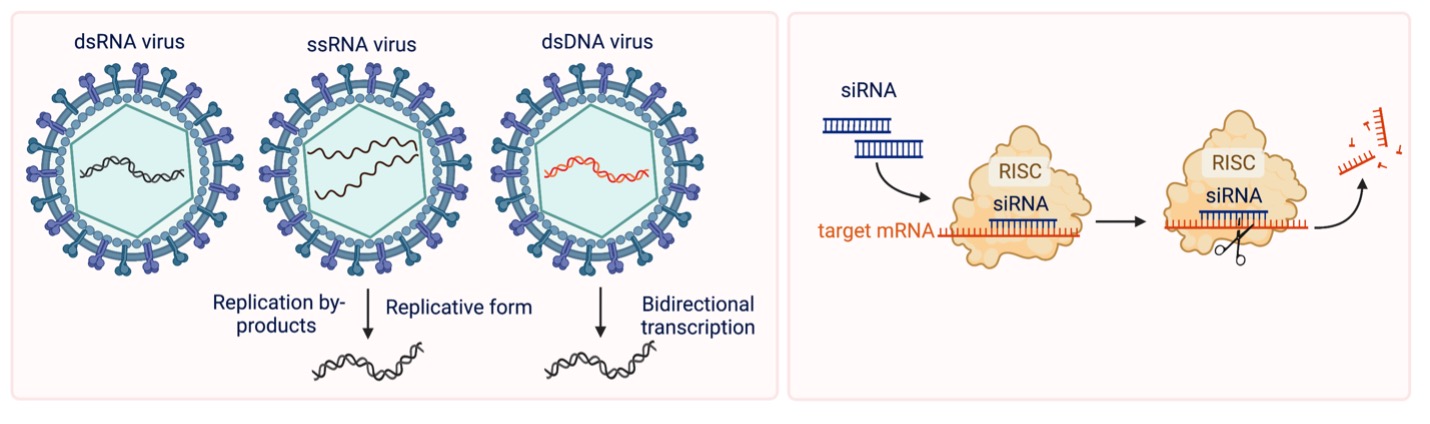
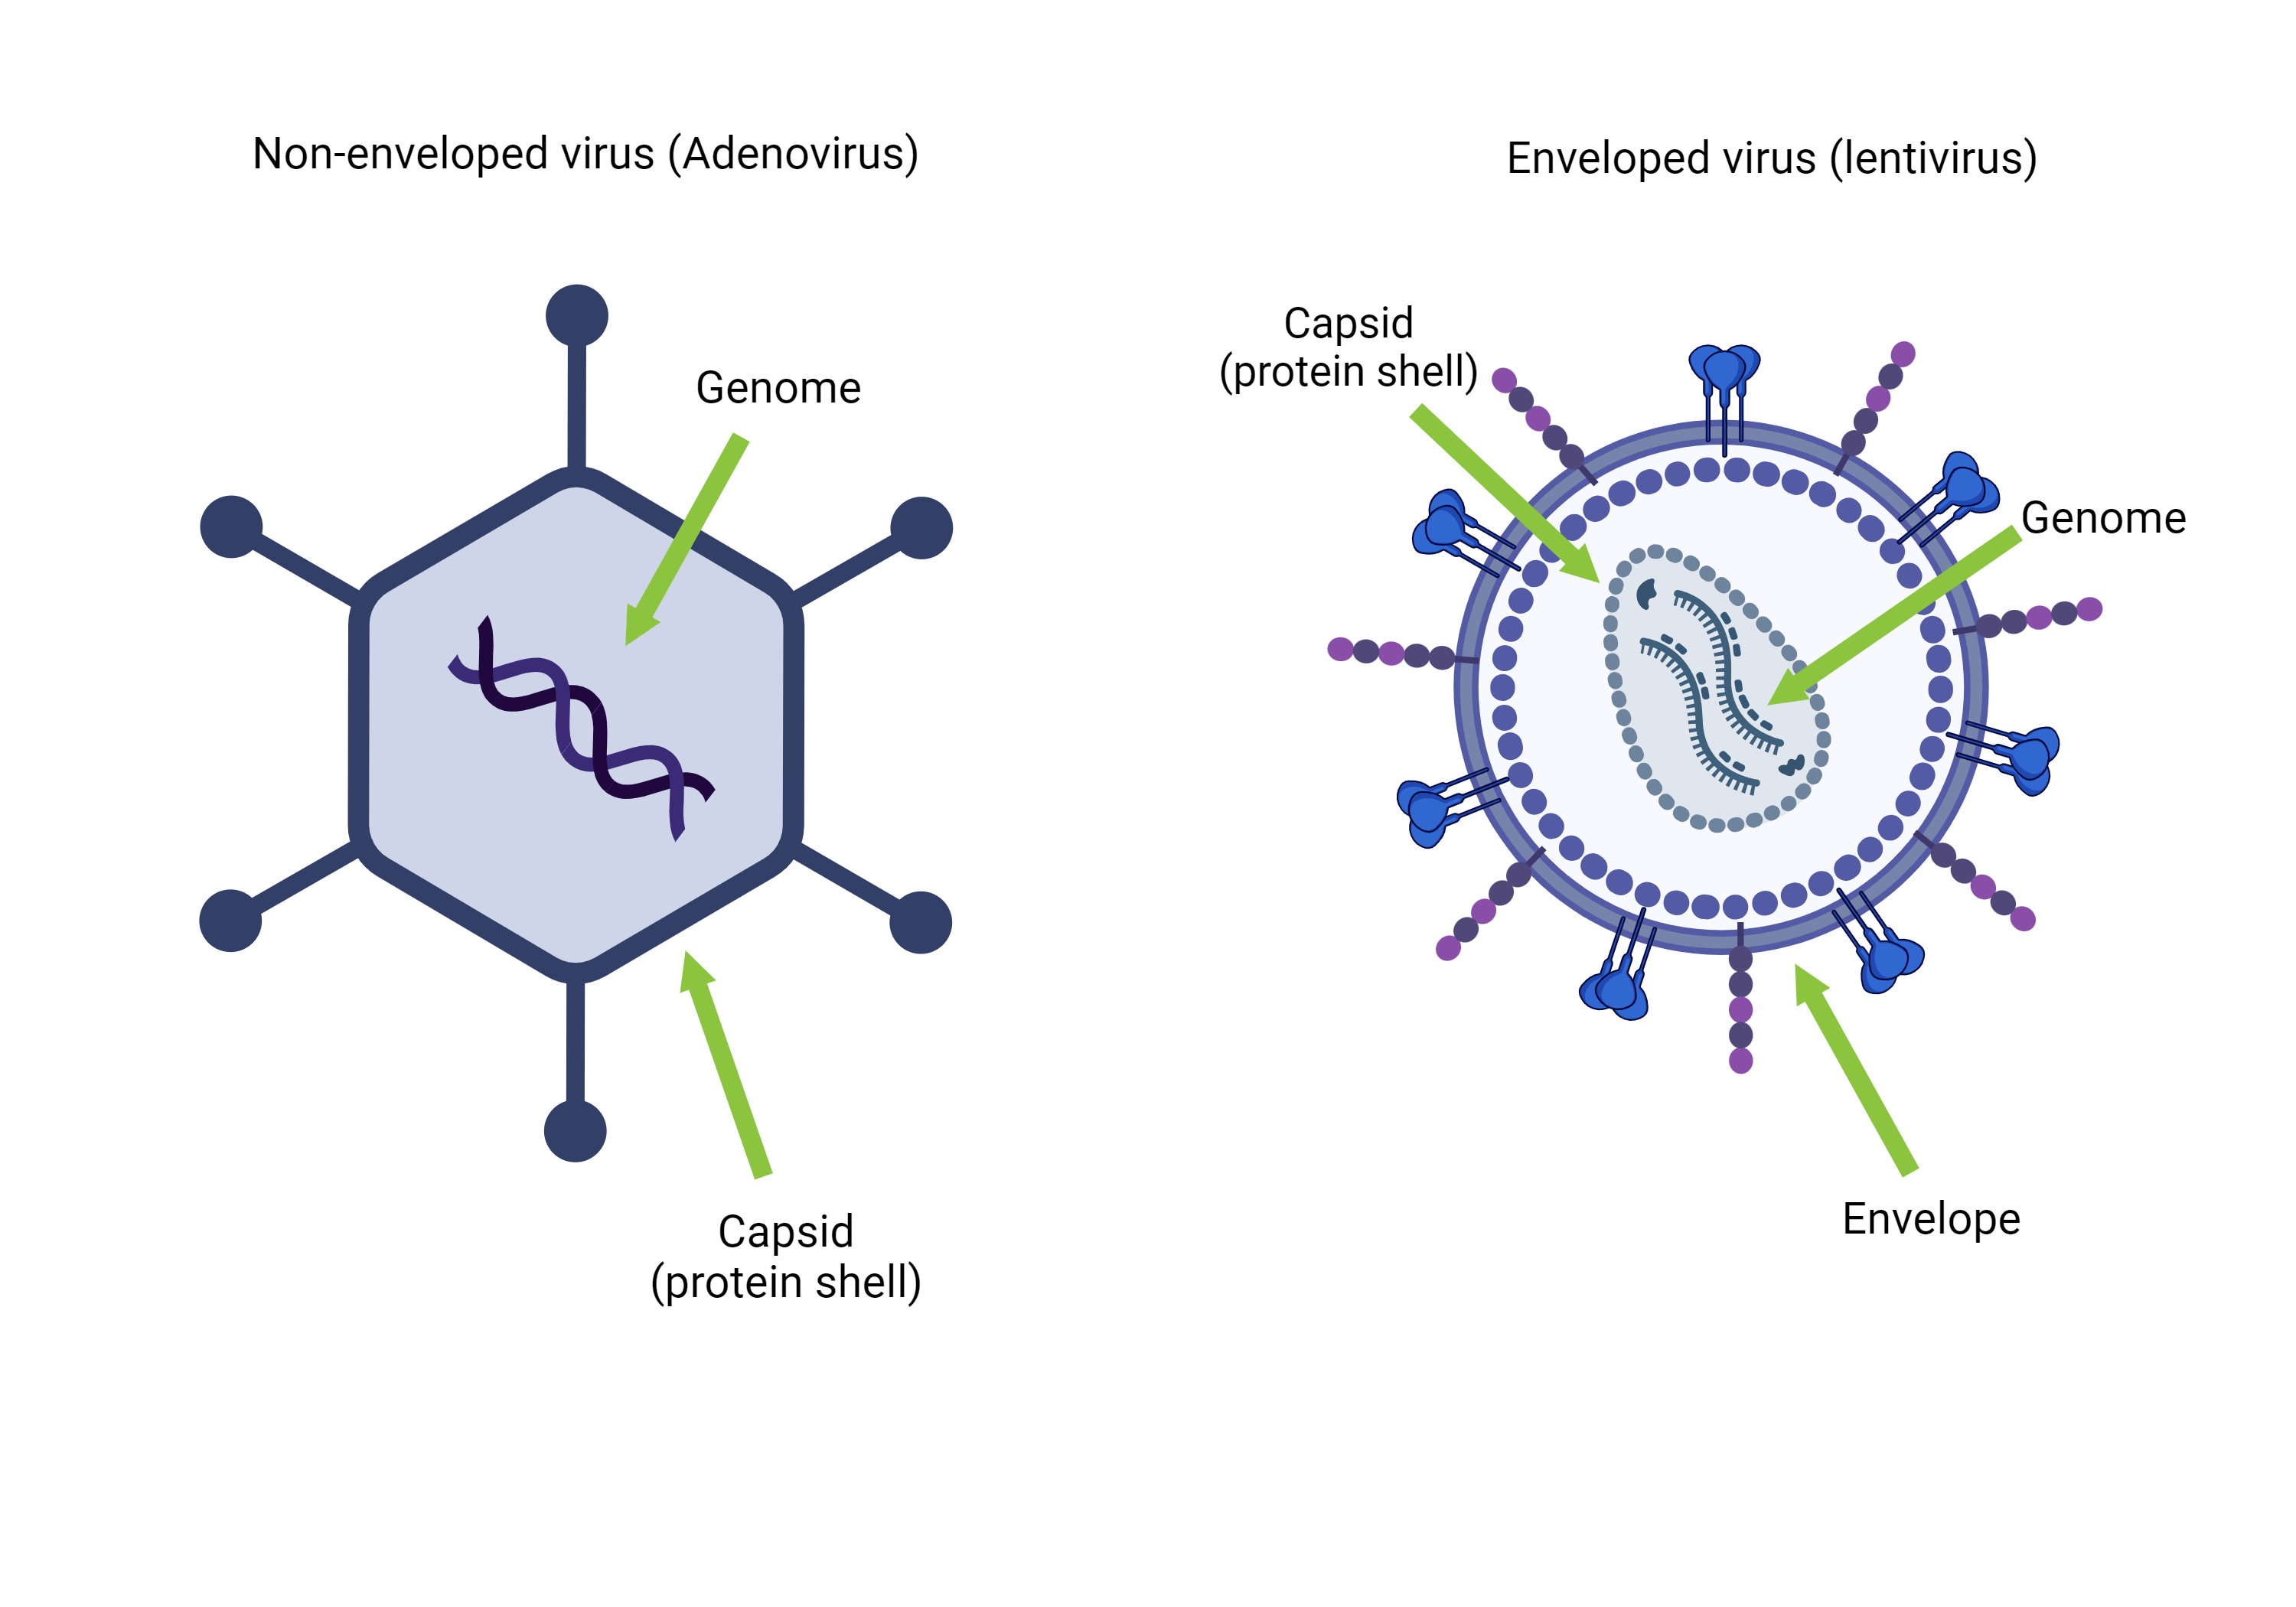
Viruses are simple: a genome packaged in a protein shell (Taylor, 2014). They’re so simple that we can’t even decide if they’re alive or not. Yet these simple, small particles have quite the outsized impact — and not just on the disease front.
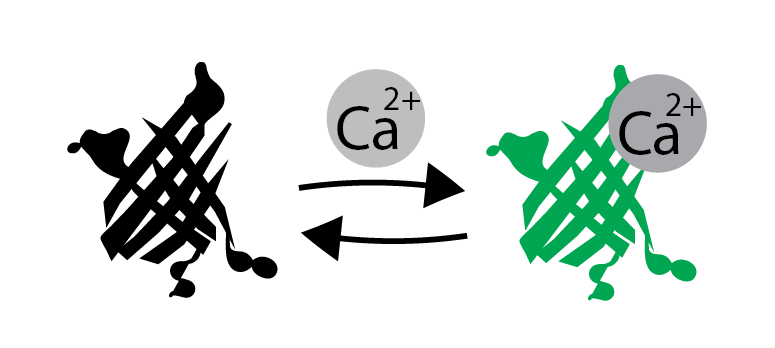
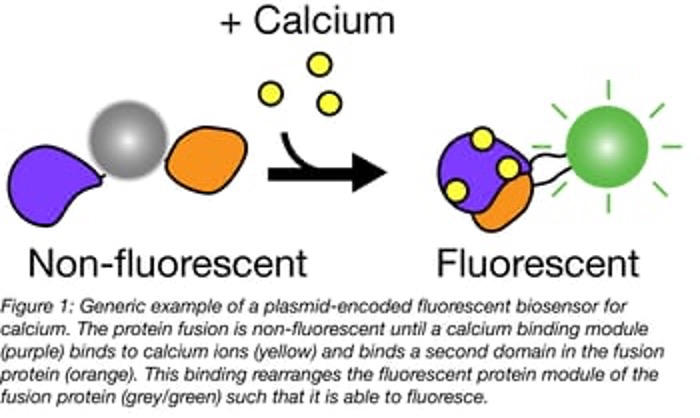
Calcium is arguably one of the most important metal ions in biology (sodium and potassium are up there too!). Calcium is fundamental to muscle and nerve function, hormone secretion, blood clotting, and as we all know, a structural component of bones and teeth. It is an enzyme ...
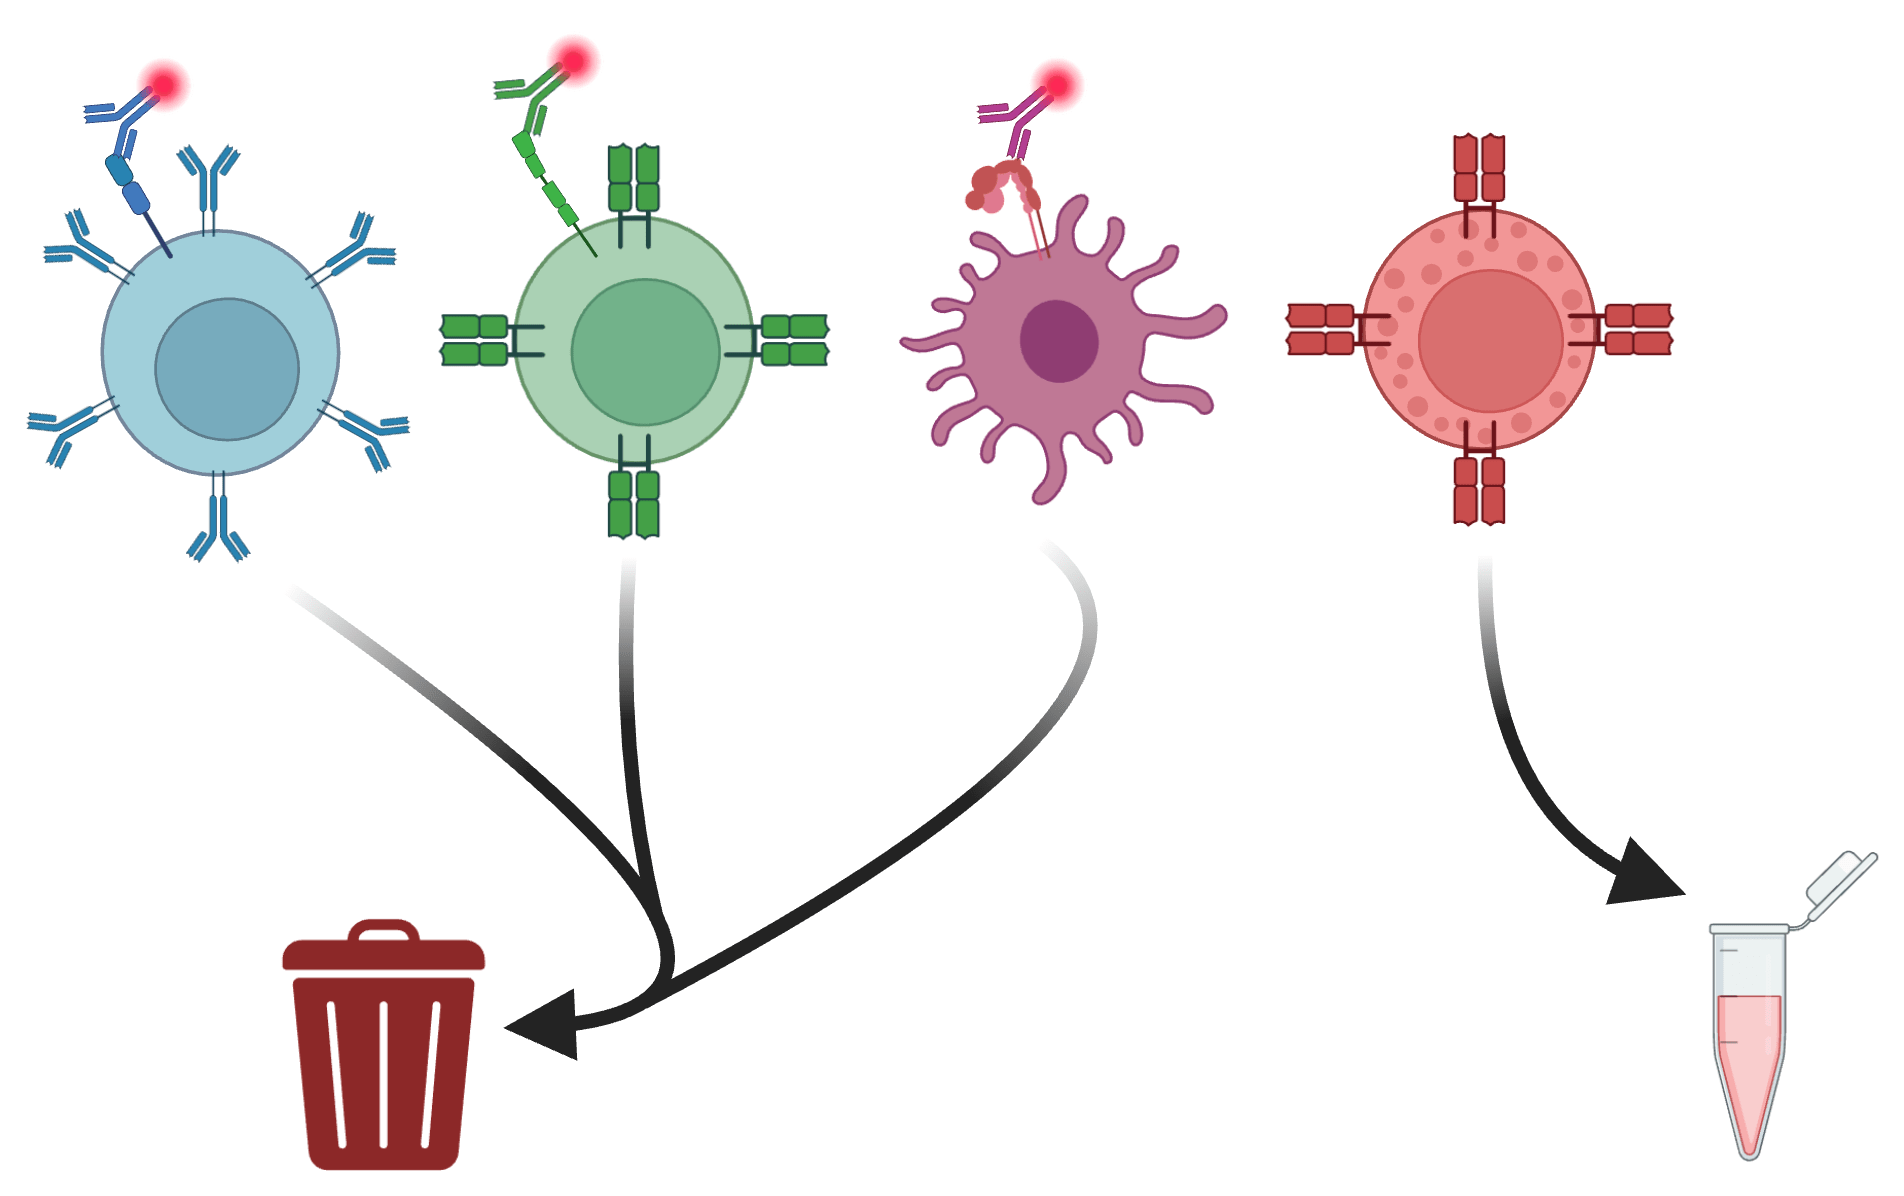
Flow cytometry is one of the most powerful tools available to immunologists, allowing for the rapid analysis of cell populations within a heterogenous tissue type, such as PBMCs or tumors, and moreso than other methods, the identification and isolation of rare cell types. In ...
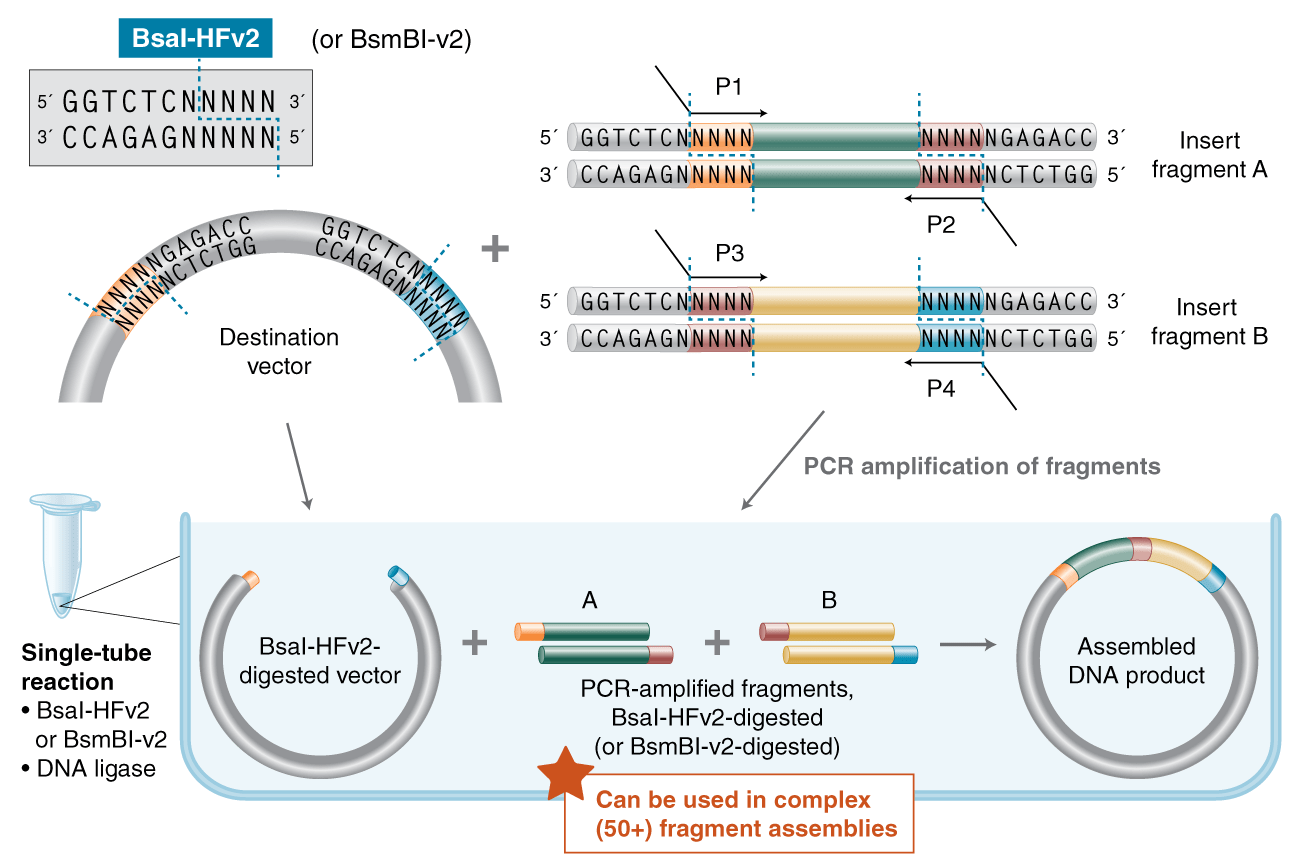
If you’ve ever used Golden Gate Assembly for cloning, you might be familiar with the rules of thumb for designing your overhang sets. But are those rules the best way to design GGA overhang sets, particularly for high-complexity reactions?
The Retroviridae (commonly called retrovirus) family — of which HIV is a member — may seem like an unlikely candidate to use as a viral vector, but retroviruses have been developed into some of the most widely used tools in molecular biology. “Retroviruses” is an umbrella term ...
For safety and production reasons, multiple plasmids with many components are used to package lab grown viruses. It can be intimidating at first to look at so many plasmid maps and protocols! In reality, there are many shared components across viruses (AAV, lentivirus, etc.) and ...
Erik Snapp just released version 3.4 of his eBook, How to Get a Faculty Position. This edition has substantial expansions on the chalk talks and Zoom interviews sections, along with new thoughts on research statements. Snapp, who is always looking for ways to improve his eBook, ...
If you’ve ordered a pooled library from Addgene, you may have been a little surprised at how this powerful tool is in such a small package. But don’t let the simple presentation deceive you; pooled libraries can be quite challenging to use! In this post, I’ll walk you through ...
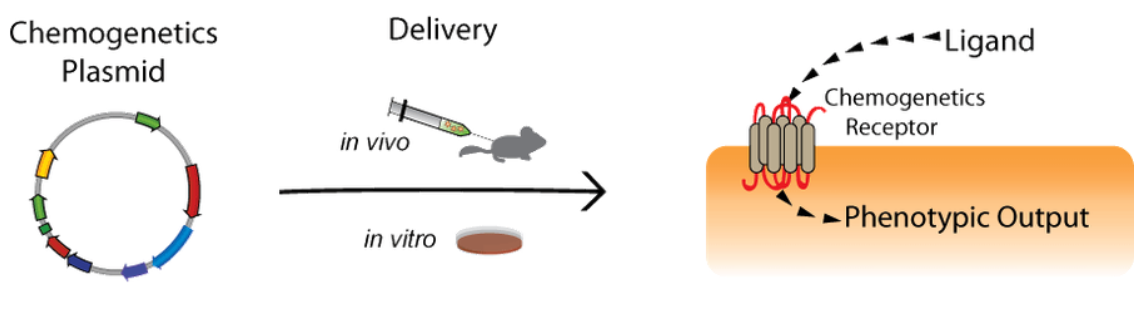
In order to understand the complex wiring of the brain and the underpinnings of neurological disease, neuroscientists need to be able to probe cells and circuits without disrupting normal brain function. Chemogenetics has become a popular tool in the field as it provides a ...
The calcium is strong here….I can sense it….sound like a plot to an biology scifi movie? Or maybe it’s a biosensor?! You can do more than just ‘sense’ biological compounds and reactions; you can quantify them with biosensors! In this blog we will review the basics of biosensors ...
As an undergraduate student at Northeastern University, I am required to complete a six month work experience called a co-op to receive a degree. Northeastern compiles a list of hundreds of different jobs for students to apply to, and after a grueling two months of job hunting ...
In 2005, Boyden et al. described the first light-activated tool for controlling neuronal activity, channelrhodopsin-2 (ChR2), a blue light-activated cation channel, from the archaebacteria Chlamydomonas reinhardtii. When exposed to blue light, this channel activates neuronal ...
Viruses have become a regular part of basic biological research as well as clinical therapy. These biological tools are useful because they’re derived from viruses that can infect people, cells, and animals. Some of these viruses are completely inert, but others can cause ...
Expansion Microscopy (ExM) promises an easier, more accessible way to image biological features previously only visible via techniques like super-resolution microscopy or electron microscopy. Since its introduction in 2015 by the Boyden Lab, ExM has been steadily growing in ...
If you study proteins, you’re probably quite interested in the canonical 20 amino acids. But in your quest to learn more about your protein of interest, you may find the available amino acids a bit…limiting. It may be time, then, to look towards genetic code expansion (GCE): ...
Addgene is excited to announce the launch of our partnership with the Institute for Protein Innovation (IPI). Together, we’ll be working to provide researchers with a collection of IPI’s well-validated and ready-to-use recombinant antibodies. The first collection, a set of ...
IBEX is a highly multiplexed tissue imaging method that uses iterative staining and chemical bleaching to allow for high-resolution imaging without degrading the tissue (Radtke et al., 2020, 2022). I do mean highly multiplexed: you can image over 65 different parameters using ...
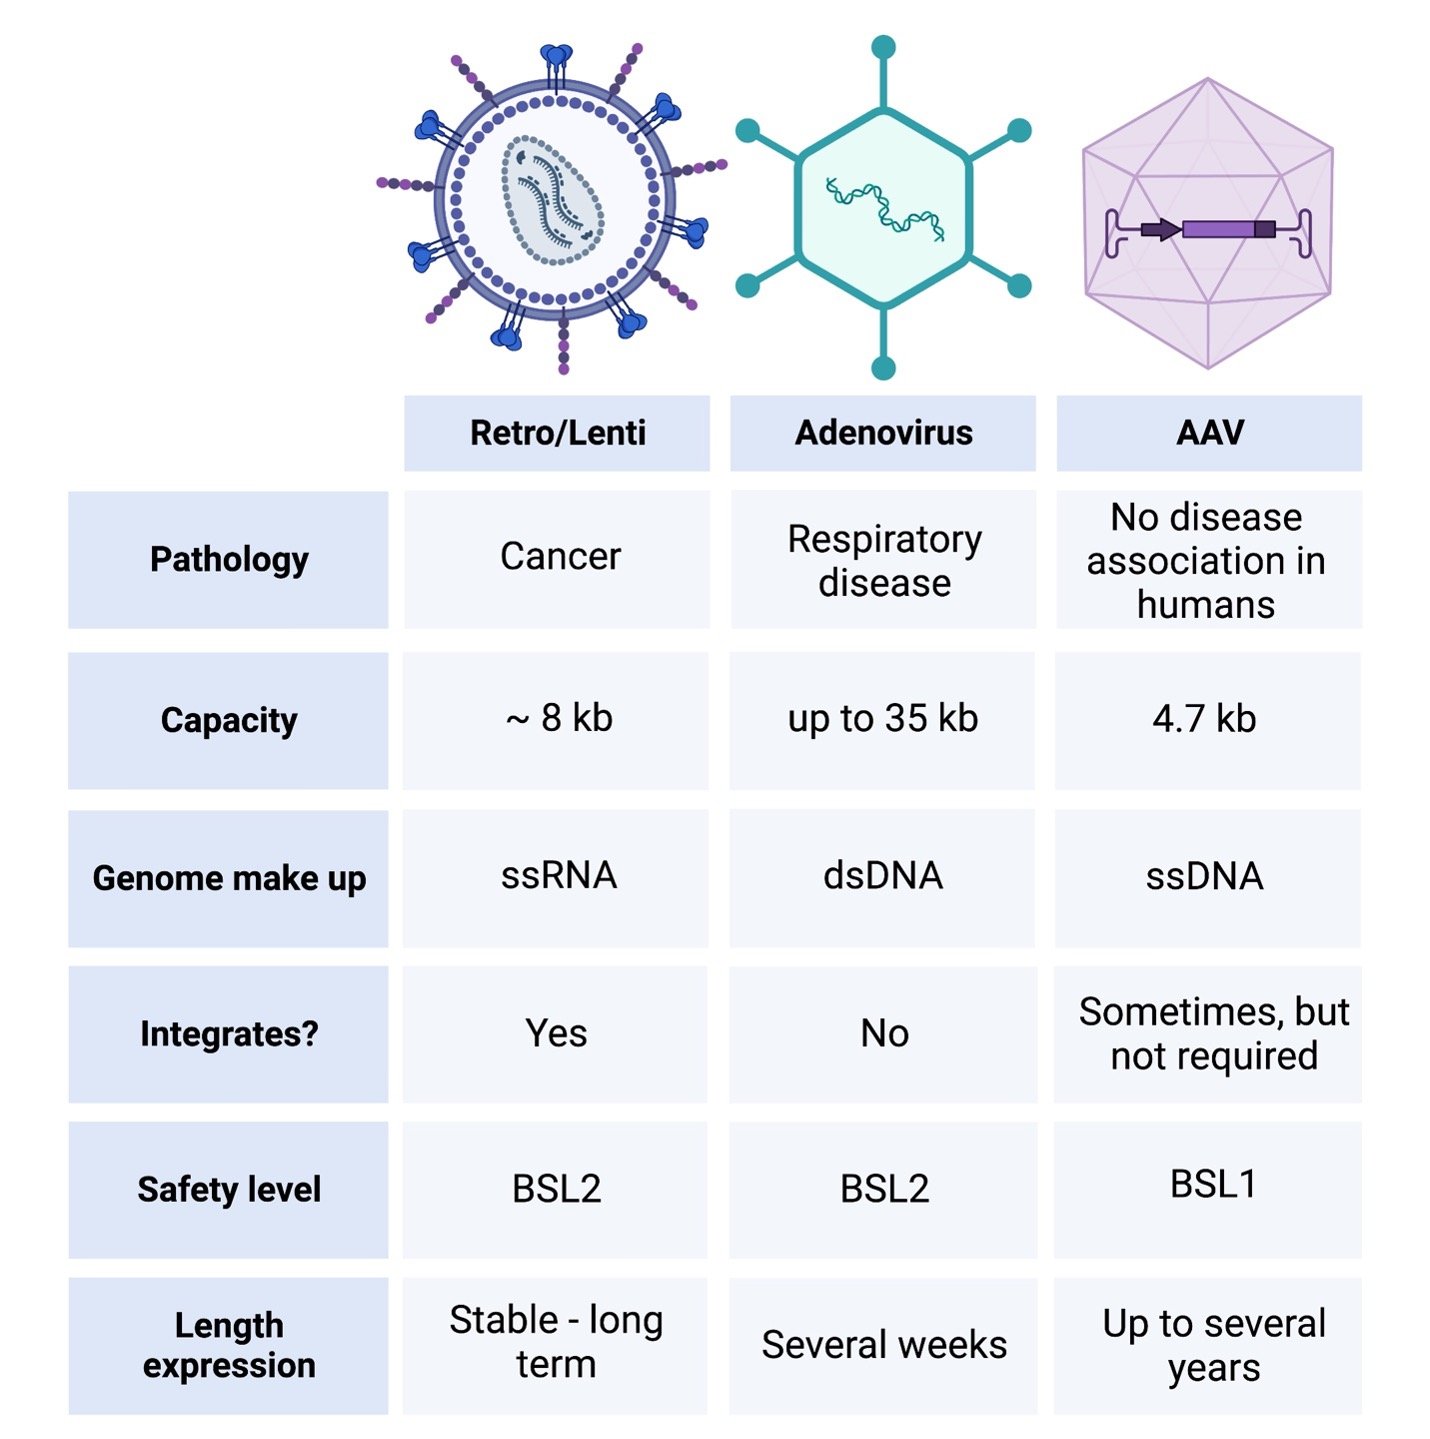
There are a lot of viruses out there – most of which we would all like to steer clear of! However, a subset of viruses are commonly used in the lab as tools and we all might benefit from getting to know them a little better. Here we will discuss the four most commonly used lab ...
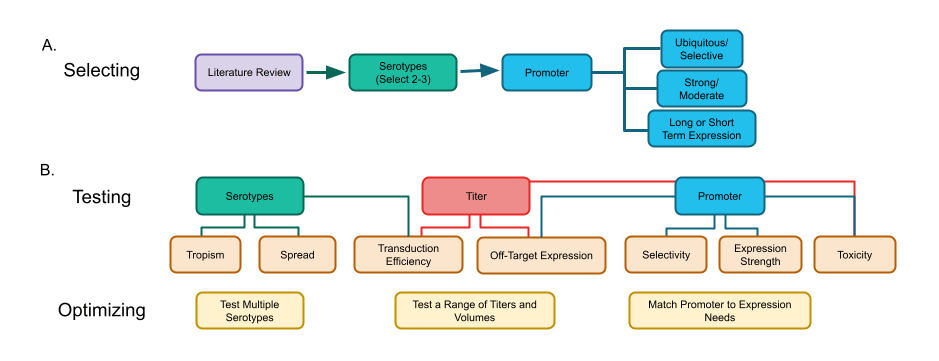
Using AAV vectors in complex biological systems can be tricky at best, and downright infuriating at worst. While it is tempting to just dive right in and start injecting your virus, a successful AAV experiment starts with validation and optimization. Although there are different ...
Adeno-associated virus (AAV) is a single stranded, Parvoviridae DNA virus, packaged in a non-enveloped icosahedral capsid, that can be used to express genes of interest in cell and animal models. AAVs are non-pathogenic, do not integrate into the host genome, and can be ...
Last summer, we posted about our bioinformatics quest, which led us to Seqera Labs, a company that provides open source workflow orchestration software for data pipeline processing (Nextflow), cloud infrastructure, and secure collaboration.
You may be familiar with immunofluorescence (IF, often referred to as immunocytochemistry (ICC) when the sample is cultured cells or immunohistochemistry (IHC) with tissues), where an antibody binds a target protein in your sample, then a fluorescently labeled secondary antibody ...
When it comes to using antibodies in the lab, we focus on a lot on the variable domain and not so much on the constant, or Fc, domain. Sure, we all know that the Fc domain provides structure, determines isotypes, and provides a place for secondary antibodies to bind. We also ...
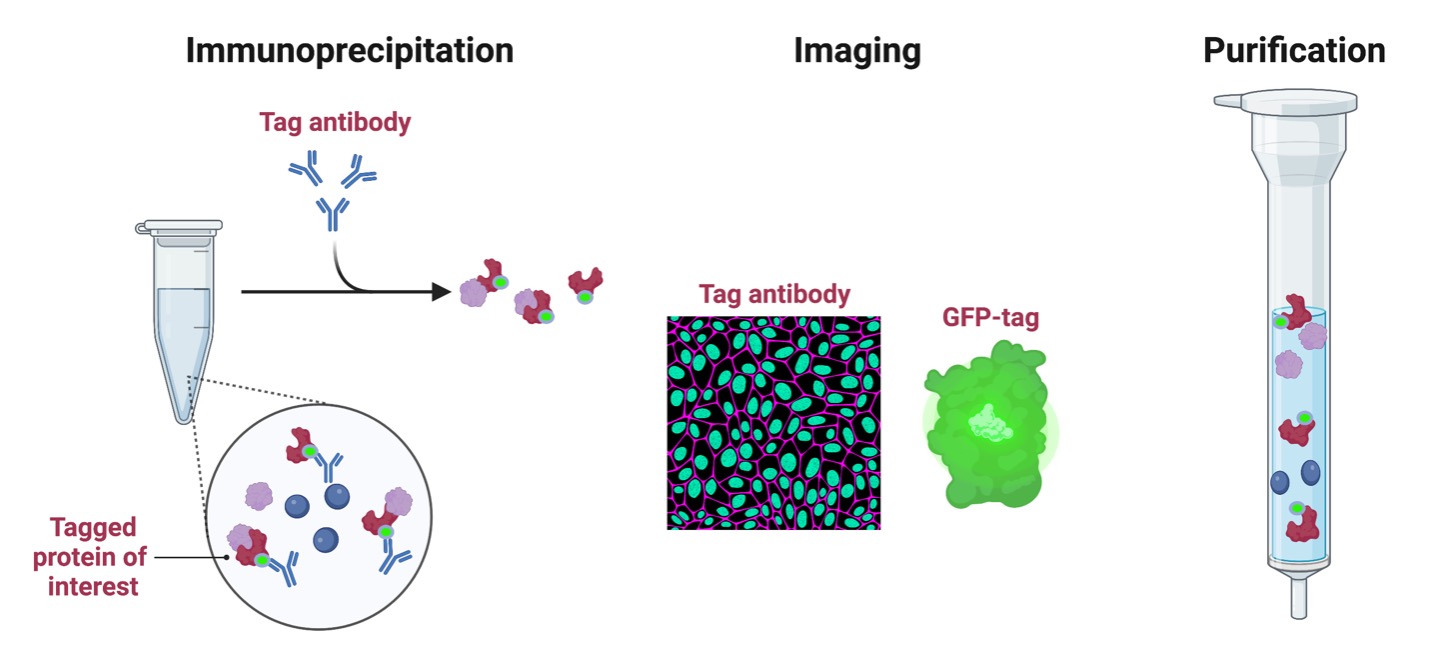
The stress of finding a ‘good’ antibody is something we’ve all experienced. Finding an antibody that works for your application, specifically detects your protein, is species compatible, and doesn’t come with a high background can be a huge challenge. Epitope tags eliminate the ...
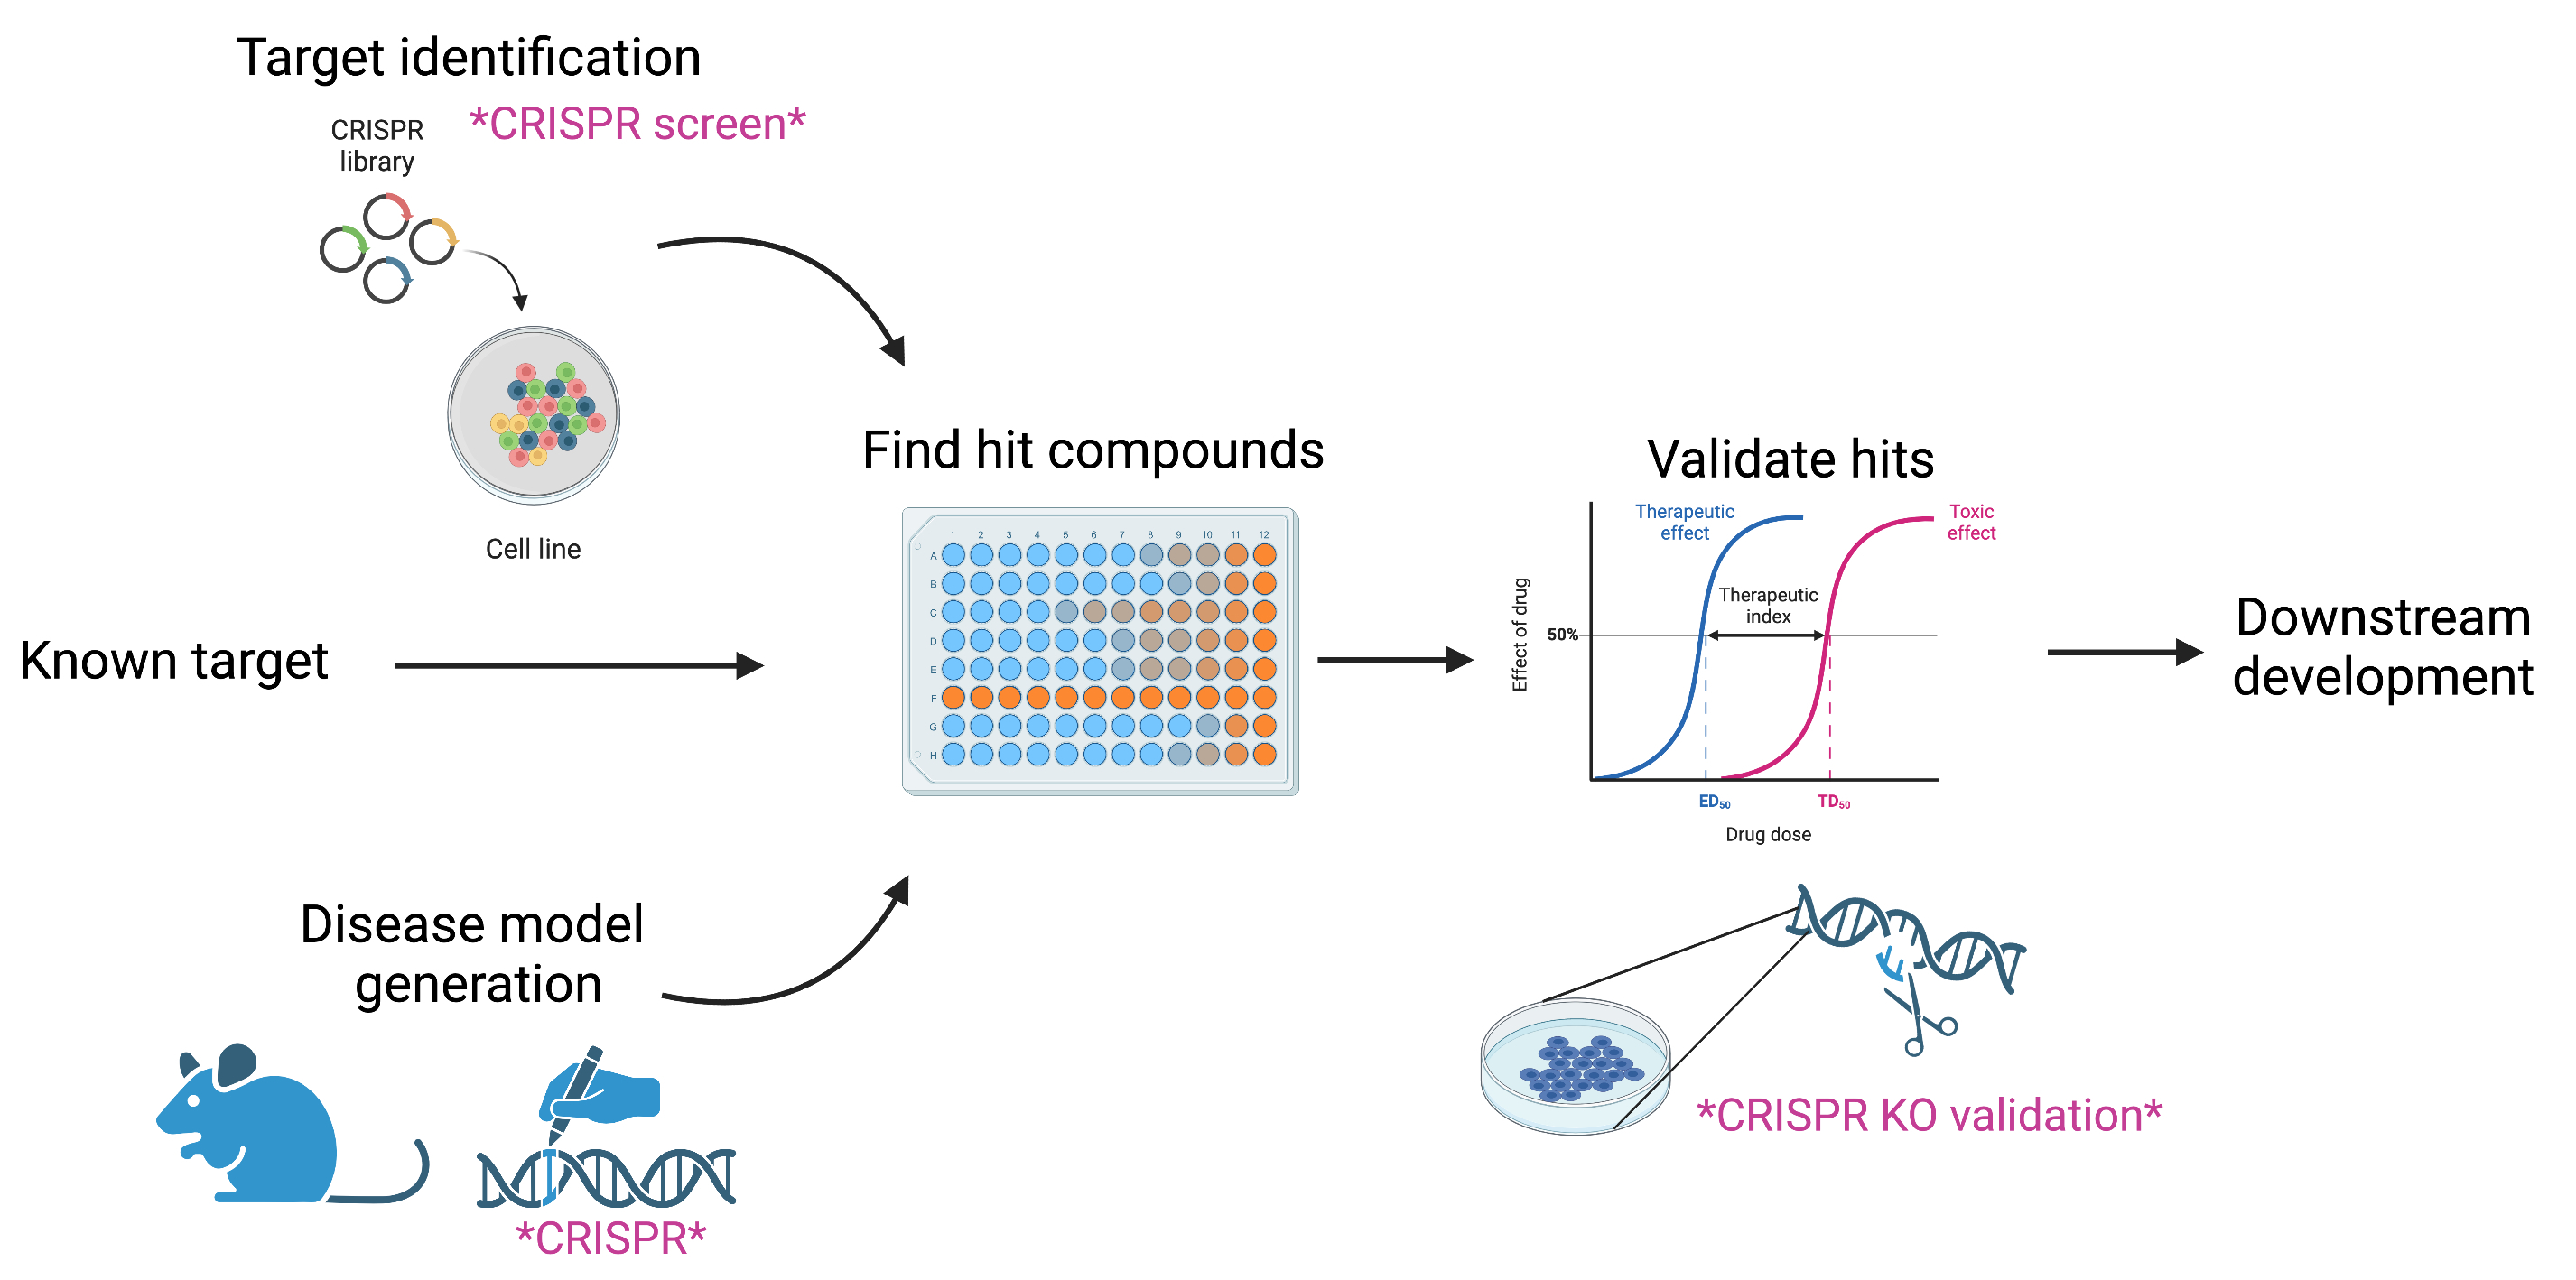
The biomedical field is often concerned with understanding the cause of diseases and how to treat those diseases. The “cause of disease” often requires understanding the disease genetics and the “treatment” usually requires drugs. While we often think of these two fields as ...
Around 20% of human genes have no known function or a poorly defined function (Wood, et al). In the microbial world, approximately 50% of predicted genes have unidentified roles as well (Vanni, et al). Is it true that this many genes are truly dispensable or are the current ...
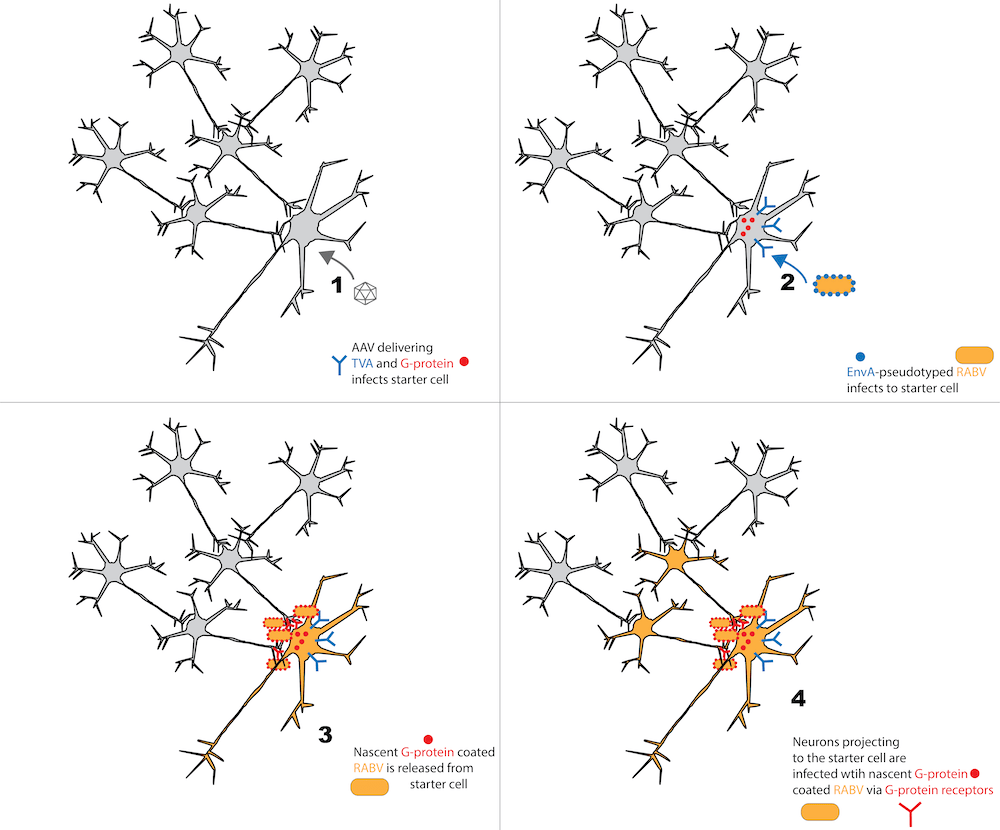
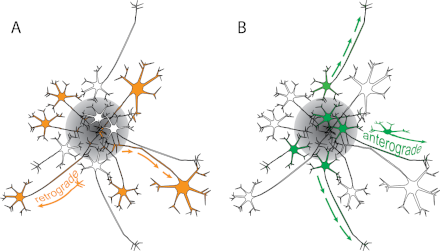
We often think about the brain’s function in terms of its regions. But equally important is the way the brain connects across these regions, a process driven by neurons. By studying how neurons are physically connected, we can begin to understand how the brain works. It’s kind ...
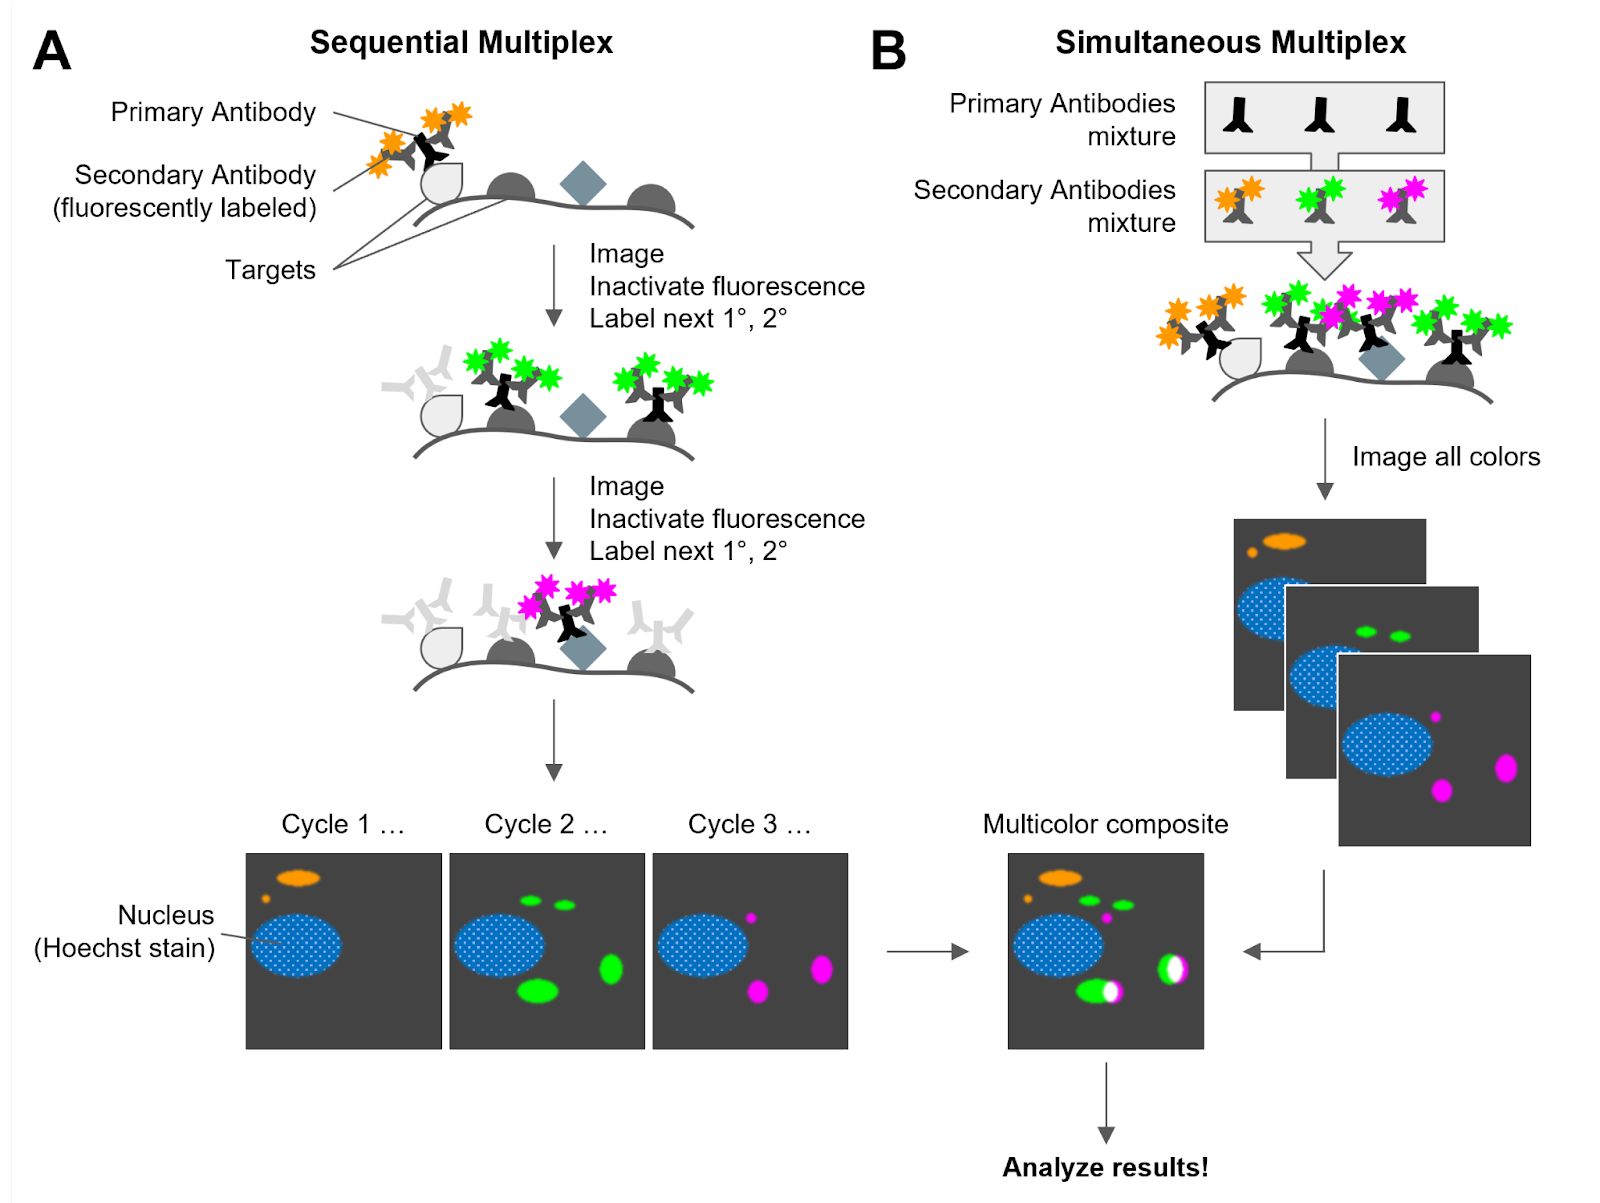
You are a scientist looking to determine how Protein A and Protein B interact. You read extensive research on the two proteins and come up with a great experimental plan that requires indirect staining of both targets in your specimen. You scour the literature and find an ideal ...
Public speaking is not just one of the most common phobias–it’s a key part of being a scientist and an incredibly useful transferable skill. Being able to stand up in front of an audience and convey your ideas clearly and strategically is powerful in almost any career. It allows ...
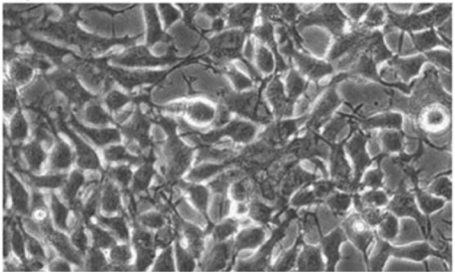
Ever wondered where human embryonic kidney (HEK) cells originated from? Or why they are such a commonly used cell culture model? In this blog we will spill the beans on all things HEK, from the first experiments isolating the cell line all the way to modern applications.
Viruses are the SUVs of molecular biology – they can deliver materials to specific destinations, haul a variety of cargo, and even handle a variety of terrains. They are, in fact, a choice delivery vector from basic science research all the way to clinical gene therapy. But how ...
I was excited to see that Addgene has recently added a new feature for depositing labs to its website, allowing depositors to download their plasmid request data, as a CSV file, anytime. The CSV is a rich source of information and has data on the date, material, requesting PI ...
If you are lucky in lab life, you will have a plethora of antibody options for your experiment (all well validated for your application, of course!) When the stars are aligned and the lab gods are smiling down at you, you may wonder which antibody should I pick? Do I go for the ...
We all know that yeast is a powerful eukaryotic model organism – its genome is easy to manipulate, it’s affordable, and it grows fast to boot. The yeast strains S. cerevisiae and S. pombe have dominated the research scene. But what about the other yeasts – in the biomedical ...
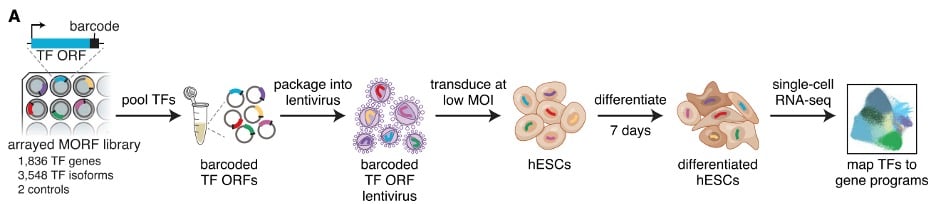
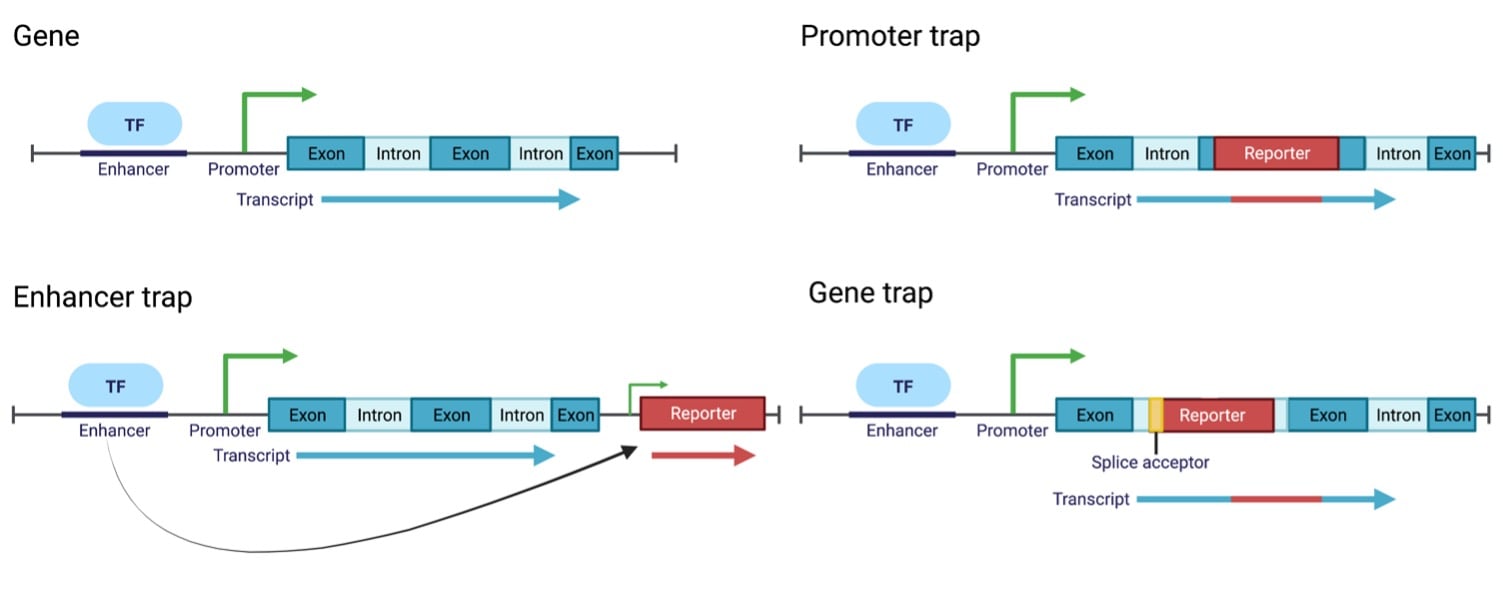
Transcription factors (TFs) act as the gate keepers for gene expression, turning transcription on and off by binding proximal to their target genes. Since gene expression patterns determine everything from stem cell differentiation fate to tumor suppression (and most everything ...
Running a Western blot can be a bit daunting for first-timers. That's why we gave our written protocol a video companion! Follow along as Addgenie Meghan and Abi run a Western blot and share tips for this tricky application.
This post was originally written by Jennifer Tsang and updated by Rachel Leeson. Have you ever wondered how long it takes to make a plasmid? Or how much time you have to spend cloning before you can start your experiment? What about all the reagents you need to order? Sometimes, ...
Viruses have many negative associations: common colds, COVID-19, norovirus (the stomach flu), and many more. Their infectious nature allows them to easily deliver their “cargo” to target cells and organisms, and when that cargo is designed to make you sick…well, you feel it. But ...
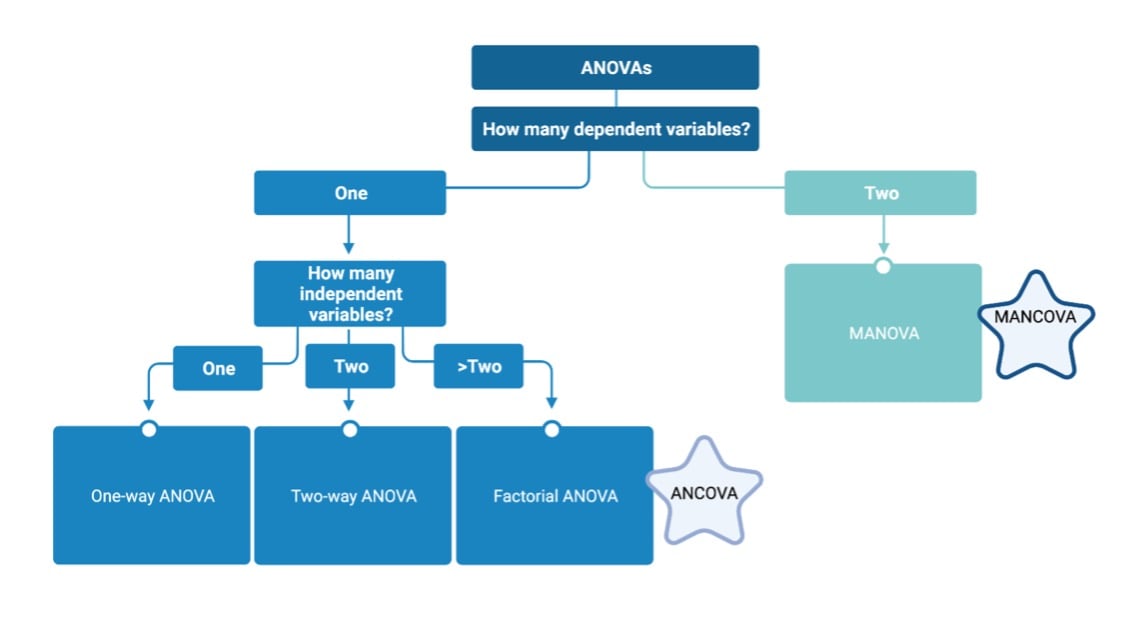
You’ve acquired your long-awaited data – and it looks great! There are some exciting trends in your experimental groups, but how do you determine if they deserve that oh-so coveted asterisk of significance? You’ve already done the heavy lifting, so don’t let the statistical ...
Much of today's biological research requires a close examination of specific proteins within a system. This can be pretty complicated given that a single cell has tens of thousands of proteins functioning in a variety of ways. How do scientists focus on the activity or function ...
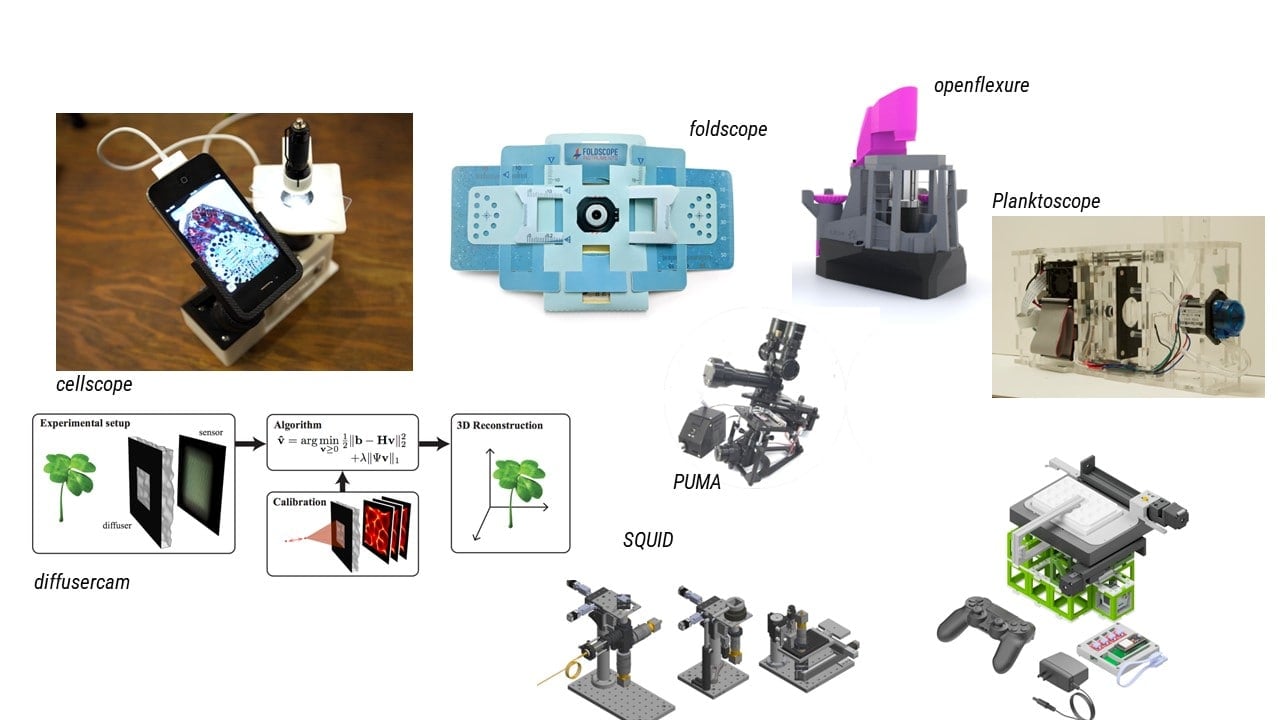
Since its early years, the light microscope has been a powerful tool in almost all disciplines. In biology, innovative new imaging approaches are constantly being developed which combine computational processing with biological protocols and revolutionary physical approaches. ...
Addgene saw big changes in 2022, from the launch of a new material to the redesign of a community resource. Now that we’re in the first quarter of the new year, I’d like to take a moment to reflect on our accomplishments from 2022 and share what we’re looking forward to in 2023 ...
This post was co-authored by Susanna Stroik and Rachel Leeson. Here at Addgene, we like to help share useful new resources with the scientific community – particularly ones that help address ongoing problems, like cells lines. A 2014 study in Science found that approximately ...
Turn it on? Turn it off? Turn it down, but not forever? You don’t need to resort to the force to control protein expression in mammalian cells: easy to use biological tools are abundant! In this post, we will review tried-and-true protein expression control tools as well as ...
When Karl Barry Sharpless was awarded this year’s Nobel Prize in Chemistry, he joined an elite club, becoming just the fifth repeat Nobel Prize winner in history. Interestingly, he also adds to the disproportionately large number of honorees to have trained under a previous ...
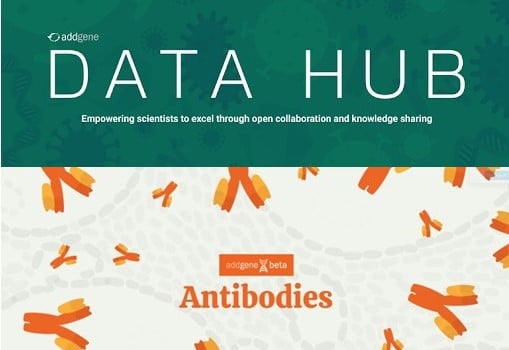
We're excited to roll out the redesigned, revamped, and re-launched Addgene AAV Data Hub, the place for scientists to share their AAV validation data. The Data Hub contains a curated collection of community submissions for Addgene and CLOVER AAV experiments - and we've updated ...
Transcription, translation, and prone to degradation – those are the words that describe RNA! Double stranded? Well, that’s just for DNA – right?
Every few months we highlight a subset of the new plasmids, antibodies, and viral preps in the repository through our hot plasmids articles. Think we missed something smokin'? You can pitch a Hot Plasmids section (antibodies and viral preps welcome!) here.


.png)


-min.png)


.png)

.png)
.png)
-min.png)
/Twenty%20Years%20of%20Addgene%20Accessibility/Blog%202023.png)
.png)
-min.png)

-min.png)
-min.png)


-min.png)


-min.png)


.jpeg)

.png)

-min.jpg)
-min.png)
.png)

.png)

.png)
-min.jpg)