Flow cytometry is one of the most powerful tools available to immunologists, allowing for the rapid analysis of cell populations within a heterogenous tissue type, such as PBMCs or tumors, and moreso than other methods, the identification and isolation of rare cell types. In recent years, full spectrum flow cytometry (“spectral flow”) has emerged as a particularly useful tool for those wishing to run larger panels: five laser spectral flow machines have 64 detectors, allowing for the use of up to 64 markers in a single panel! Although conventional flow cytometry and spectral flow cytometry are more alike than they are different, there are a few aspects in which spectral flow cytometry requires special considerations.
Conventional flow cytometry
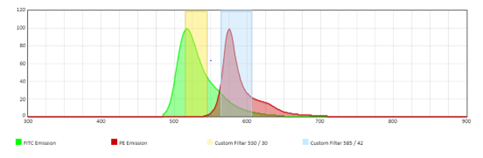
During conventional flow cytometry, light emitted by a fluorophore is guided to a single detector using a series of mirrors and filters. Importantly, conventional flow cytometry uses one detector to detect one fluorophore and therefore one cellular marker. However, emission spectra of certain fluorophores can “spill over” into detectors that are not the primary detector for that fluorophore. For example, in figure 1, the FITC signal is spilling over into the primary detector for PE. In order to correct for this, compensation has to be applied to “subtract” this spillover and correctly distinguish between markers. Additionally, since the emission spectra of the fluorescent molecules can be quite broad, detectors will usually only pick up a small portion of that spectra to use for compensation.
|
|
Figure 1: The emission spectra and filters for FITC and PE on a conventional flow cytometer. |
Spectral flow cytometry
Full spectrum flow cytometry, or “spectral flow” cytometry, on the other hand, utilizes the full spectrum of light to distinguish one fluorophore from another. Instead of using a single (primary) detector to identify a fluorophore, spectral flow cytometers use all detectors for all fluorophores. This allows for the creation of much larger panels, as fluorophores that cannot be distinguished using conventional flow can (sometimes) be distinguished using spectral flow since the machine uses the full spectral signature, not just a narrow band, to discern one marker from another.
Instead of compensation, which relies on user adjustment, spectral flow cytometry relies on “unmixing.” Unmixing uses a complex mathematical algorithm and single stained reference controls to distinguish one fluorophore from another within a fully stained sample.
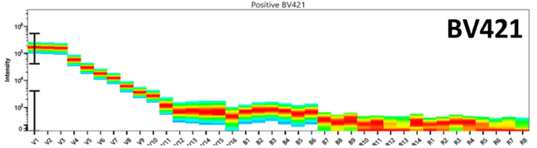
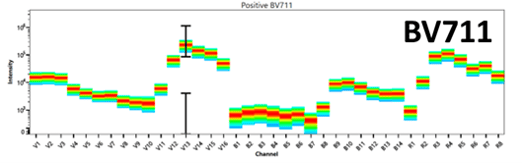
Figure 2 is an example of the emission spectra for two fluorophores excited by the violet laser, BV421 and BV711. These “rainbow box” plots are unique to spectral flow and can be thought of as a series of histograms flipped onto its side and compressed into a heat map. BV421 peaks in V1, with secondary peaks in V3 and V4, whereas BV711 peaks in the V13 channel, with secondary peaks in the R3 and R4 channels. These unique peaks in the spectra can be used to distinguish these two fluorophores from one another during spectral unmixing.
|
|
Figure 2: The full emission spectra for BV421 and BV711 on a 3 laser spectral flow cytometer |
Using spectral flow
When deciding whether to use conventional or spectral flow cytometry for a given experiment, it is important to consider how many parameters you want to use in a given experiment. For very large panels (upwards of 30-40 colors), spectral flow cytometry might be the better choice. Of note, there is no minimum number of markers that needs to be used with spectral flow—you can run a three color panel or a 40 color panel! When preparing a spectral flow experiment and panel, there are a few critical factors to keep in mind in order to get the best data possible.
Spectral flow allows for autofluorescence extraction
Cells produce a low level of fluorescence called autofluorescence (you can see this in your unstained flow controls). Spectral flow cytometers include a tool called “autofluorescence extraction” which allows the user to use the autofluorescence in a sample as a fluorescent marker. Given that the level of autofluorescence across various tissue types varies, it is critical to include an unstained sample for each tissue type you are running in your panel if you wish to use the autofluorescence extraction feature. Although autofluorescence extraction is an optional feature of spectral flow cytometry, it can greatly improve data quality, as it allows for better resolution of positive and negative populations,
Careful panel design
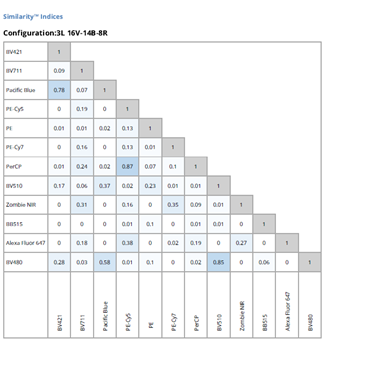
In both conventional and spectral flow cytometry, it is important to consider the expression levels of the markers you are including in your panel. Highly expressed markers should be paired with dimmer dyes so they don’t “wash out” the rest of the panel and create spreading error. Conversely, markers with low expression should be paired with brighter dyes, so they can more easily be detected. Cytek’s website has a convenient tool, called the similarity index, which allows the user to compare the emission spectra between all of the markers in the panel. This complexity index ranges from 0-1, with a value of “0” indicating those markers are completely distinct from one another, and a value of “1” indicating those markers are identical and completely indistinguishable. This tool is of particular value when designing a panel.
|
|
Figure 3: Similarity index across 12 different colors on a three laser spectral flow cytometer. |
Level of co-expression among cellular markers
You’ll also need to know if markers are co-expressed in your cells when designing your panel. If you have two highly overlapping cellular markers, it is important to pair them with two fluorophores that have distinct spectral signatures and a low similarity index. In figure 3, we can see that PerCP and PE/Cy5 have a similarity index of 0.87; therefore, two overlapping cellular markers should not be paired with these dyes, as this would create difficulty when trying to resolve those populations. PE/Cy7 and BB515, on the other hand, have a similarity index of 0, which would be a better choice for overlapping markers.

Compensation/reference control(s)
Compensation or “reference” controls are samples stained with a single fluorophore. They’re required for every fluorophore you use in your panel, whether it’s conventional or spectral flow. In spectral flow, reference controls tell the software to look for that exact signature within your fully stained samples.
If you are using conjugated dyes, it is critical that your controls and your sample antibodies are from the same batch, to avoid unmixing issues from batch-to-batch variation. Tandem dyes (two fluorescent molecules conjugated together) can be especially sensitive to batch effect. For example, when a PE molecule is conjugated with a Cy7 molecule, there is no telling exactly how many Cy7 molecules are added during that particular batch. This can present particular difficulty in unmixing if your sample is stained with a PE/Cy7 antibody from a batch that is not the same as your single color control.
Reference controls: Beads or cells?
Compensation beads are a convenient tool to obtain a strong positive signal for a given fluorophore, as they contain a mixture of beads that will either bind any antibody (positive population) or won’t bind anything (negative population). It is strongly recommended that when you first run a new panel on a spectral cytometer, you prepare reference controls of both beads and cells for a single fluorophore. Although compensation beads are convenient in that they provide a strong positive signal, even for rare cellular markers, beads can sometimes distort the fluorescent signature upon antibody binding, leading to discrepancies during unmixing. Additionally, it is critical to include unstained beads or cells within your reference group to ensure proper unmixing. This is because both compensation beads and cells will have a level of background autofluorescence that needs to be accounted for in order to distinguish the spectral signature of a fluorophore itself from the autofluorescence of the beads or cells.

Overall, spectral flow cytometry has the ability to generate incredible amounts of data from a single experiment. Although there are a few aspects of spectral flow that some users may find more difficult compared to conventional flow cytometry, there are many additional resources that can help ensure that your first spectral flow cytometry experiment is a successful one!
 Our guest author for this post was Lila Witt, a Ph.D. student at Mayo Clinic studying host-microbe interactions in early life.
Resources
More resources on the Addgene blog
Antibodies 101:Selecting the Right Antibody
Antibodies 101: Secondary Antibodies
Antibodies 101: Buffers, Storage, and Conjugates
Resources on Addgene.org
Addgene's Antibody Guide
Addgene's collection of ready-to-use recombinant antibodies
Topics: Antibodies


Leave a Comment