I was excited to see that Addgene has recently added a new feature for depositing labs to its website, allowing depositors to download their plasmid request data, as a CSV file, anytime. The CSV is a rich source of information and has data on the date, material, requesting PI & organization, and country. This information can be of personal interest to the depositor, but it can also be valuable data to share in grant proposals or to demonstrate impact in annual reports. While the raw data is, of course, interesting to parse through, aggregation of this information can provide valuable insight to the most requested plasmid, the number of requested plasmids, or trends of requests over time.
Visualizing the data
So, after downloading my plasmid request data, I started to explore how I could visualize the aggregated data. Plotting the data in interactive figures is a great step up, but I needed a way to show different aspects of the data simultaneously. That’s why I turned to dashboards. Dashboards provide information in a concise and clear way that is accessible by a wide audience. The dashboard that I made to display the data in the CSV file is open for anyone to use.
View the Addgene Plasmid Request Data Dashboard!
|
|
| Figure 1: The Addgene Requests Dashboard |
.png?width=700&height=498&name=Figure%201-min%20(2).png)
The dashboard will display the following items (Fig. 1):
- A row with four of the key figures
- Number of requests per reagents (as a horizontal bar chart)
- Number of requests per country (as dot plot)
- Number of requests per year (as a bar chart)
- A written summary of the data, including total requests, total countries represented by requestors, year of first reagent sent, year with most reagents sent, and the most recent full calendar year
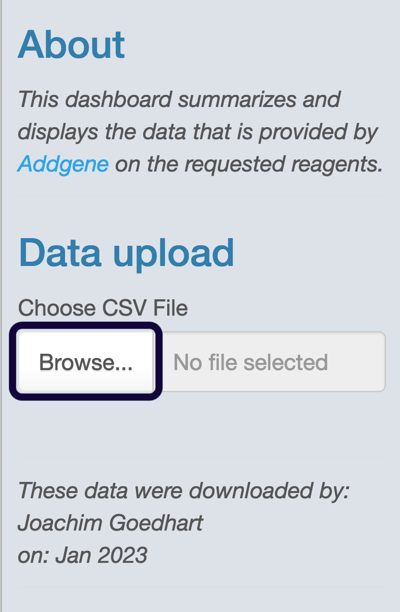
When the website is launched, it will show my data by default. Depositors can download their CSV file from Addgene by following these instructions, and then uploading the CSV with request data to the dashboard (Fig. 2).
|
| Figure 2: Insert showing the upload function for the Addgene Requests Dashboard |
After the upload, the name of the depositor and the date of downloading the CSV is shown (figure 2) and the dashboard displays the data in a standardized way. Since Addgene encourages the public sharing of aggregated data only, information on requesting PI(s) & organization(s) is not shown on the dashboard.
Key features of dashboards are (i) easy access to important numbers and trends, (ii) user interaction with the data, and (iii) the ability to easily update the dashboard at-will with new data. These features are incorporated in the current dashboard. The dashboard is coded in R Markdown and the source code is available in the Github repository (you can find the link in the upper right hand corner of the dashboard). Therefore, users with some knowledge of R can further customize the dashboard to their needs.
I hope you find the dashboard useful when analyzing and sharing your own depositor metrics!
About the Author
 Joachim Goedhart is an assistant professor at the Section of Molecular Cytology and Van Leeuwenhoek Centre for Advanced microscopy (University of Amsterdam). He develops, characterizes, and uses genetically encoded fluorescent probes. You can follow him on twitter: @joachimgoedhart.
Topics: Plasmids


Leave a Comment