You’ve acquired your long-awaited data – and it looks great! There are some exciting trends in your experimental groups, but how do you determine if they deserve that oh-so coveted asterisk of significance? You’ve already done the heavy lifting, so don’t let the statistical analysis of your data get you hung up. Here we will dive into the nitty gritty details of comparison statistical tests – when to use them, what they can tell you, and how to identify which one is right for you.
Statistics – The basics
Statistical analysis is what determines if there is statistical significance among data sets. Significance is a numerical value which quantifies the likelihood that a result is due to chance vs. the factor that is being experimentally manipulated. Below are several core factors of statistics relevant for many downstream statistical tests.
- Independent variables – factors which are not affected by other variables (cause).
- Dependent variables – factors which are affected by other variables (effect).
- Central tendency – mean, median, and mode give you a summary snapshot without telling you anything about outliers or data spread within those data sets.
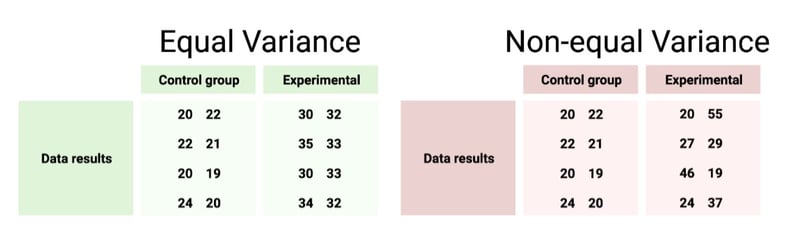
- Measures of dispersion – standard deviation/error, variance, data ranges. how closely data points fall to each other (see Fig. 1).
- Alpha values – numerical risk allowance in a statistical test.
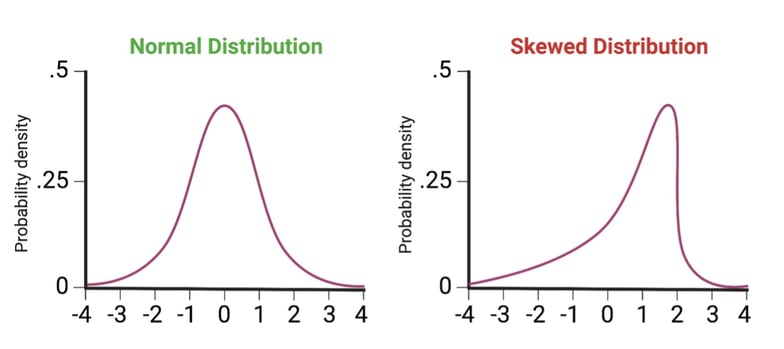
- Distribution - spread of data; typically, normal (bell curve) or skewed (see Fig. 2).
- Assumptions – characteristics of a data set; the ‘rules’ a statistical test assumes your data follows.
 |
|
Fig. 1: Examples of comparable groups with and without equal levels of variance among data.
|
|
| Fig. 2: Examples of data distribution profiles. |
Parametric tests
Statistical tests fall into two general categories: parametric and non-parametric. In this blog we will be discussing parametric tests. Parametric tests are suitable for data sets that “play by the rules” and which we have certain information about. The assumptions and requirements that need to be met for a parametric test are as follows:
Parametric test assumptions:
Distribution – Normal
Variables – Independent
Variance – Approximately equal
Data type - Quantitative
If your data doesn’t fit the requirements above, a non-parametric test may be the way to go, which we will discuss more in another blog.
T-tests
T-tests compare the mean of two groups to determine if they are statistically different. They are classic parametric tests and one of the simplest statistical tests available.
Tailed t-tests
If you are solely interested in whether or not two samples are statistically different than one another, a two-tailed test should be performed. This test will assess if the mean of an experimental group is significantly greater or lesser than the mean of a control group. If you only care if one group is different in a certain direction (i.e., you just want to measure if a sample is greater than a control), then a one-tailed test is suitable. Of course, a one-tailed test also works for exclusively less-than comparisons.
Paired and unpaired t-tests
Samples that come from the same subject or population - before and after a treatment, for example - should be analyzed with a paired t-test, because they eliminate subject-to-subject variation (the test assesses the sum of differences between pairs). Samples arising from different subjects or populations (a treatment group vs. a control group), on the other hand, should be analyzed with an unpaired t-test, which does account for subject-to-subject variation in its analysis (the test assesses the difference of the group means). Unpaired t-tests can also be referred to as two-sample or independent, but these designations all refer to the same test. On some occasions, there is an experimental group being compared to a standard value (not a control group). This situation is best served by a one-sample test as the standard value has no variation that needs to be accounted for.
ANOVA tests
ANOVA tests are essentially t-tests with room for more variables and groups. ANOVAs can test three or more groups (two samples and a control, for example) simultaneously, with up to two independent variables. This test will tell you if there are significant differences between the means of your groups. However, it will only tell you if differences exist somewhere within your data; it does not indicate which groups the differences exist between. For example, if an ANOVA analysis on a five-sample data set yields statistical significance, you won’t know if only two of those samples are different from each other, or if every permutation of pairs within the five is different. To identify significant pairings, additional tests, referred to as post-hoc analysis, must be performed. These will be discussed later.
One and two-way ANOVAs
ANOVA tests can compare either one (one-way ANOVA) or two (two-way ANOVA) independent variables on a single dependent variable. A two-way ANOVA could test the effect of temperature and humidity on an outcome such as total crop production, while a one-way ANOVA can test either the effect of temperature or humidity on crop production.
MANOVA
The MANOVA is a multivariate form of ANOVA. Isn’t that what a two-way ANOVA test is you might ask? Not exactly! A MANOVA test assesses the effect of two dependent variables on up to two independent variables. For example, a one-way MANOVA could test the effect of temperature on total crop production and the production window. A two-way MANOVA could measure the effect of temperature and humidity on total crop production and the production window.
Factorial ANOVA
This type of ANOVA assesses multiple independent variables on a single dependent variable. I know what you’re thinking – this really sounds like a two-way ANOVA. And this time, it is! Factorial ANOVAs include two-way ANOVAs but can include many more than two independent variables. For example, you could test the impact of temperature, humidity, sunlight exposure time, and watering volume on total crop production (though you would not be able to tell if the dependent variables worked synergistically, antagonistically, were additive, etc.).
ANCOVA and MANCOVA
All variants of ANOVAs discussed so far assume that the independent variables are independent of each other. That is, multiple independent variables are assumed to not have any effect on each other, they have discrete effects on the dependent variable, and those variables are the only things that matter. However, this is oftentimes an oversimplification. If your independent variables are affecting each other – or if you think they may be affecting each other – then a MANCOVA or an ANCOVA can measure this effect, known as covariance. This is the “C” that differentiates these tests from ANOVA/MANOVAs. Quantifying and controlling for any covariance between manipulated independent variables allows for a more accurate measurement of the effect on an outcome. These tests can also compare how independent variables you are not directly manipulating affect an outcome (age, demographic, diet, etc., in a cancer drug clinical trial, for example).
|
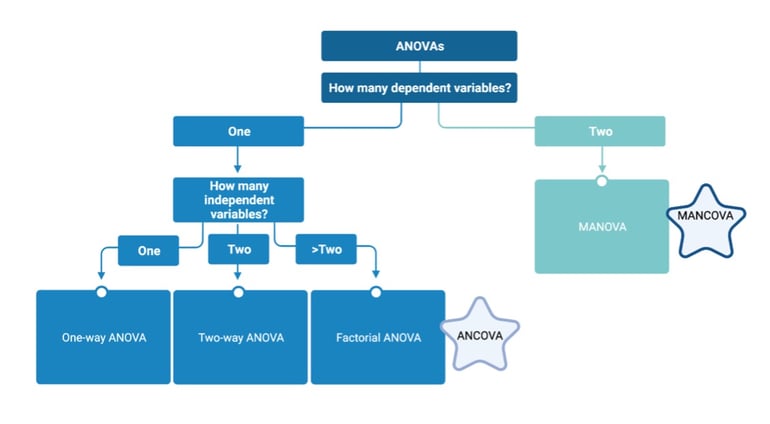
| Fig. 3: Question flowchart for choosing an ANOVA/MANOVA statistical test |
Post hoc tests
Knowing that significance exists somewhere amongst multiple groups is rarely enough information. A post hoc test, done after your initial analysis can provide information on specifically which groups are statistically different within your ANOVA/ANCOVA analysis. If you have performed a MANOVA/MANCOVA and want this information, multiple ANOVAs/ANCOVASs must be performed first, and then post hoc tests can be run on these tests.
All sample comparisons
Do you really need to know every pairwise comparison within your population? Sometimes this can’t be avoided, but if it can be, you can reduce the family-wise error rate by only performing the comparisons you really care about. Family-wise error is the probability of a false positive occurring when many comparisons are performed. For example, if your alpha is set at .05, then 5% of the time the statistical test will be incorrect. If you have 5 samples and perform every pairwise comparison (10 in total), your likelihood of a false positive is much higher than if you only look at 2 or 3 pairwise comparisons. Similar to family-wise error, is the false discovery rate which controls how many false positives are allowed relative to true positives. Both metrics can be used to reduce false positives within a test.
The Bonferroni Correction and the Benjamini-Hochberg procedure are designed to reduce false positive rates and control for large numbers of comparisons. The Bonferroni does this by establishing a significance threshold at a p value less than or equal to the alpha value divided by the number of null hypotheses. Benjamini uses a complementary approach which identifies a p value cut off. This method entails arranging all calculated p values from smallest to largest and ranking them (1 being the smallest value). It calculates the cut off for significance by finding the largest p value where its rank divided by the total number of comparisons performed multiplied by the alpha value is less than or equal to the p value. There are drawbacks to these tests as they can be quite stringent if many samples are assessed. However, if many comparisons need to be performed, Bonferroni and Benjamini will greatly reduce family-wise error and the false discovery rate, respectively.
Many other tests exist to identify significant pairwise combinations – Tukey’s test, Newman-Keuls, Duncan’s multiple range test, and several others. Each test has different likelihoods of returning false positives/negatives, but they all generally yield a similar result and are appropriate to use if all sample comparison is needed, without a high number of samples (~5).
Tukey’s test – Most conservative test. Higher false negatives, lower false positives.
Newman-Keuls method – More powerful. Moderate false negatives, moderate false positives.
Duncan’s multiple range test – Most powerful. Low false negatives, high false positives.
Control vs. all samples
Oftentimes there exists a control group and multiple experimental groups, with the only comparisons that matter being between control vs. experimental. In this case, save yourself from family-wise error and just perform the relevant comparisons using Dunnett’s test, a test that compares all groups to a single group. Dunnett’s is more powerful and has a lower error rate than the multiple comparison tests described above.
Violated assumptions and statistics
Statistical power, the ability to correctly identify true positives within a test, depends on the input data ‘following the rules’ of that test. All statistical tests have assumptions, many of which have been described in this blog. If your data does not meet the assumptions for the tests described above (normal distribution, equal variance, and independent variables), it’s best to find a test that does. If you perform a statistical test when assumptions are broken, you run the risk of higher error, both false positives and negatives (or, as the mathematicians say, Type I and Type II errors) and can lose a significant amount of power.
Not sure if your data meets the assumptions of parametric tests? If you aren’t sure if your variance is equal or unequal, an F-test of equality of variance can determine this for you. F-tests measure the variance between samples, and determine if there is a statistically significant difference in that variance. If you want to know type of distribution you are working with, graphing data with a histogram is sometimes sufficient to determine normality (or lack thereof). Alternatively, a Quantile vs. Quantile plot can determine if your data deviates from the norm. These plots essentially sort and plot your data in ascending numerical value relative to quantiles derived from a theoretical distribution. If your data is normally distributed, it will form (more or less) a straight line.
If your data does not fit parametric assumptions, then a non-parametric test is a better option. Stay tuned for our upcoming blog on non-parametric statistical tests!
Adding it all up
There are many, many statistical tests beyond the ones detailed in this article. These are just some of the most common parametric comparison tests along with some general statistics knowledge to have in your tool belt. To analyze your hard-earned data in the most effective and accurate way possible it’s important to select the right test for the job (and, uh, gentle reminder: keep your friendly neighborhood biostatistician happy by making your statistical analysis plan when you design your experiment, instead of after you’ve already run it.) You don’t need to be a mathematician to select the right statistical test, just do your homework and happy testing!
References
Wissing, Dennis R., and Timm, Donna. Statistics for the nonstatistician: Part I. South Med J., 105(3): 126-130 (2012). 10.1097/SMJ.0b013e3182498ad5
Curran-Everett, Douglas. Explorations in statistics: statistical facets of reproducibility. Adv Physiol Educ. 40(2): 248-252 (2016). 0.1152/advan.00042.2016
Finch, W. Holmes. Comparison of Multivariate Means across Groups with Ordinal Dependent Variables: A Monte Carlo Simulation Study. Front. Appl. Math. Stat. Volume 2 (2016). doi.org/10.3389/fams.2016.00002
Topics: Education


Leave a Comment