Here at Addgene’s headquarters, the skies are getting dark and wintry with the end of year approaching. We’re always looking for something to brighten our day, whether it’s memories of summer or just a bright new plasmid.
One area with lots of bright new plasmids is our Fluorescent Biosensors Collection — scientists are always coming up with new tools to measure their favorite targets and finding new targets to measure! Let’s take a look at some of the hottest fluorescent biosensors new to Addgene this year.
Feel the love with MTRIA sensors
One of the latest additions to Addgene’s catalog is a new class of sensors for neuropeptides and neurotransmitters. Motivated to develop a biosensor for oxytocin, Daisuke Ino and Hiroshi Hibino and colleagues devised a “Modular fluorescence unit fused with TRansmembrane region-to-IntrAcellular loop linkers” (MTRIA for short), where a fluorescent protein is inserted into one of the loop regions of any G-protein-coupled receptor (GPCR) recognizing a specific ligand (Ino et al. 2022). The oxytocin sensor MTRIAOT enabled real-time observations of oxytocin dynamics in live mice under a variety of behaviors, opening up new research directions that were inaccessible with earlier tools. They also produce more than 20 other MTRIA sensors based on GPCRs recognizing various neurotransmitters, neuropeptides and other ligands - almost A to Z! - from ATP to urotensin. The MTRIA sensors will be useful for investigating neuronal signaling and for engineering improved sensors for these and other targets.
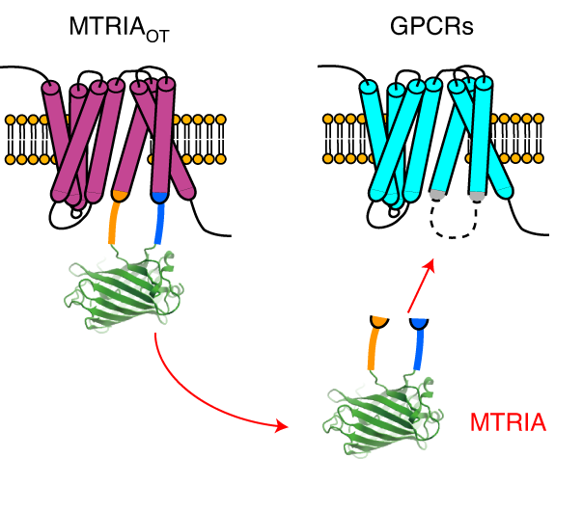
Figure 1: MTRIA biosensors are generated by inserting a circularly-permuted GFP into an intracellular loop of various G-protein-coupled receptors. Image adapted from Ino et al. 2022, under CC-BY license.
Ino D, et al. A fluorescent sensor for real-time measurement of extracellular oxytocin dynamics in the brain. Nat Methods. 2022 Sep 22. pii: 10.1038/s41592-022-01597-x. doi: 10.1038/s41592-022-01597-x.
New glutamate indicator iGluSnFR3
Improving on the glutamate sensor iGluSnFR from Loren Looger’s lab, Kaspar Podgorski and colleagues have now released iGluSnFR3 (Aggarwal et al. 2022). This new version has higher signal to noise ratio and is better localized for synaptic glutamate response. They generated variants optimized for different applications (v82 has higher affinity for glutamate but slower kinetics; v857 has faster kinetics but lower affinity) and with a variety of tags for localization (PDGFR, GPI, and SGZ). Read more from the authors in this blog post.

Figure 2: iGluSnFR3 displays enhanced brightness, expression, and sensitivity compared with earlier SF-iGluSnFR. Image from Aggarwal 2022.
Find viral prep here: pAAV.hSyn.FLEX.iGluSnFR3.v857.PDGFR.codonopt
Aggarwal A, et al. Glutamate indicators with improved activation kinetics and localization for imaging synaptic transmission. bioRxiv 2022.02.13.480251. doi: 10.1101/2022.02.13.480251
JEDI-2P voltage sensor
The François St-Pierre lab and colleagues have developed a new genetically-encoded voltage indicator (GEVI) called JEDI-2P (Liu et al. 2022) optimized for two-photon imaging. They use a unique and powerful high-throughput screen to select variants based on performance metrics specifically for two-photon microscopy. The resulting JEDI-2P has faster response kinetics and increased brightness, sensitivity, and photostability under two-photon illumination than previous GEVIs. Some constructs are also available as viral vectors (here and here).
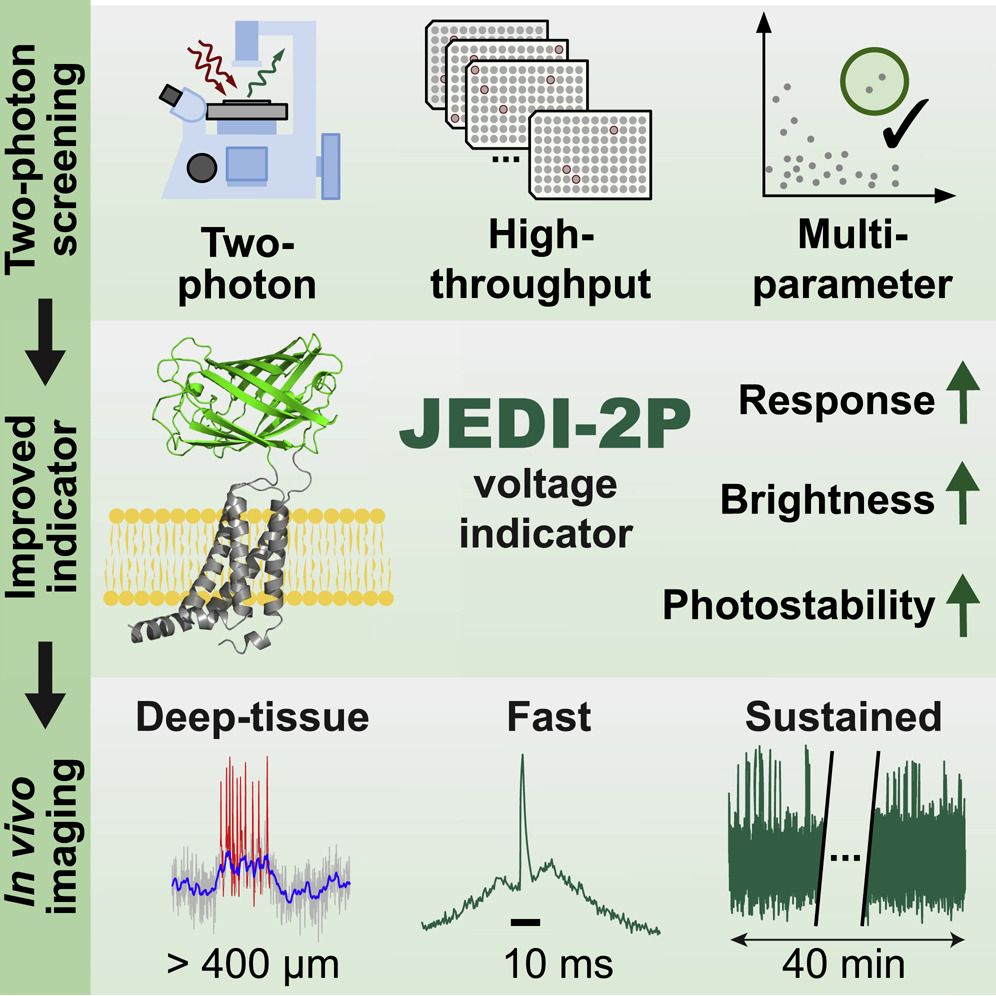
Figure 3: JEDI-2P was identified from a high-throughput screen, selected for increased voltage response, brightness, and photostability. It enables sustained deep-tissue imaging in vivo. Image reproduced from Liu et al. 2022, under CC-BY-NC license.
Find viral preps here: pAAV-EF1a-DIO-JEDI-2P-WPRE and pAAV-EF1a-DIO-JEDI-2P-Kv-WPRE
Liu Z, et al. Sustained deep-tissue voltage recording using a fast indicator evolved for two-photon microscopy. Cell. 2022 Aug 16. pii: S0092-8674(22)00916-3. doi: 10.1016/j.cell.2022.07.013
pYtags illuminate RTK signaling
Receptor tyrosine kinases (RTKs) are a major class of signaling receptors, but the options for measuring activity of specific RTKs are limited. In a new preprint, Jared Toettcher and colleagues describe pYtags, a modular system for monitoring specific RTK activation in vivo (Farahani et al. 2022). The authors take advantage of the SH2 domain of ZAP70 (ZtSH2) which binds only the phosphorylated state of an immunoreceptor tyrosinase-based activation motif (ITAM). By fusing ITAM to an RTK of interest and co-expressing a cytosolic ZtSH2 reporter, they observe fluorescence localizes to the plasma membrane only when the RTK is activated and the ITAM phosphorylated. To demonstrate that pYtags can be generalized to other RTKs of interest, they create sensors for FGFR1, EGFR and ErbB2. And orthogonal sensors with different ITAM/SH2 reporter pairs allow multiplexed measurement of different RTKs.
Although this sensor relies on a change in localization to the cell membrane and not a direct change in the fluorescent properties, pYtags are an appealing tool for monitoring RTK signaling.
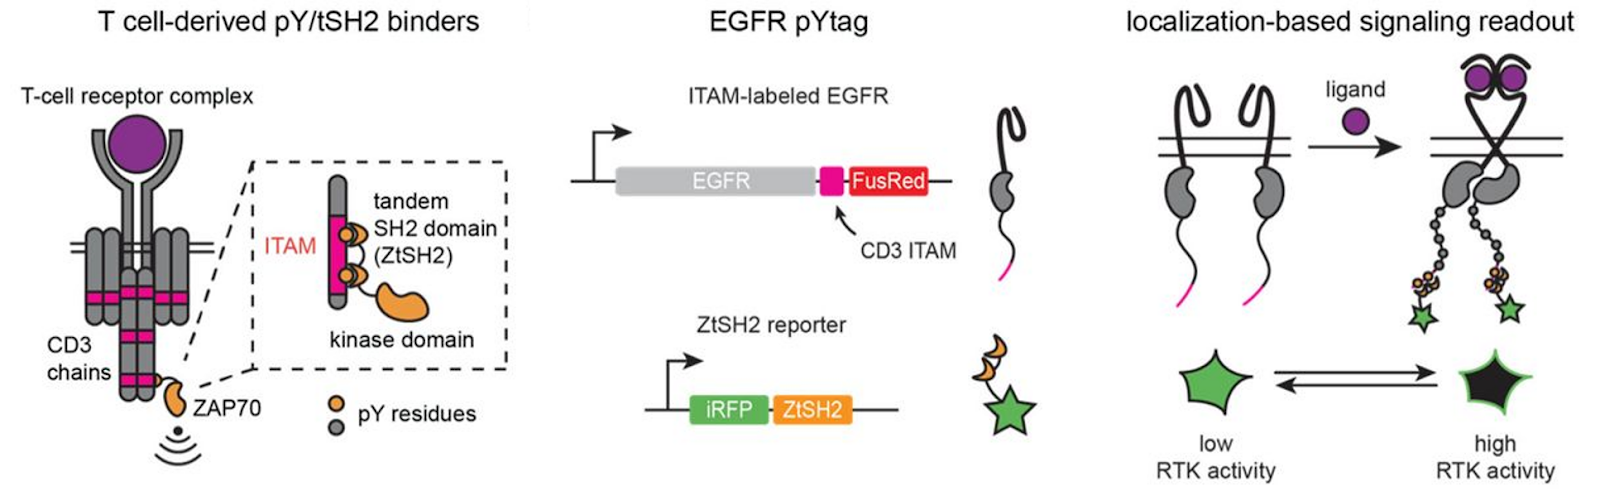
Figure 4: Design of pYtag fluorescent biosensors for monitoring RTK activation by shift in cellular localization. Image adapted from Farahani et al. 2022, under CC-BY license.
Farahani PE, et al. pYtags enable spatiotemporal measurements of receptor tyrosine kinase signaling in living cells. bioRxiv 2022.08.13.503850; doi: 10.1101/2022.08.13.503850.
iGECInano NIR calcium reporter
Near-infrared (NIR) fluorescent proteins promise better performance for in vivo use and deep-tissue imaging. Vladislav Verkhusha’s lab has generated a new genetically encoded calcium indicator using small monomeric NIR fluorescent proteins (miRFP670nano and miRFP720) and the Ca2+-sensing domain from Twitch-2B (Matlashov et al. 2022). iGECInano displays better response kinetics and photochemical characteristics than previous NIR calcium reporters iGECI and NIR-GECO2G, and its small size (~1500 bp) makes iGECInano suitable for AAV packaging.
Matlashov ME, et al. Design and Initial Characterization of a Small Near-Infrared Fluorescent Calcium Indicator. Front Cell Dev Biol. 2022 Jun 29;10:880107. doi: 10.3389/fcell.2022.880107.
KRaION potassium sensors
Whatever your analyte of interest, it’s important to choose a biosensor that has a binding affinity close to the range of concentrations expected in your samples. Higher affinity isn’t always better, especially if it means operating at the outer edge of the sensor’s dynamic range. With this in mind, Ed Boyden and colleagues set out to engineer a potassium ion biosensor with a binding affinity that is better-matched to the potassium concentrations in cells than existing sensors. Using genome mining and structure-guided engineering of potassium binding proteins, they developed a family of fluorescent potassium indicators with a range of binding affinities (Torres Cabán et al. 2022): KRaION1 and KRaION2 have Kd around 70 mM and 100 mM, respectively. Introducing mutations and using potassium-binding protein homologues from various bacteria led to sensors of intermediate affinities from 40 to 140 mM. These new designs greatly broaden the options for potassium biosensors and are a promising starting point for further engineering.

Figure 5: Structure-guided design and genome mining both led to new sensors with lower binding affinities to broaden the range of applications. Image reproduced from Torres Cabán et al. 2022, under CC-BY-NC-ND license.
Find KRaION and Kbp sensor plasmids here!
Torres Cabán CC, et al. Tuning the Sensitivity of Genetically Encoded Fluorescent Potassium Indicators through Structure-Guided and Genome Mining Strategies. ACS Sens. 2022 May 27;7(5):1336-1346. doi: 10.1021/acssensors.1c02201.
LiLac sensor for lactate
Stop and smell the flowers - or rather, the lactate! The latest biosensor from Gary Yellen’s lab is LiLac, a fluorescence lifetime sensor for lactate developed using a high-throughput multiparameter screen (Koveal et al. 2022). Lactate is a key metabolite in glycolysis, so this sensor will be a valuable tool to study cellular physiology and metabolism under various conditions. LiLac has improved response size and reduced sensitivity to pH and calcium compared to previous lactate biosensors, and its affinity is better-matched to cellular concentrations of lactate. The microfluidic screening platform developed here is also a promising approach for developing sensors for other targets.

Figure 6: A) Schematic of BeadScan platform for screening candidate biosensor variants for performance under two-photon fluorescence lifetime imaging. B) LiLac responses are highly resistant to pH changes. Image adapted from Koveal et al. 2022, under CC-BY license.
Koveal D, et al. A high-throughput multiparameter screen for accelerated development and optimization of soluble genetically encoded fluorescent biosensors. Nat Commun. 2022 May 25;13(1):2919. doi: 10.1038/s41467-022-30685-x.
Feel the heat with B-gTEMP
Measuring local temperature variations and heat transfer at the subcellular level requires a probe with fast kinetics and high signal/noise ratio. Here, Takeharu Nagai and colleagues present an improved genetically encoded temperature indicator B-gTEMP designed to meet those requirements (Lu et al. 2022). By fusing two bright fluorescent proteins with different thermal quenching rates (mNeonGreen and tdTomato), they produce a temperature sensor that significantly outperforms previous designs. B-gTEMP is excitable under blue light (470-495 nm) and is capable of local temperature sensing with sub-millisecond resolution and sub-degree temperature differences under a variety of imaging conditions (155 μs and <0.1 °C in optimal conditions). While B-gTEMP itself is a significant improvement over previous temperature indicators, it also demonstrates that taking advantage of fluorescence quenching properties is a promising strategy for developing future sensors.

Figure 7: B-gTEMP temperature-sensitive probe enables fast measurement of temperature and local heat transfer. Image reproduced from Lu et al. 2022, under CC-BY-NC-ND license.
Lu K, et al. Intracellular Heat Transfer and Thermal Property Revealed by Kilohertz Temperature Imaging with a Genetically Encoded Nanothermometer. Nano Lett. 2022 Jul 27;22(14):5698-5707. doi: 10.1021/acs.nanolett.2c00608.
Biosensors going viral!
In addition to the viral preps noted above for iGluSnFR3 and JEDI-2P, several biosensors already in our collection have newly-available AAV preparations added this year. We’ve added new viral preps of the dopamine sensor dLight1.2 and voltage sensor Ace2N and additional GCaMP6 constructs:
- pAAV-CAG-dLight1.2 (AAV1)
- pGP-AAV-syn-FLEX-Ace2N-4AA-mNeon-ST A122D WPRE (AAV1)
- pAAV-hSynapsin1-axon-GCaMP6s-P2A-mKate2 (AAV9)
- pAAV-hSynapsin1-GCaMP6s-P2A-mKate2 (AAV9)
- pAAV-hSynapsin1-GCaMP6s-P2A-mRuby3 (AAV9)
- pAAV-CAG-SomaGCaMP6f2 (AAV9)
Plus, additional AAV serotypes of the most recent jGCaMP8 calcium sensors:
- pAAV-hSynapsin1-axon-jGCaMP8s-P2A-mRuby3 (AAV1)
- pGP-AAV-syn-jGCaMP8f-WPRE (AAV Retrograde)
- pGP-AAV-CAG-FLEX-jGCaMP8m-WPRE (AAV Retrograde)
- pGP-AAV-syn-FLEX-jGCaMP8m-WPRE (AAV5)
There are hundreds of other biosensors in Addgene’s catalog — from the recently developed to the tried-and-true classics. Check out our Biosensors Collection and Viral Service pages to find more. We hope these tools will be useful in your future research, and we’re looking forward to even more innovation next year!
Did we miss any? Let us know about your favorite new biosensor plasmids in the comments below!
Additional resources on the Addgene blog
Resources on Addgene.org
Topics: Fluorescent Proteins, Fluorescent Biosensors, Fluorescent Imaging, Neuroscience Biosensors


Leave a Comment