Master plasmid fundamentals, CRISPR techniques, AAV serotype selection, and antibody applications. Written by scientists, for scientists.
Subscribe
Running a Western blot can be a bit daunting for first-timers. That's why we gave our written protocol a video companion! Follow along as Addgenie Meghan and Abi run a Western blot and share tips for this tricky application.
This post was originally written by Jennifer Tsang and updated by Rachel Leeson. Have you ever wondered how long it takes to make a plasmid? Or how much time you have to spend cloning before you can start your experiment? What about all the reagents you need to order? Sometimes, ...
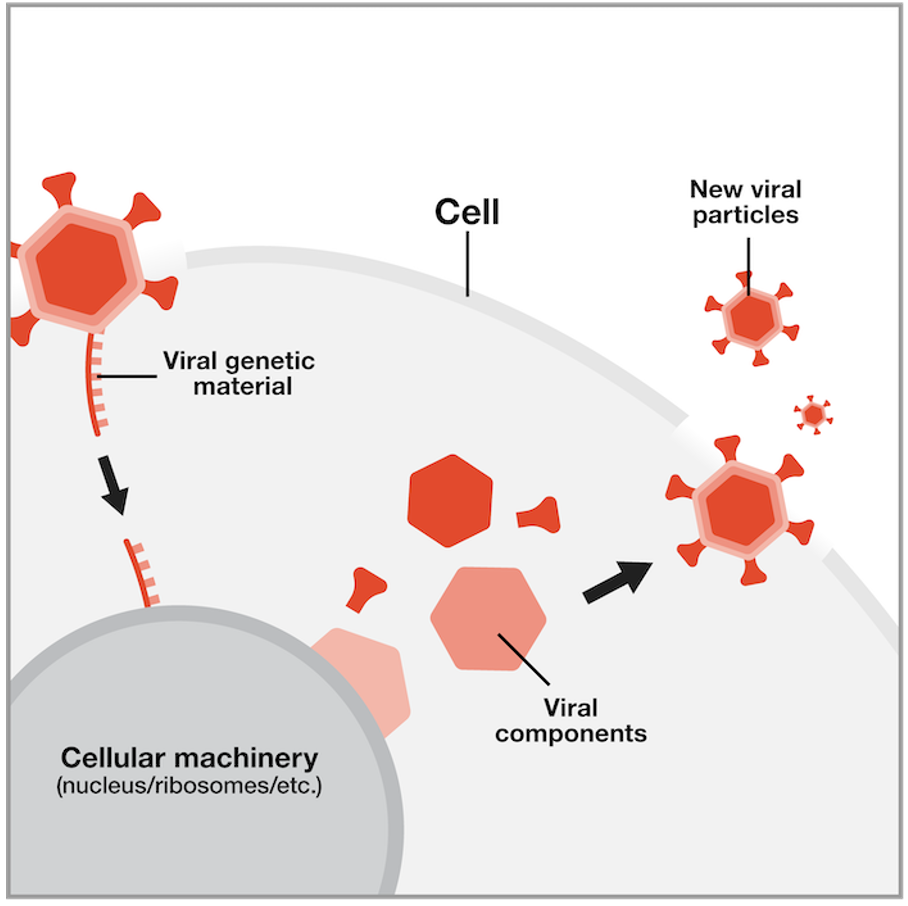
Viruses have many negative associations: common colds, COVID-19, norovirus (the stomach flu), and many more. Their infectious nature allows them to easily deliver their “cargo” to target cells and organisms, and when that cargo is designed to make you sick…well, you feel it. But ...
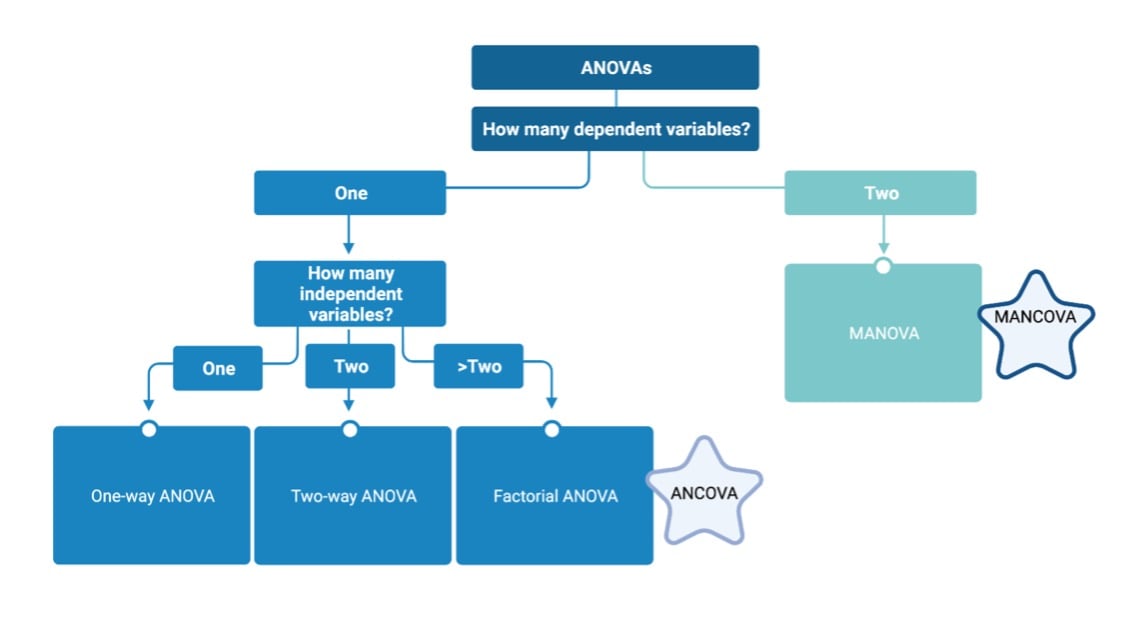
You’ve acquired your long-awaited data – and it looks great! There are some exciting trends in your experimental groups, but how do you determine if they deserve that oh-so coveted asterisk of significance? You’ve already done the heavy lifting, so don’t let the statistical ...
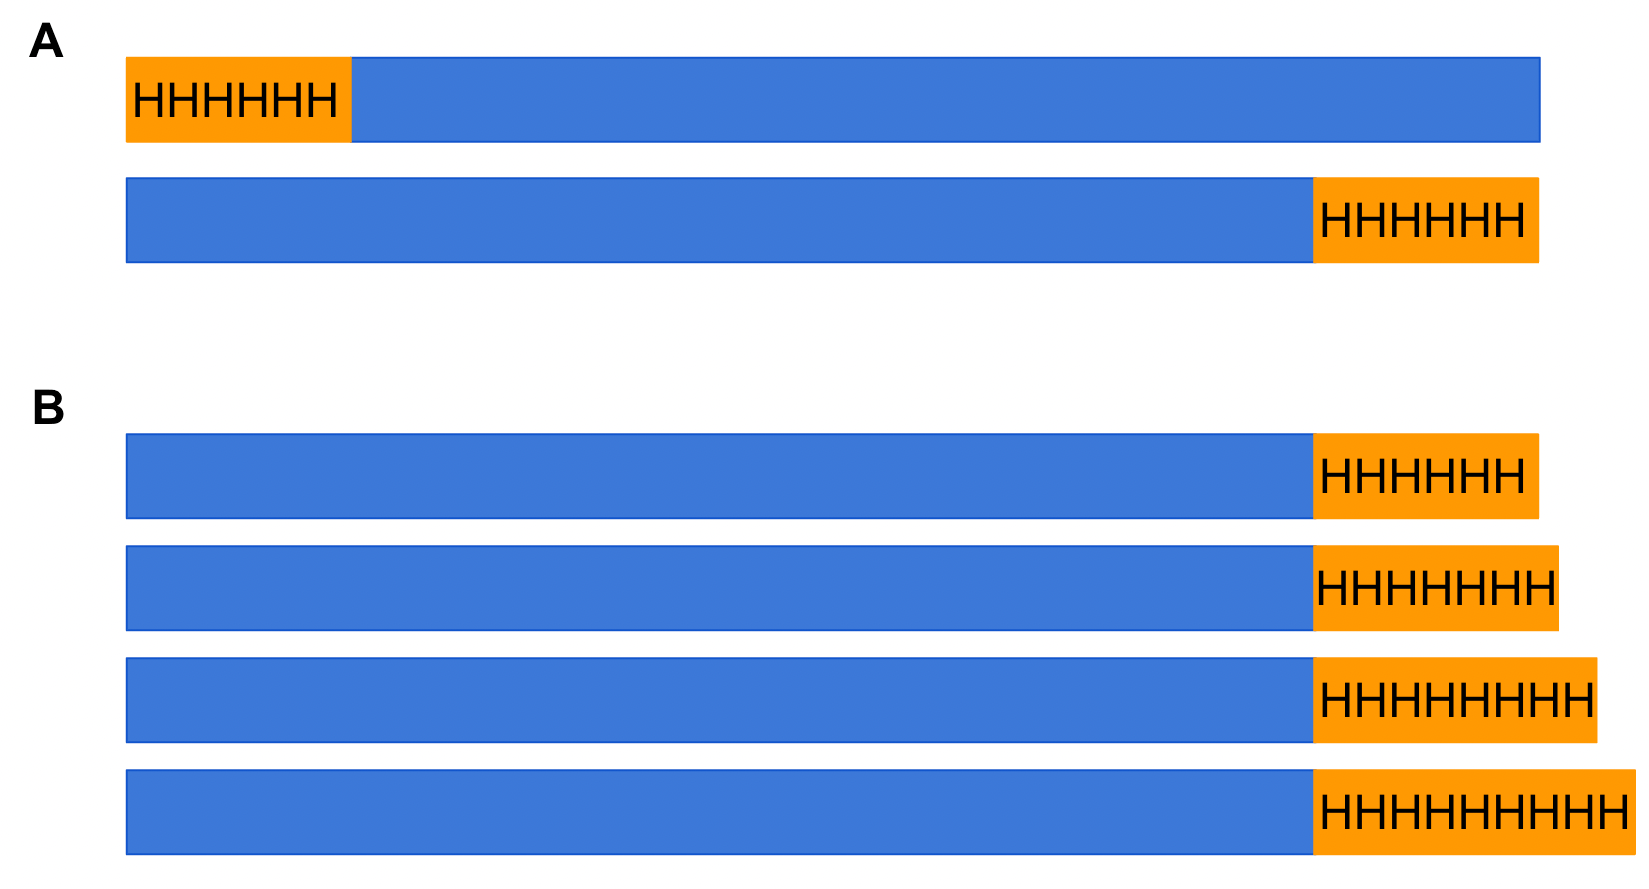
Much of today's biological research requires a close examination of specific proteins within a system. This can be pretty complicated given that a single cell has tens of thousands of proteins functioning in a variety of ways. How do scientists focus on the activity or function ...
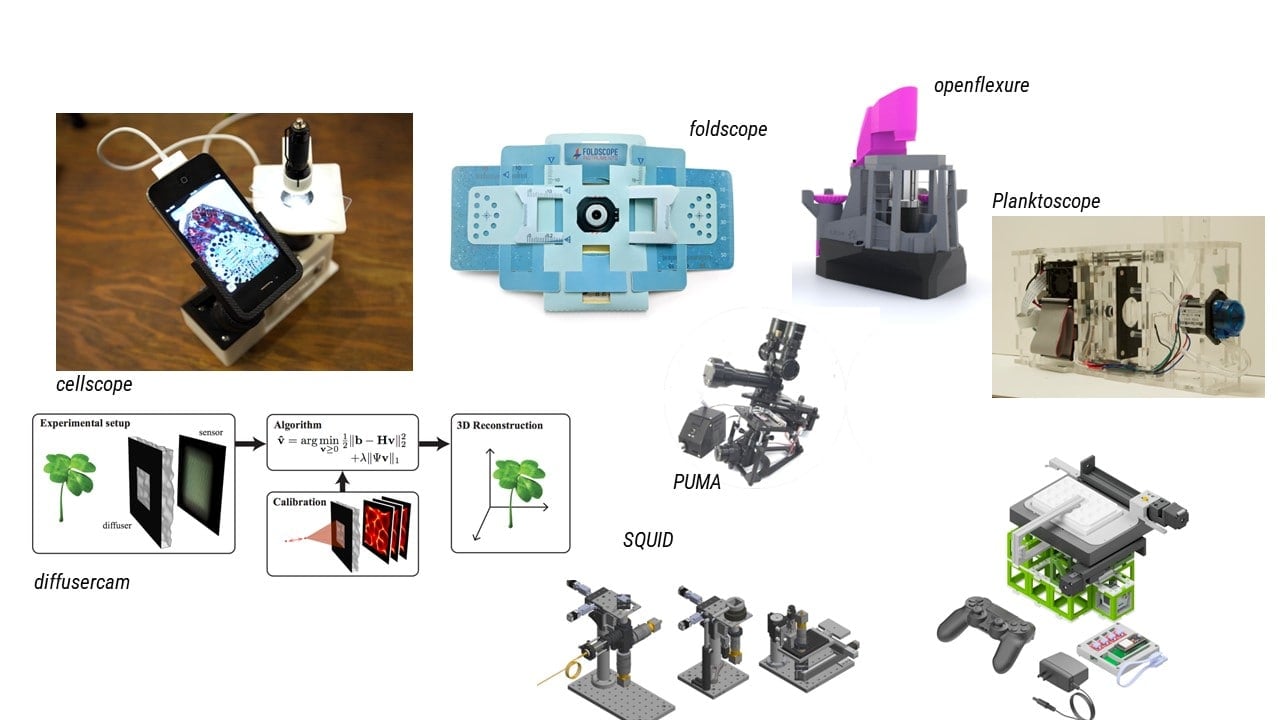
Since its early years, the light microscope has been a powerful tool in almost all disciplines. In biology, innovative new imaging approaches are constantly being developed which combine computational processing with biological protocols and revolutionary physical approaches. ...
Addgene saw big changes in 2022, from the launch of a new material to the redesign of a community resource. Now that we’re in the first quarter of the new year, I’d like to take a moment to reflect on our accomplishments from 2022 and share what we’re looking forward to in 2023 ...