Master plasmid fundamentals, CRISPR techniques, AAV serotype selection, and antibody applications. Written by scientists, for scientists.
Subscribe
I spent about seven years working in research labs, and then pivoted to writing full-time in mid-2020. As I left the ivory tower and walked down into its foothills, I began to have conversations with many people who eagerly follow progress in synthetic biology, and want to be ...
Primer design. Plasmid mapping. DNA sequence analysis. We all have our favorite tools for tackling these particular tasks, but they tend to be scattered about the internet. To help you keep your virtual molecular biology toolbox organized, today’s post features a list of free ...
We are excited to announce the fourth edition of our popular eBook, Plasmids 101, is now available!
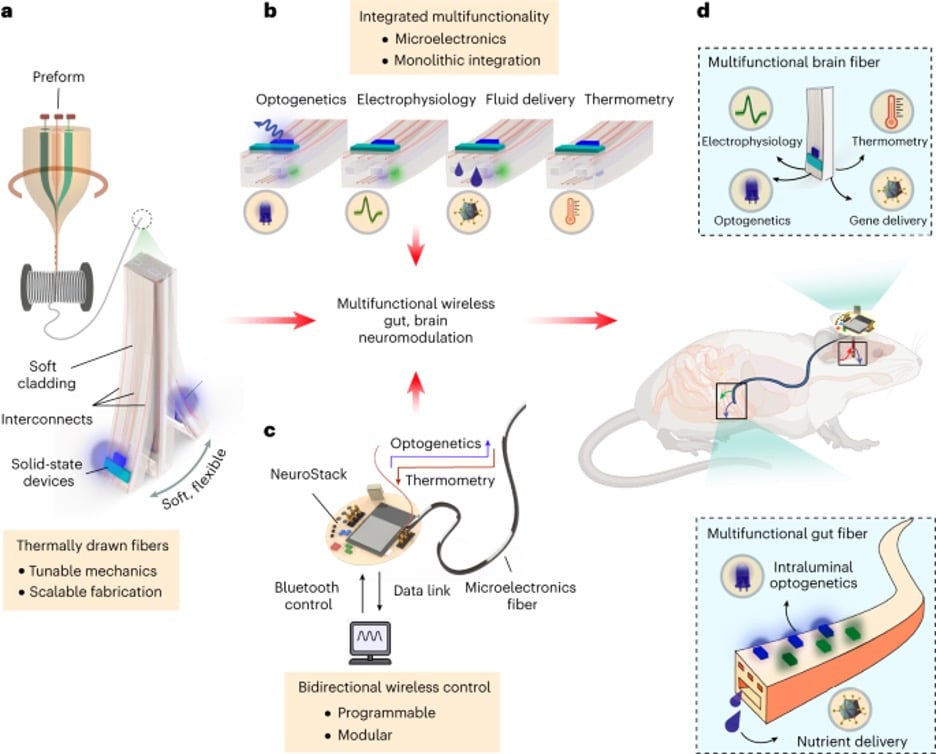
I often wonder about the gut-brain axis (admittedly for self-serving reasons – I want to understand my obsession with the combination of chocolate and peanut butter), but it’s an undeniably difficult connection to study on a molecular level. The brain is constantly influenced by ...
If you’re interested in learning a new skill, getting access to equipment you don’t have, or maybe both, a visiting scientist stint may be ideal for you. Here, we will chat about who might want to explore this role, how to seek out such an arrangement, and how to operate once in ...
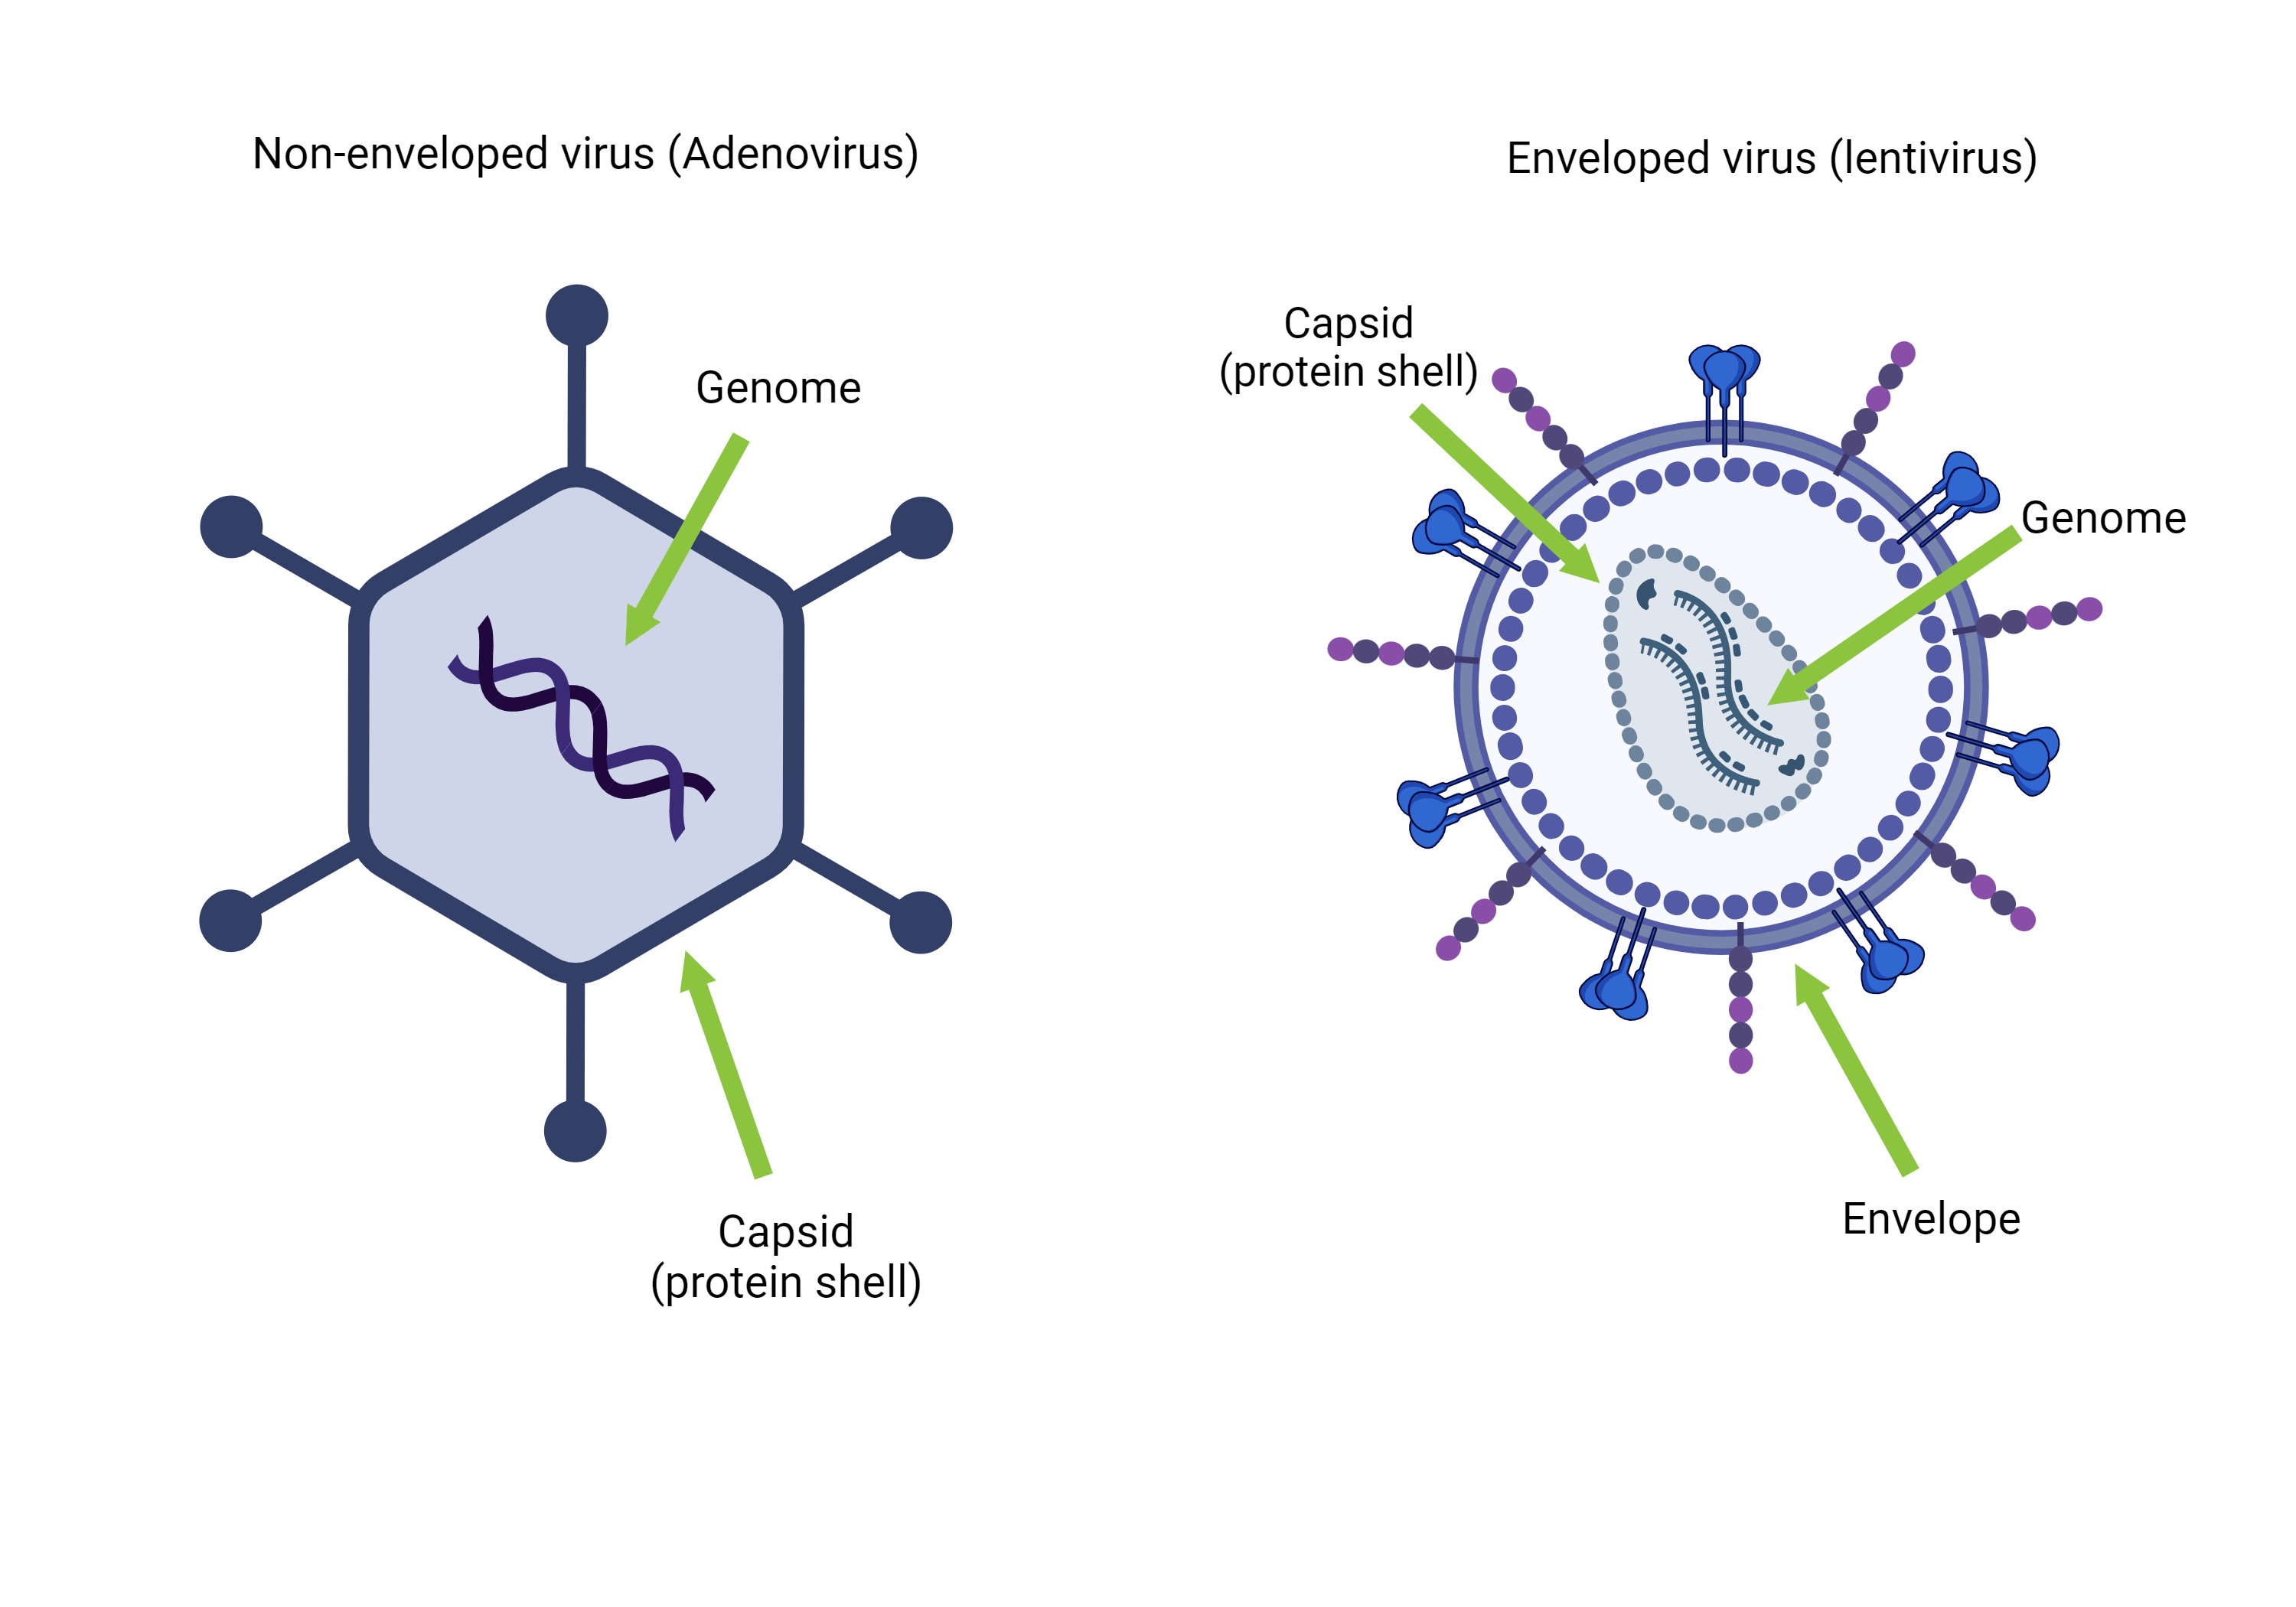
Viruses are simple: a genome packaged in a protein shell (Taylor, 2014). They’re so simple that we can’t even decide if they’re alive or not. Yet these simple, small particles have quite the outsized impact — and not just on the disease front.
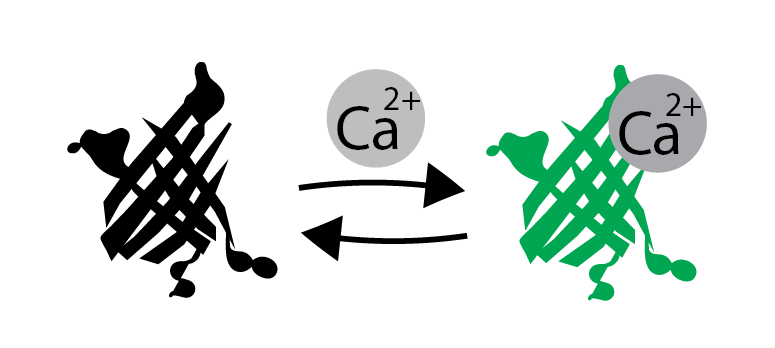
Calcium is arguably one of the most important metal ions in biology (sodium and potassium are up there too!). Calcium is fundamental to muscle and nerve function, hormone secretion, blood clotting, and as we all know, a structural component of bones and teeth. It is an enzyme ...


.png)