Master plasmid fundamentals, CRISPR techniques, AAV serotype selection, and antibody applications. Written by scientists, for scientists.
Subscribe
Addgene is very excited to share the very first edition of our Antibodies 101 eBook! The latest addition to our eBook collection is a handy resource for anyone looking to use antibody-based applications in their research.
We’re big fans of all our depositors here at Addgene — your contributions make the repository what it is. So we’re thrilled this week to congratulate depositor David Baker, who was awarded the Nobel Prize in Chemistry last week alongside Demis Hassabis and John Jumper! The Baker ...
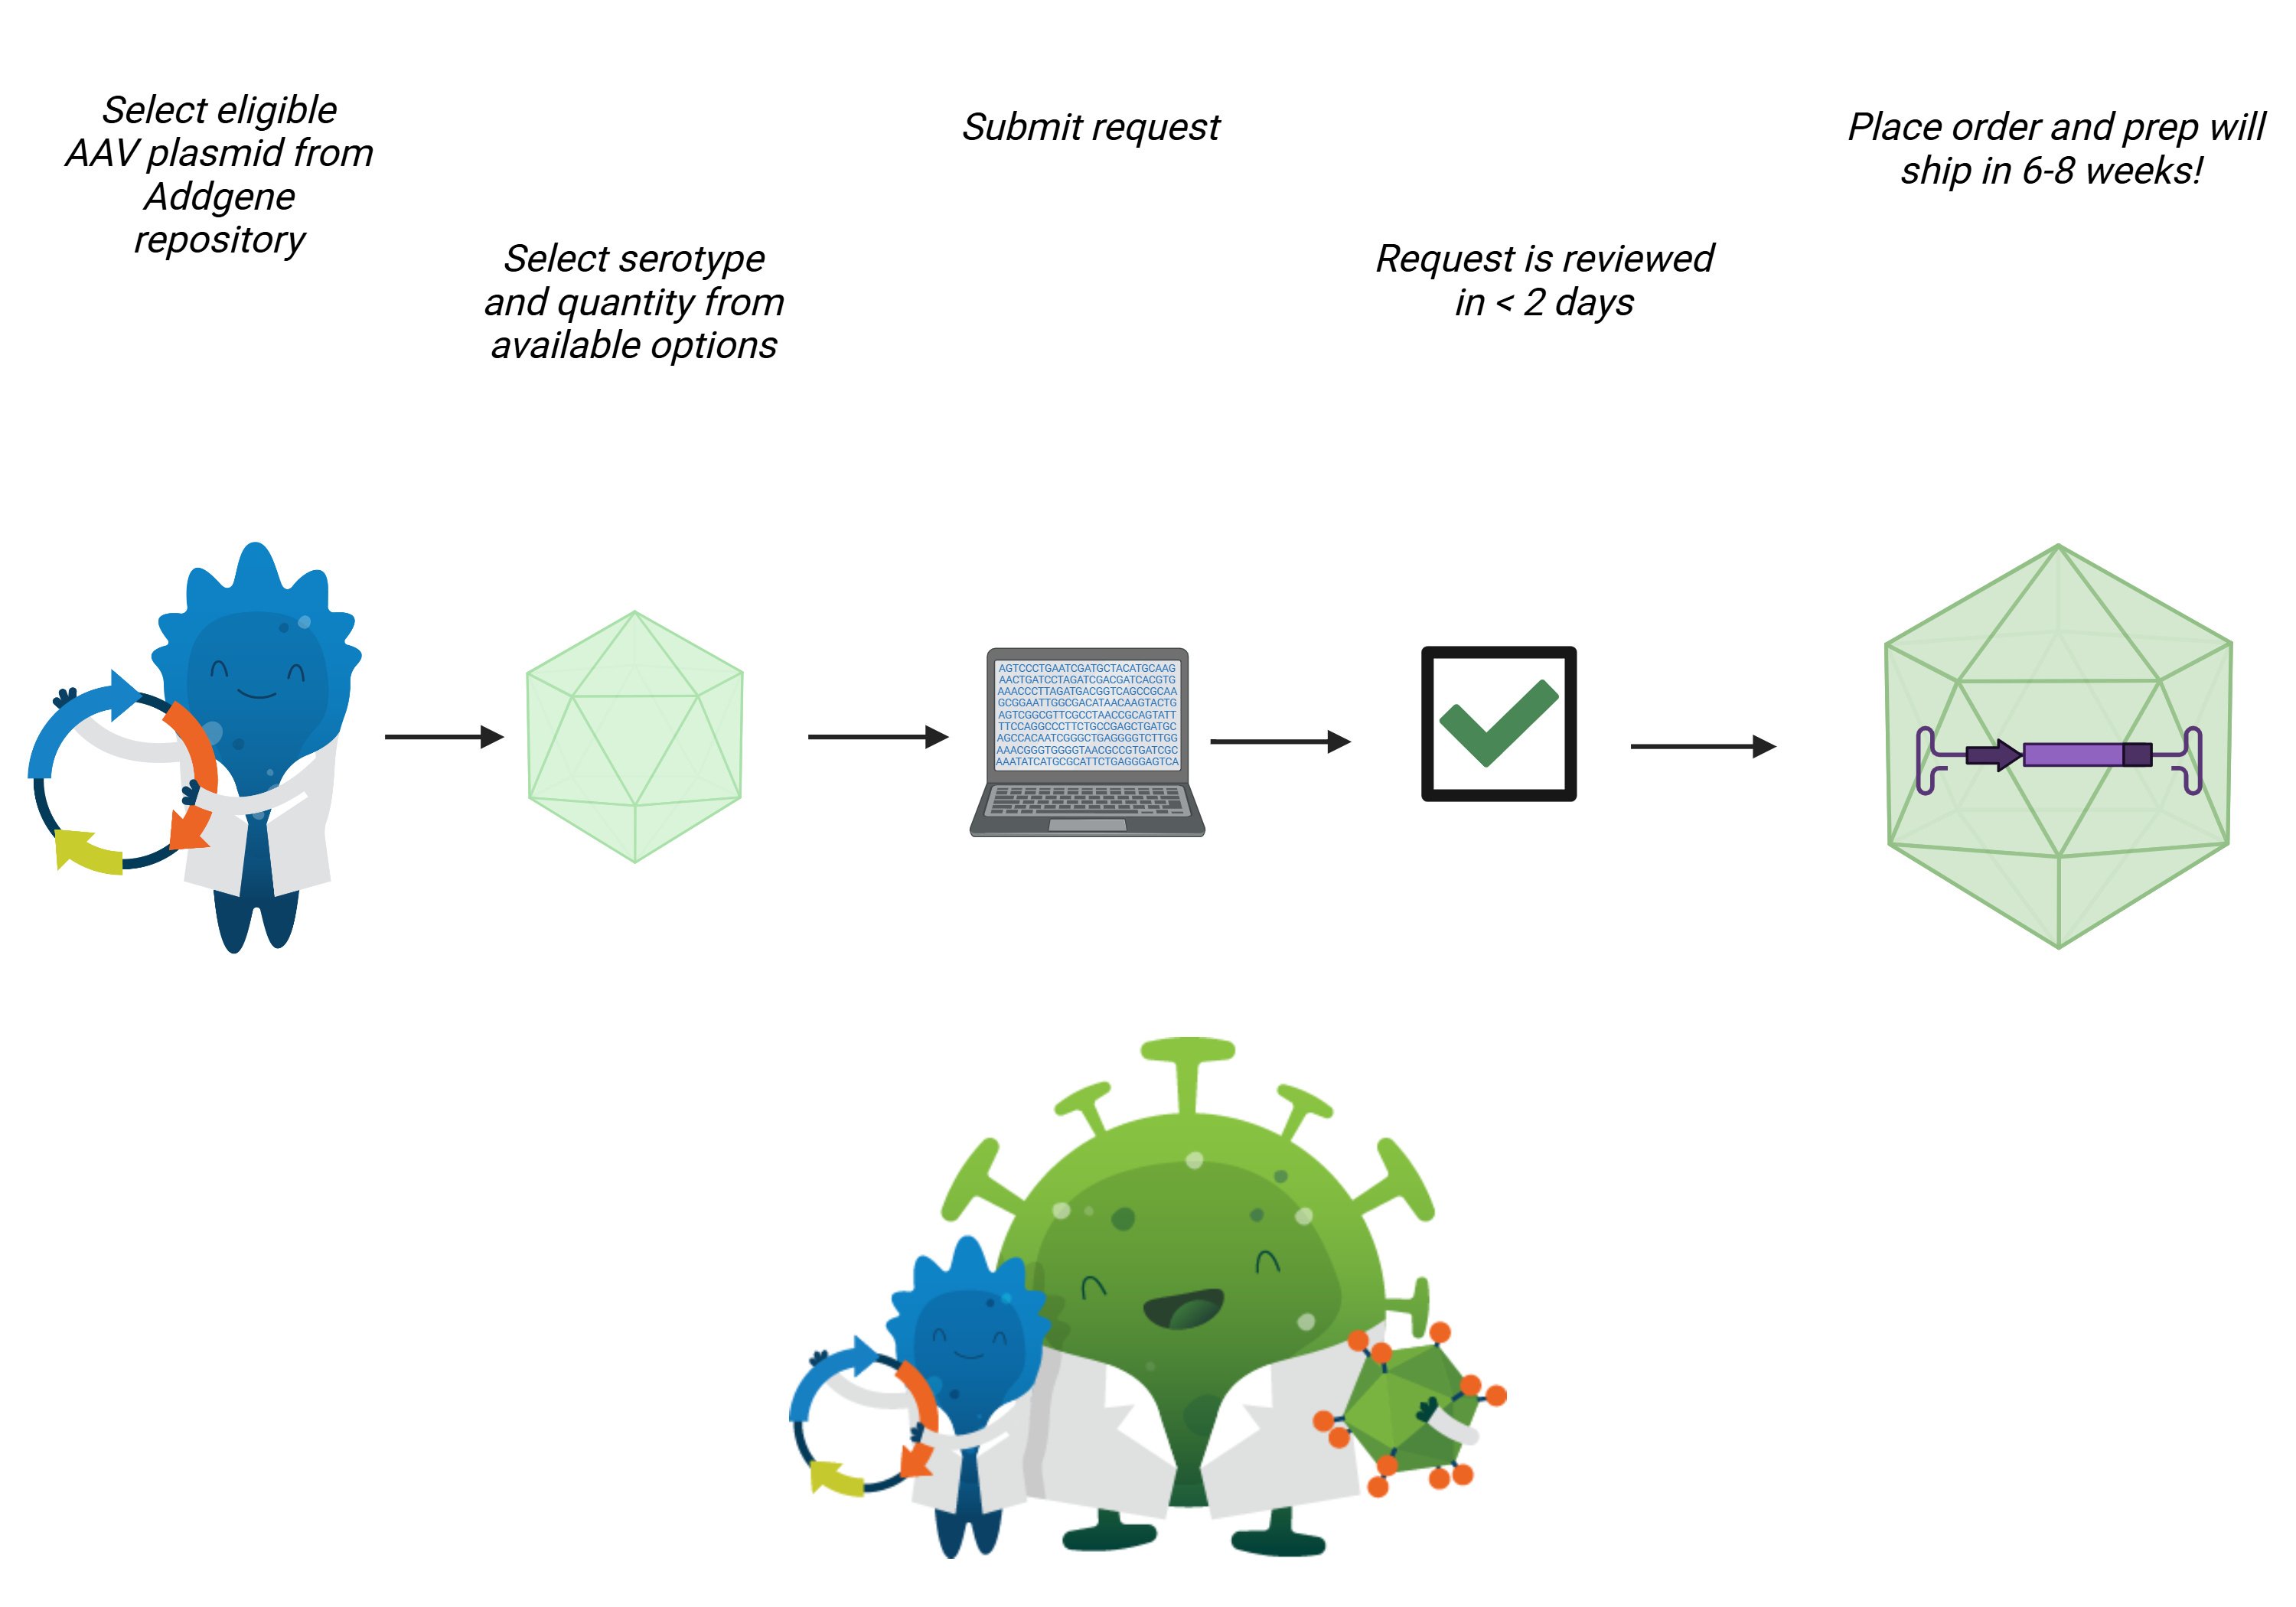
We’re very excited to announce that we are expanding our viral vector service to include a Packaged on Request option. Through this expansion, scientists will be able to request an AAV composed of an AAV plasmid in the Addgene repository and their choice of five different ...
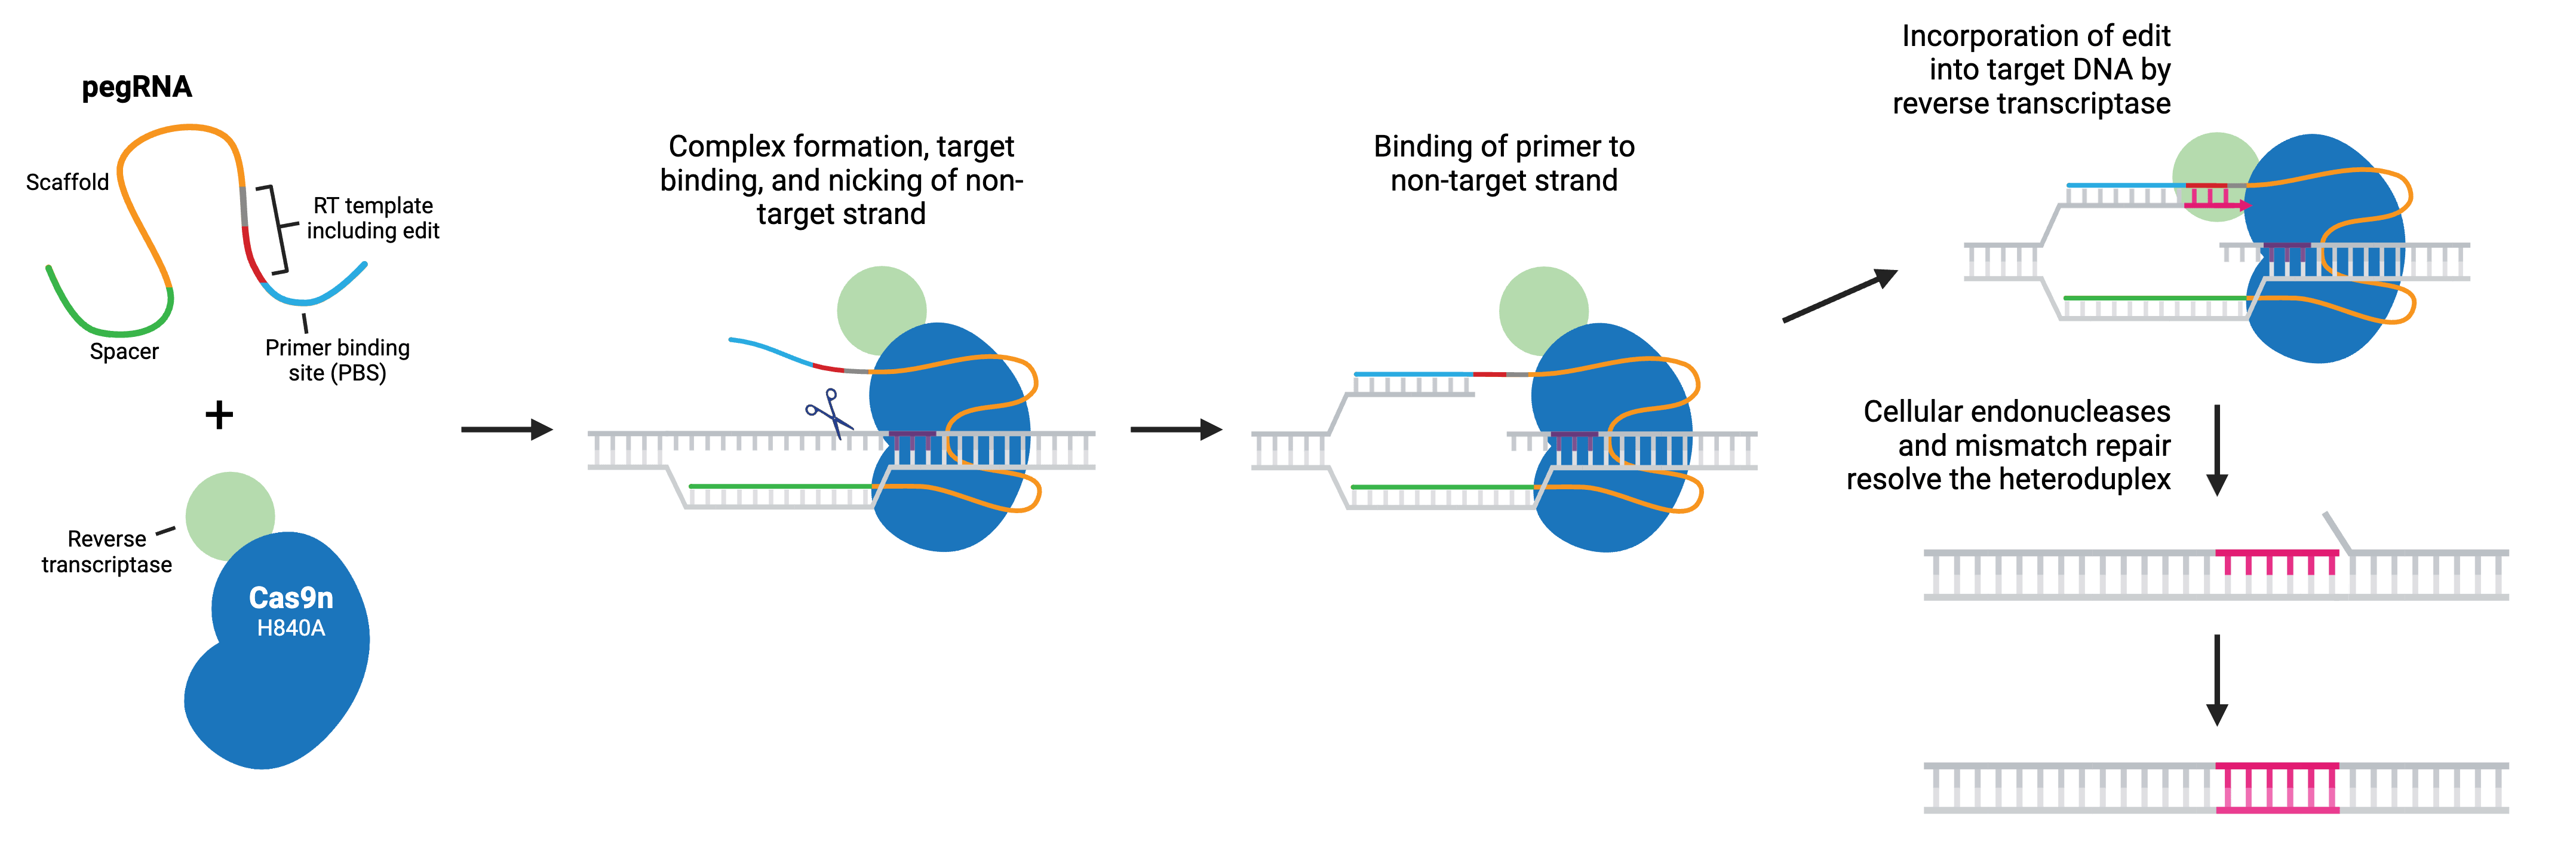
Addgene is proud to present our updated CRISPR Guide!
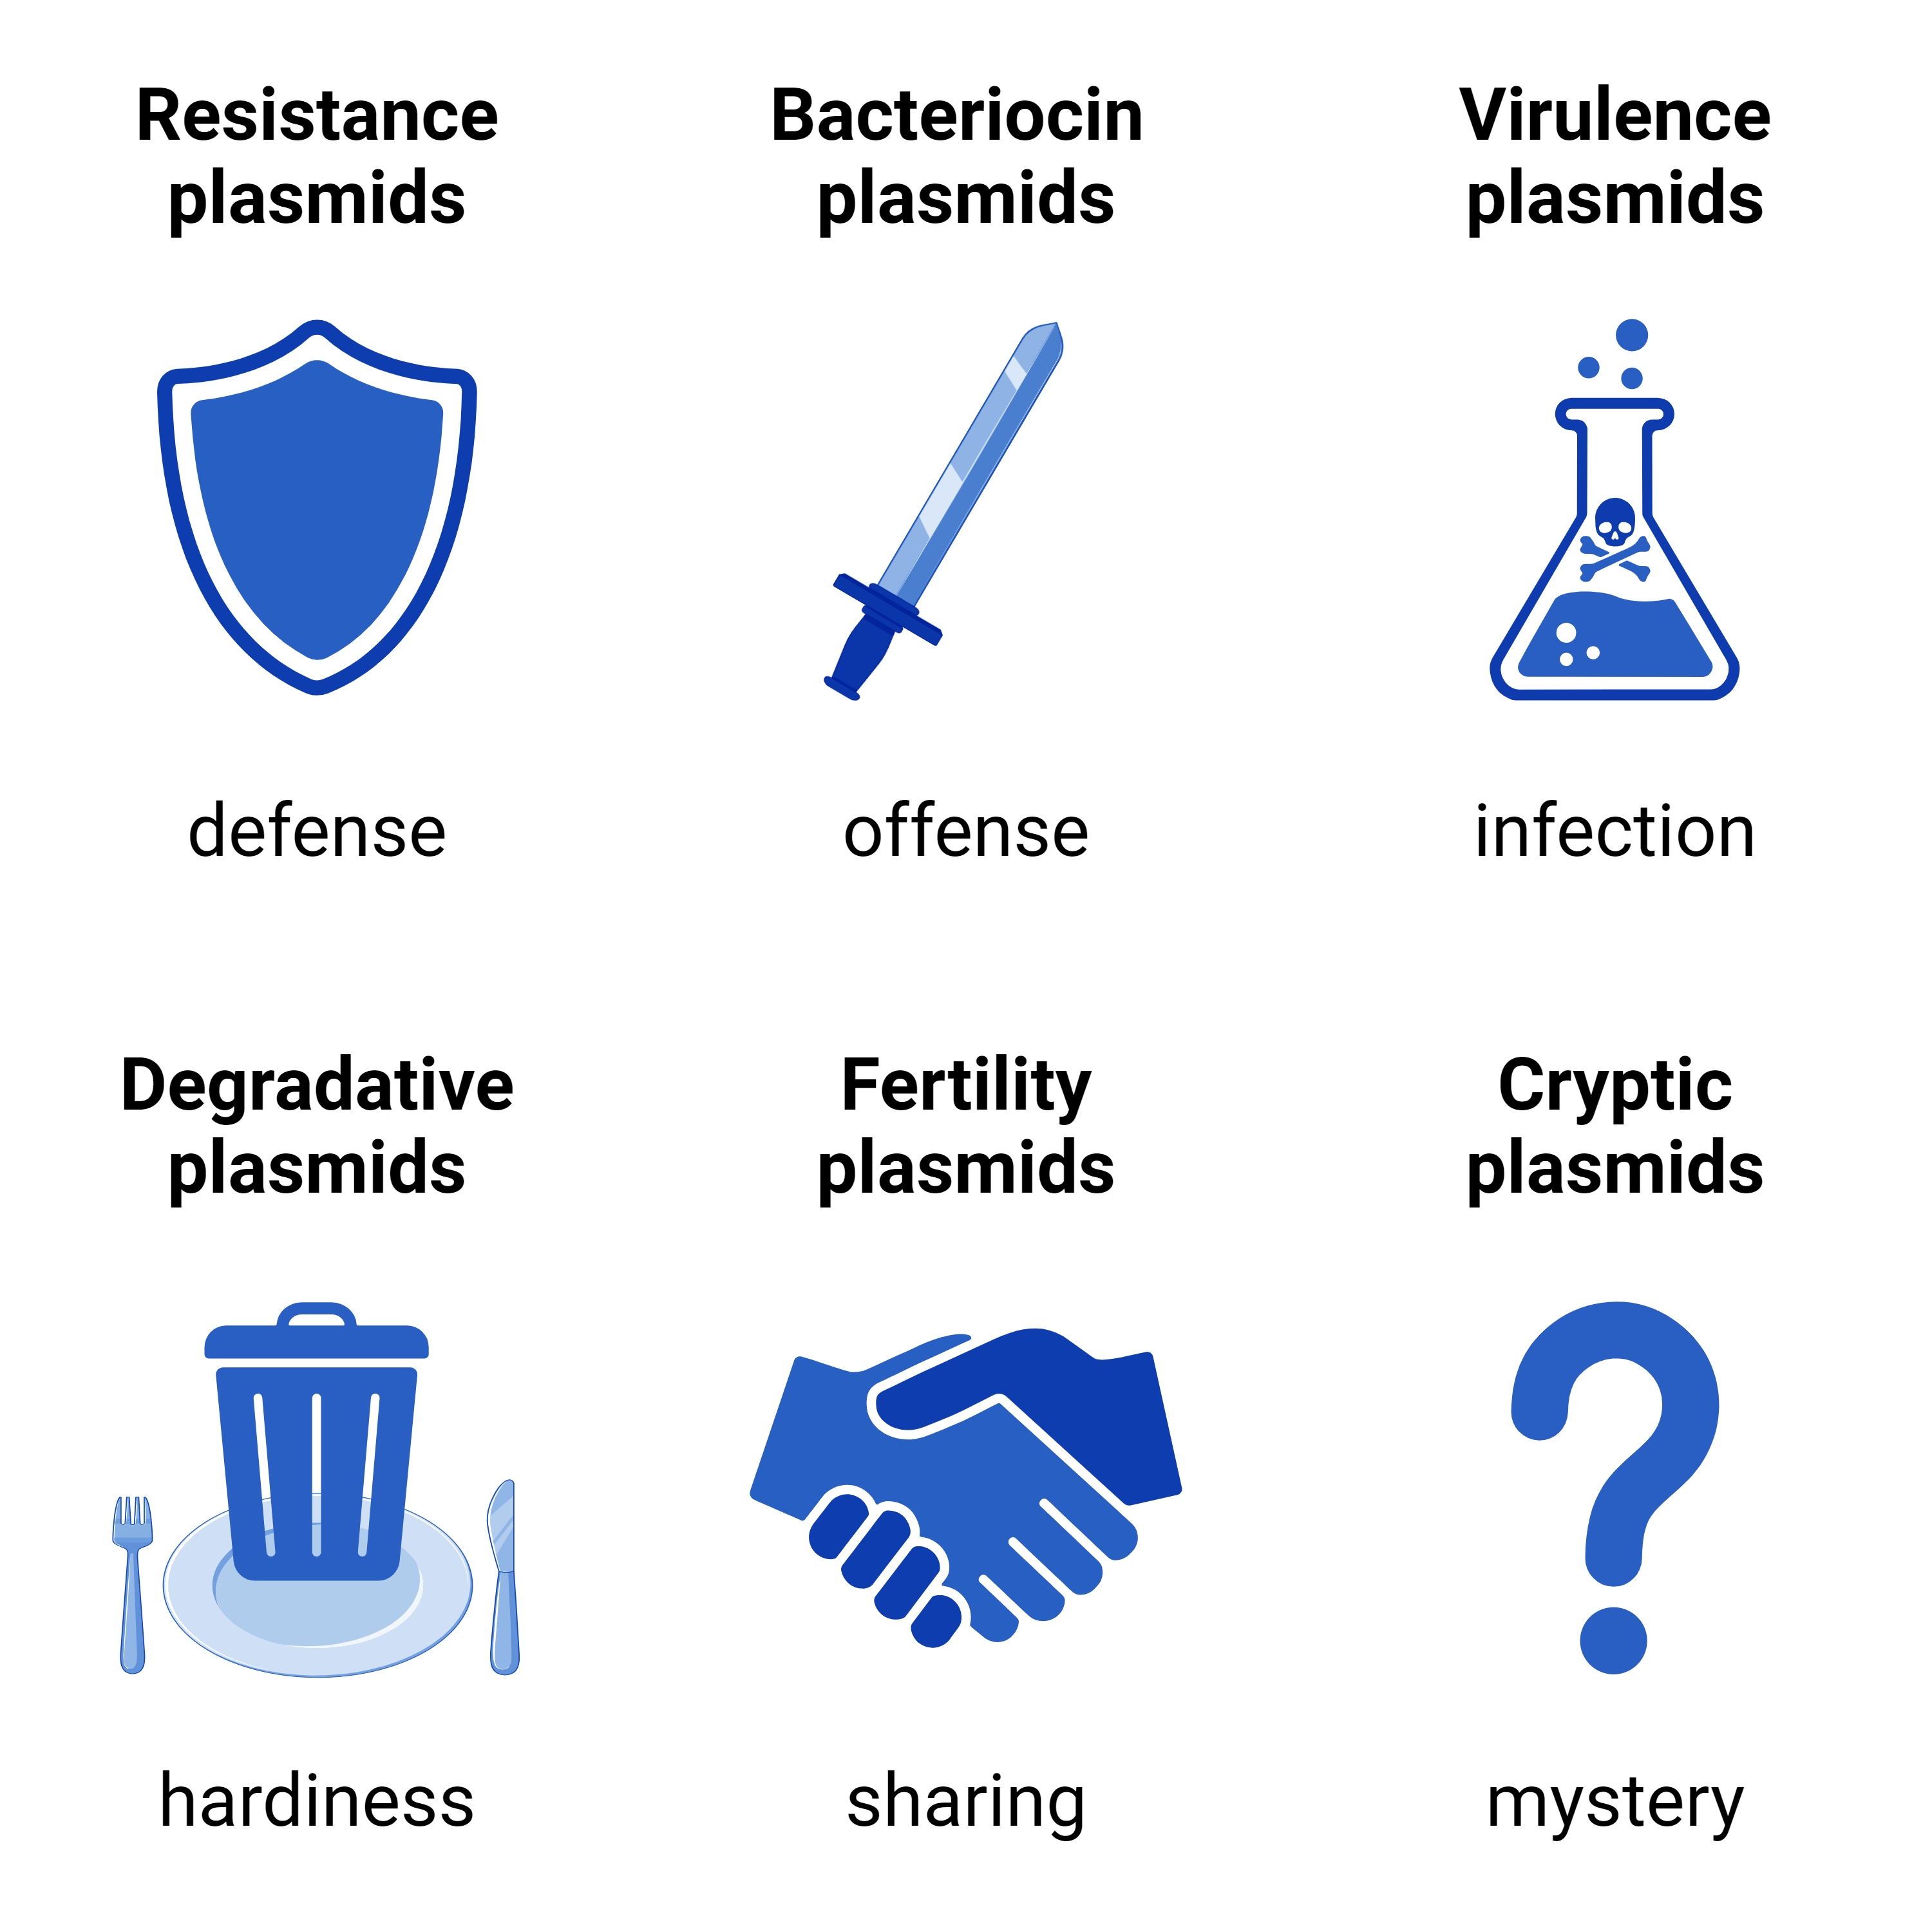
Here at Addgene, we often refer to plasmids as lab or experimental tools. They certainly are very handy in research, but we’re really borrowing these tools from Mother Nature’s toolbox. Natural plasmids, also called environmental plasmids, are all around us!
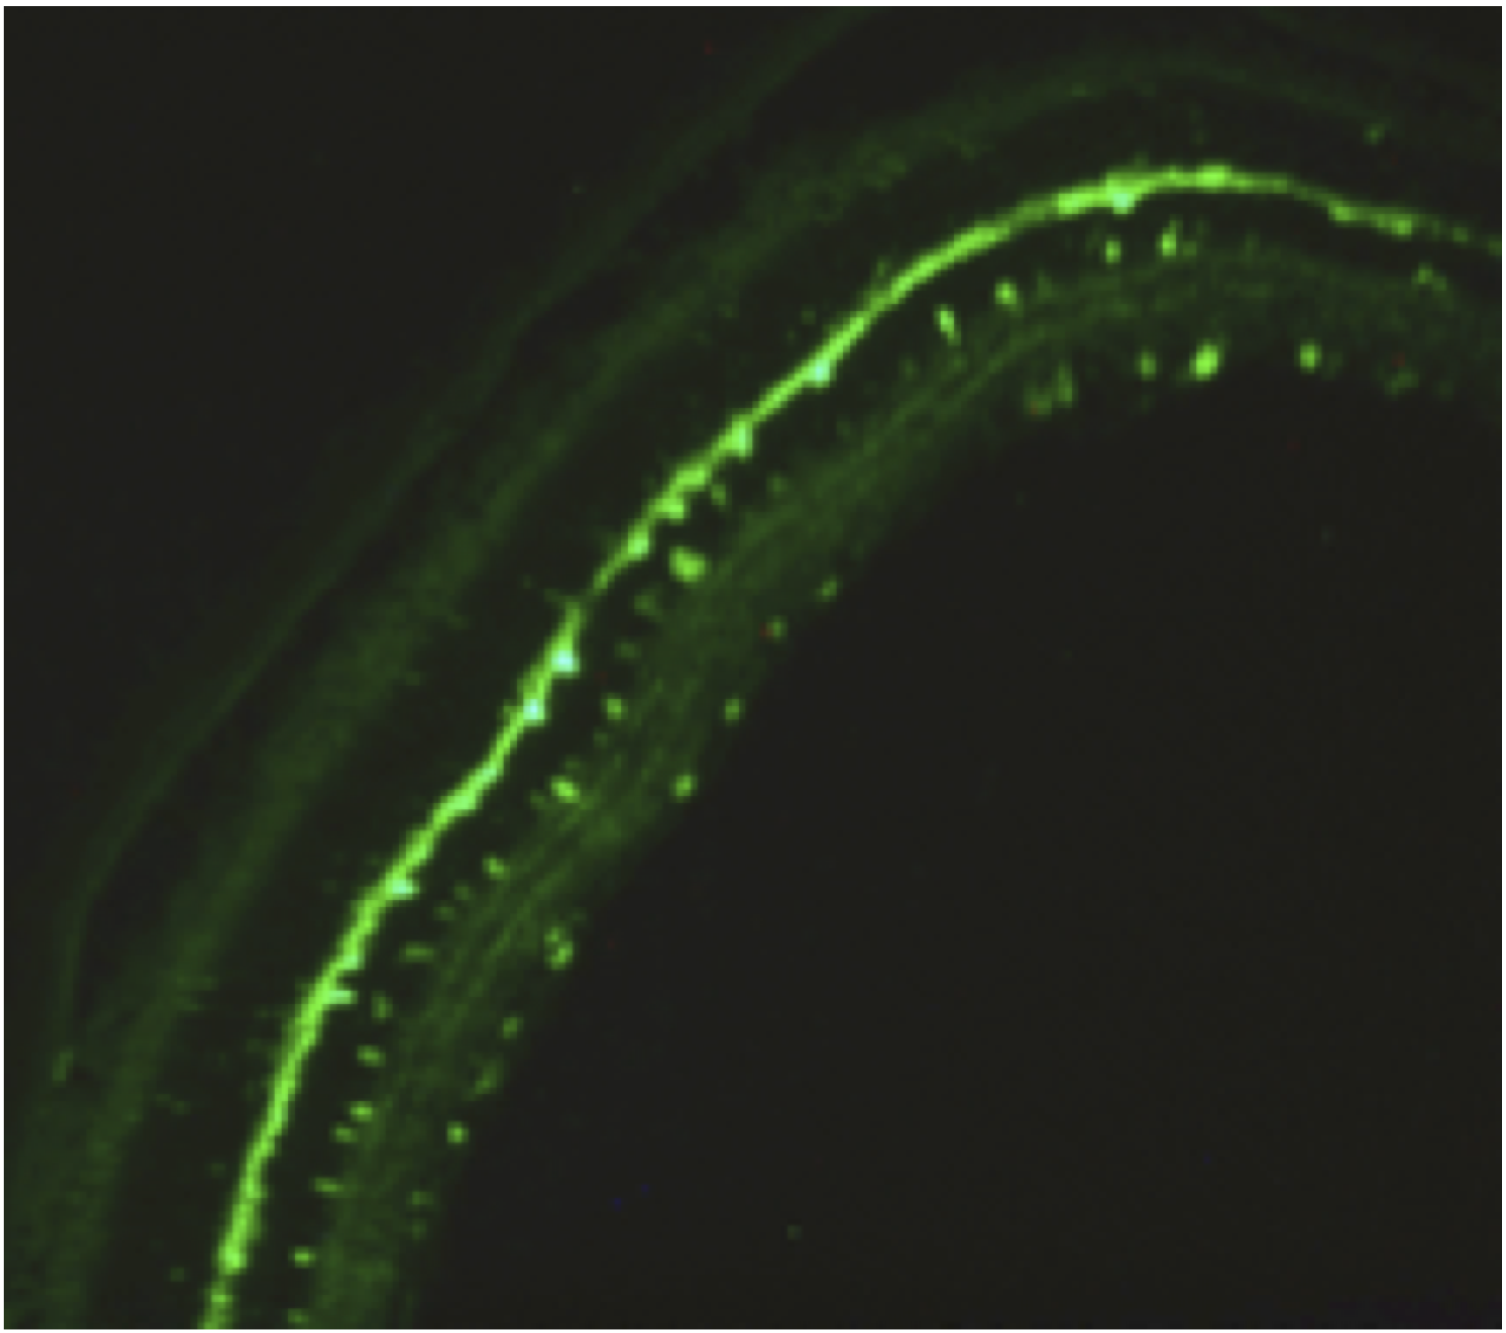
If the fall colors are inspiring you to paint your cells in equally vivid colors, you'll want to check out the 34 new preps available in the Addgene viral vector repository! This includes the first Addgene prep packaged in the AAV9-X1.1 serotype.
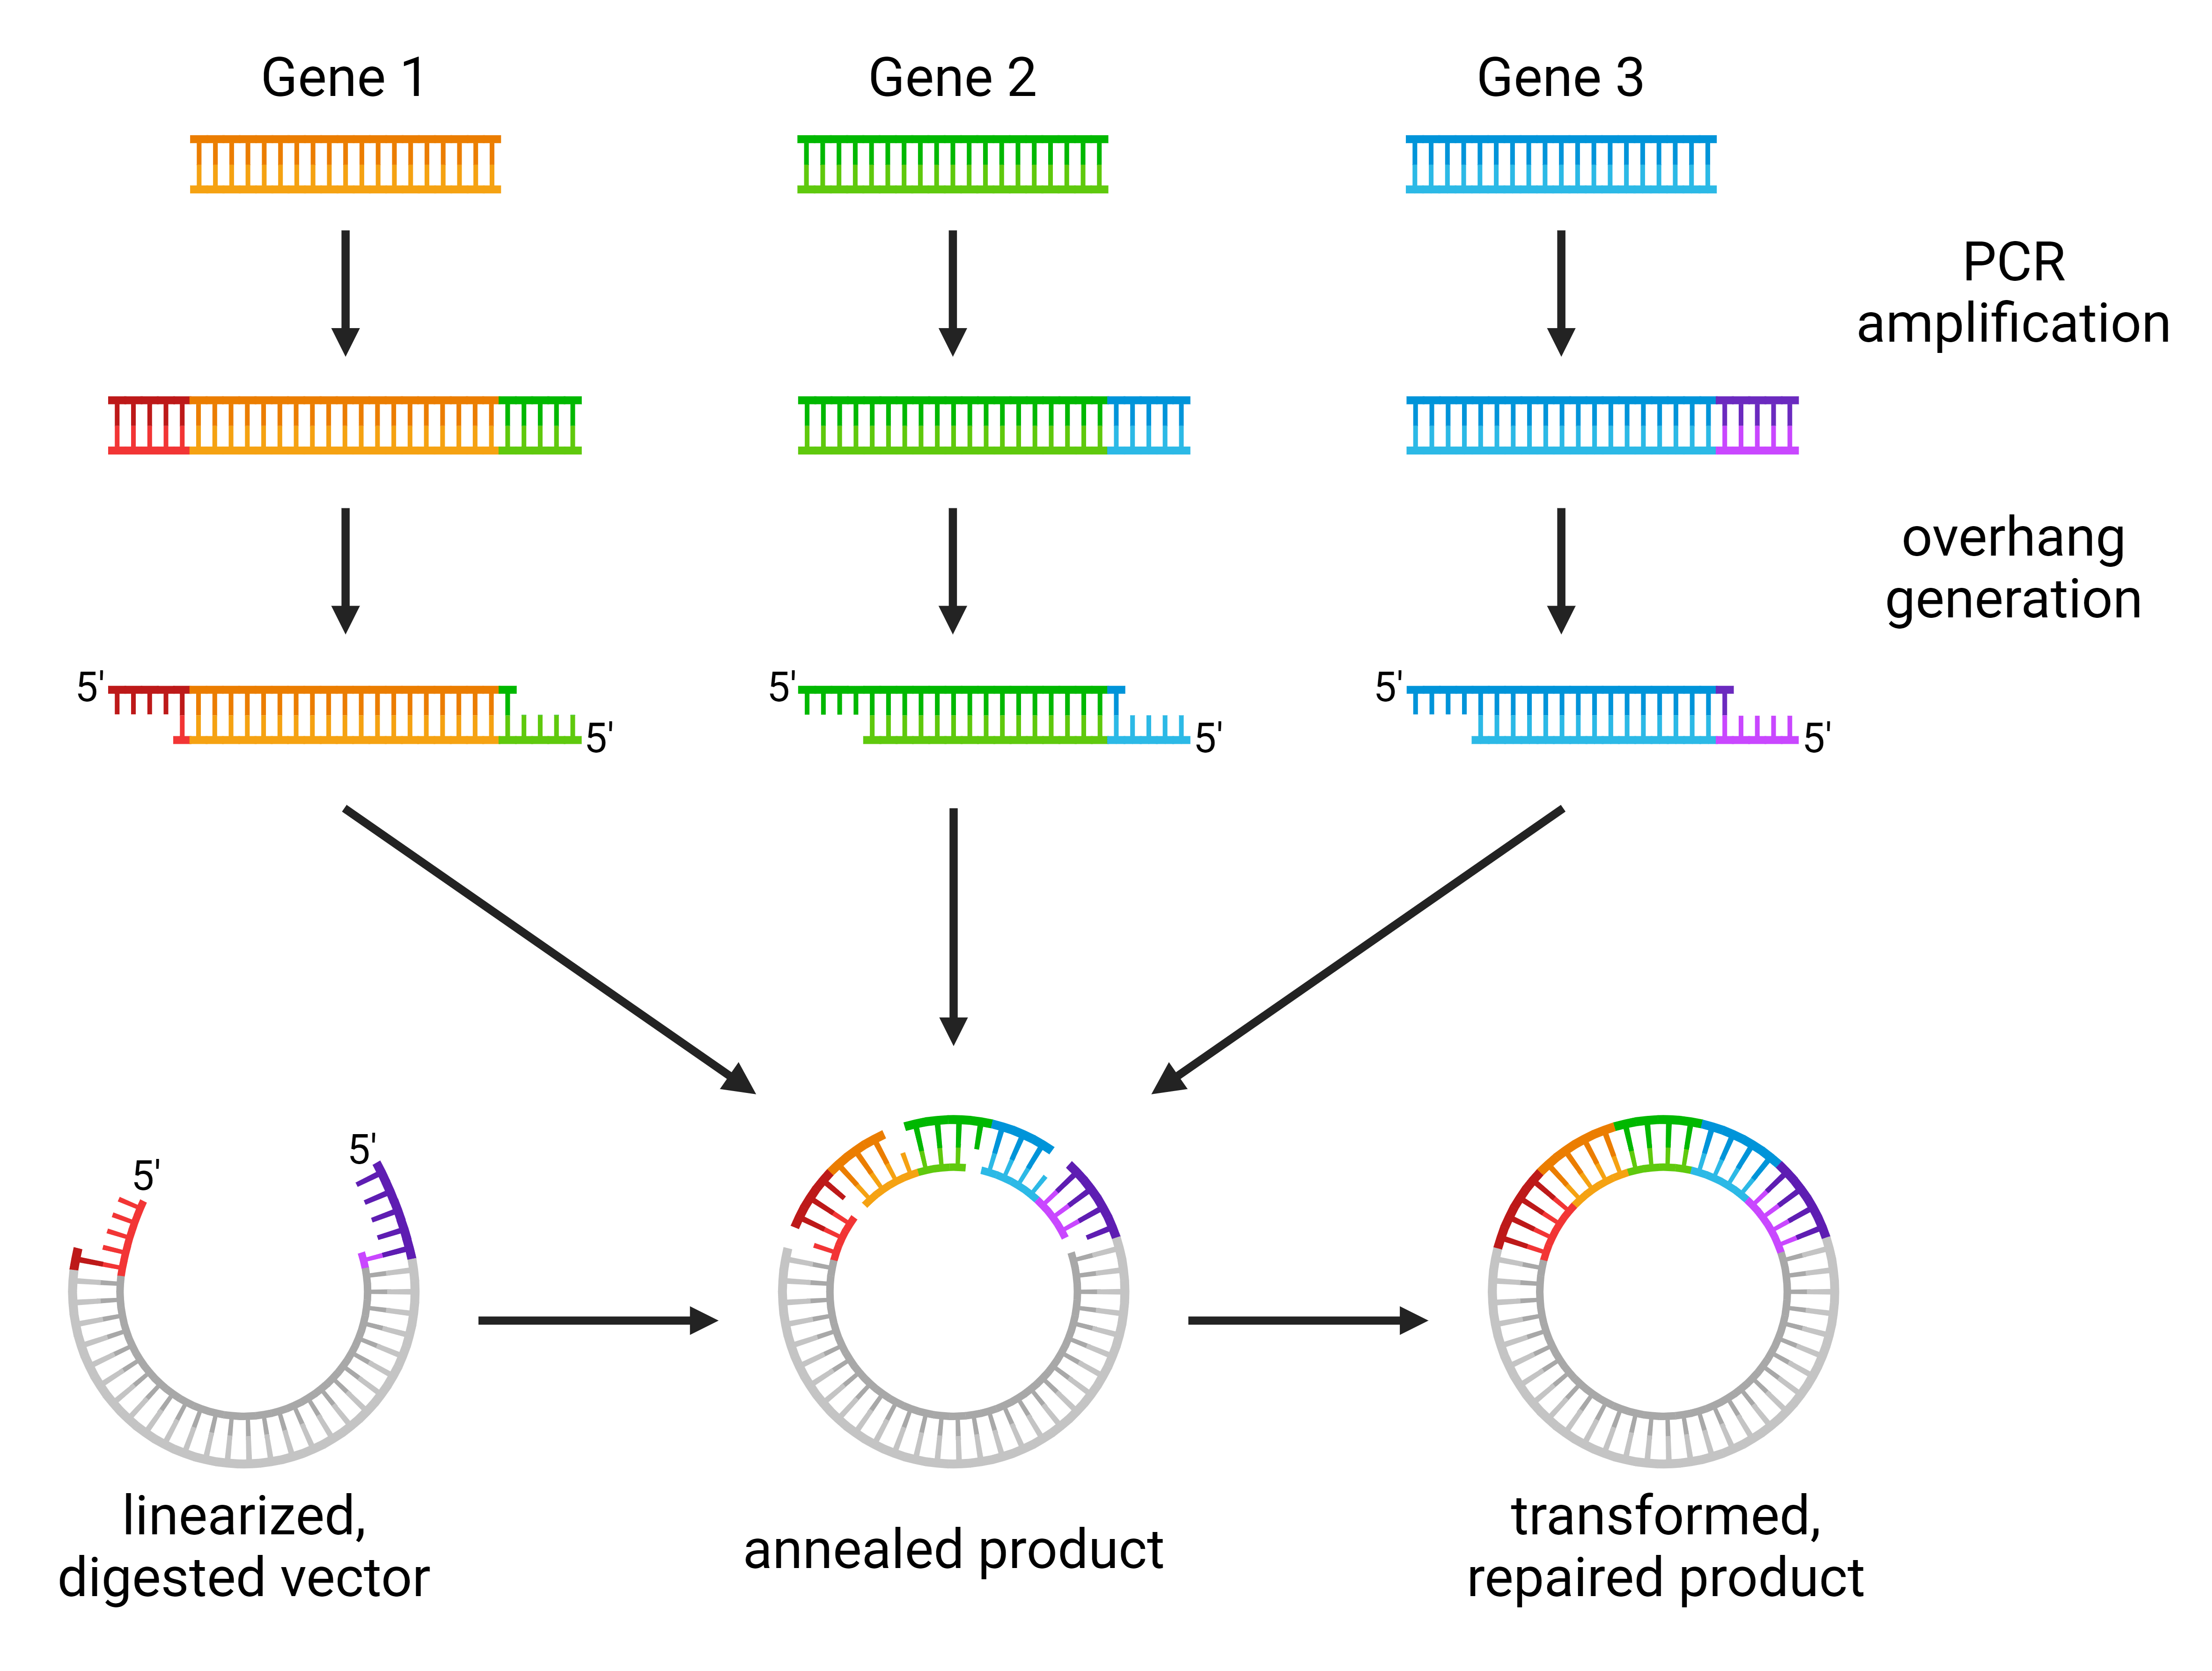
If cloning methods had personalities, SLIC (sequence- and ligation-independent cloning) would be a true rebel. Not only does this system not use site-specific recombination, it also doesn’t require a ligation step. Based on the robust system of homologous recombination found in ...




.png)
-min.png)