The same way the human body is made up of organs, cells comprise compartments and structures, called organelles. Take a sneak peak inside a cell with the images from the Allen Cell Explorer (1).
When studying the function of a protein or its role in a disease, researchers often isolate proteins of interest and examine them using biochemical methods thus removing the context of the cell. However, much knowledge about functionality can be gained by understanding the location and transport of the protein within a living cell. Analyzing differences in protein localization and transport between healthy and diseased states can also provide interesting insights into disease mechanisms and protein function.

Getting ready to determine the subcellular localization of your protein of interest
The first step in analyzing the localization of your protein of interest is to make it detectable. Visualization can be achieved using fluorescent microscopy - even in living cells and whole organisms. You can take advantage of the many Fluorescent Proteins (FP) available for microscopy, by cloning your protein of interest into a vector encoding a fluorescent tag. Once expressed as a fluorescent protein fusion, it is possible to track your protein of interest from its production site to its final destination. As an example, most secreted proteins are produced in the endoplasmid reticulum, modified in the golgi and then transported in vesicles via the secretory pathway to their subcellular or extracellular destination. At the end of their life cycle, proteins may be transported through the vesicles to the lysosome where they are finally degraded (2, 3).
Once you've created your fusion protein, it's important to validate its function relative to the untagged, wild-type protein. You may, for example, validate that the fusion protein localizes properly by comparing the signal from the fusion itself to the wild-type protein visualized with a fluorescently-tagged antibody.
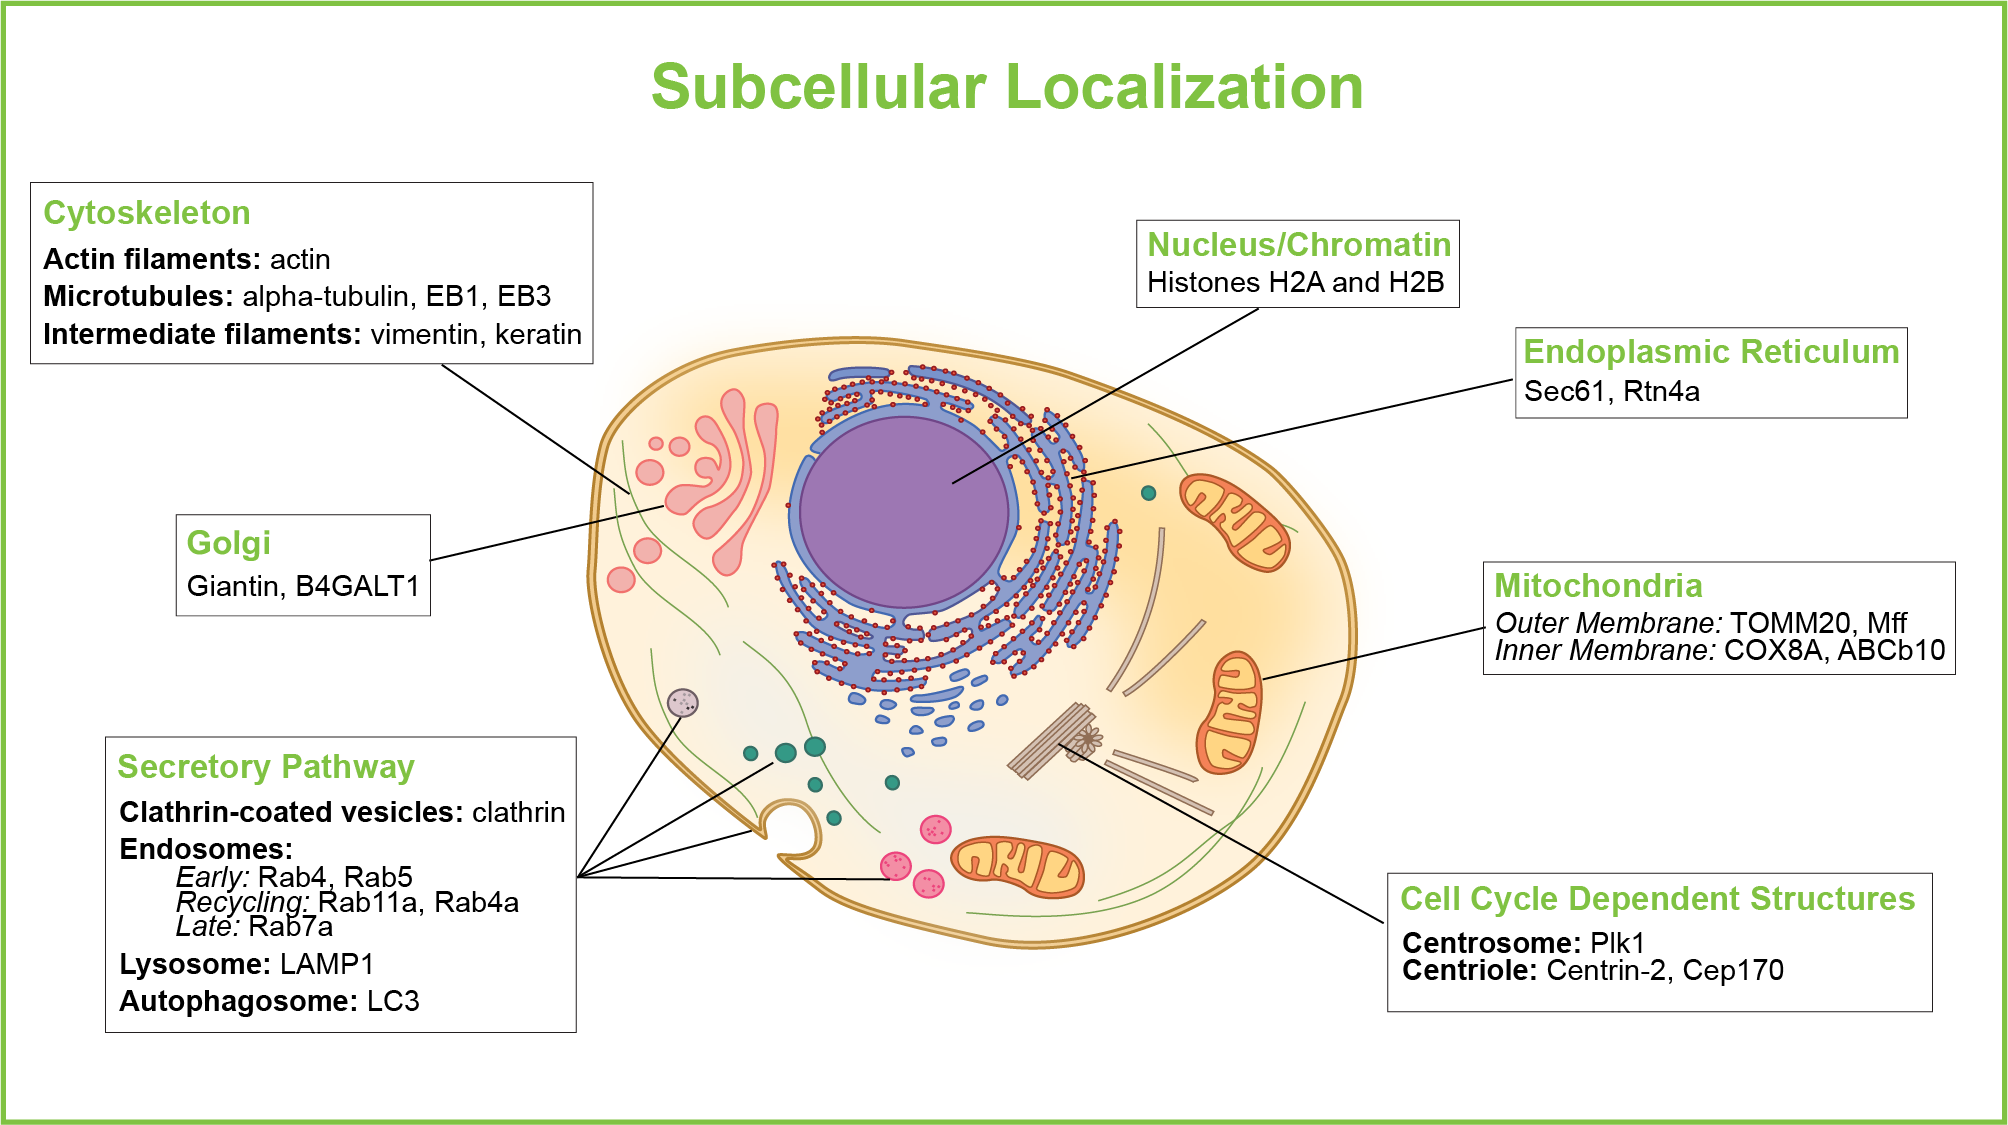
By employing “marker proteins” which are known to be a part of an organelle or involved in intracellular transport pathways, it is possible to map the internal organization of a cell. This mapping can be done by using antibodies targeted to the marker proteins, however, in this case the cell needs to be fixed and the cell membrane permeabilized in order for the antibodies to reach their intracellular targets. Therefore, it can be beneficial to employ well-characterized marker proteins tagged with FPs to highlight various subcellular structures. Please see Figure 1 for commonly used markers for major mammalian organelles and transport pathways.
It is best, though not always possible, to use inert fluorescent protein fusions to visualize subcellular structures. For example, you might use your fluoresent protein fused to a signal sequence that traffics the fluorescent protein to your organelle of interest.
Click on the gene names in the figure below to find plasmids containing that particular gene.
For subcellular markers in yeast see our plasmid collection from Sue Jaspersen (Stowers Institute) and Mark Prescott (Monash University).
You can find more plasmids for labeling your subcellular structure of interest in the Allen Institute for Cell Science Plasmid Collection. You can also use the library of full-length zebrafish rab proteins from Rob Parton's Lab (University of Queensland) to observe membrane trafficking events in vivo.
Locate your protein and see who it is hanging out with via colocalization - aka “are they close?”
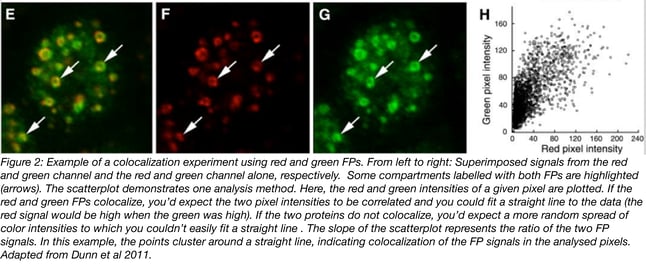
After tagging your protein of interest and selected subcellular marker proteins, it’s possible to get an idea about the subcellular structures your protein resides in and potentially which other proteins it forms complexes with. These “colocalization” studies give insights about the proximity of two proteins within the same subcellular structure or protein complex. By coexpressing both the marker protein and the protein of interest and then analyzing the relative colocalization of their fluorescent signals and the potential overlap, it is possible to determine the location of proteins within complex structures.
In order to interpret colocalization experiments in a scientific and meaningful way it is important to choose the appropriate quantification methods and tools. It is usually not enough to examine your images using subjective judgement by simply “looking at them”. Modern cameras and image analysis software are highly sensitive to detecting light signals not visible to the human eye and are indifferent to subjective color intensity perception. Open source image analysis software tools can be used for colocalization analysis. Some examples include the ImageJ plugins JACoP and Coloc 2, BioImageXD, and customized CellProfiler pipelines. Image analysis software produces quantifiable results and statistics that can be used to compare between different experimental setups.
A colocalization analysis example is given in Figure 2 (adapted from 4) - Dunn et al. 2011 provides an in-depth review of quantitative colocalization analysis methods and useful image analysis software tools.
Pitfalls, limitations, and specialized colocalization methods
Fluorescent proteins are very useful tools, but they are not without limitations and well-executed experiments require some consideration of FP properties. It is important to look out for general problems associated with fluorescent imaging such as bleed-through (the incorrect detection of one fluorescent signal in a channel setup for a different fluorescent signal) and photobleaching i.e. FP stability.
One should also be aware of additional problems related to the properties of FPs themselves. These can include the potential to oligomerize, protein charge, and actual molecular size – it is possible that a large or charged FP fusion can change the subcellular localization of a protein of interest. Scientists are continuously updating and optimizing FP tools to avoid these problems. See, for example, the recently developed FPs optimized for diverse cellular environments.
Since colocalization relies upon the detection of 2 independent fluorescent signals and their potential overlap, it is essential to make sure that the selected FPs do not influence each other and thus potentially falsify the signal. As a baseline rule, the emission spectra of the selected FPs need to be sufficiently separated, most commonly FPs with red and green wavelengths, respectively, are selected (6). These previous blog posts help with the decision of which FP you should use and how to select FPs for muli-color imaging.
Furthermore, one must bear in mind that the resolution of light microscopy is limited by the wavelength of light and, practically speaking, for common lab microscopes the detection limit is 200 nm. The size of most proteins is below 10 nm and therefore colocalization detected in microscopy cannot be interpreted as direct molecular interaction without further investigation. One fluorescent microscopy method commonly employed for analyzing interactions between two molecules more closely is Förster Resonance Energy Transfer, FRET.
Additional opportunities: Tracking intracellular pathogens
In addition to tracking the location of proteins it is also possible to follow the life cycle of viruses and intracellular bacteria – have a look at our Microbiology resources for fluorescently tagged viral and bacterial components. For example, the Rainbow Vectors from the Mariette Barbier Lab can be used to fluorescently label a wide variety of gram negative bacteria (West Virginia University School of Medicine, 7).
Identifying the subcellular localization and composition of cellular complexes are important steps in understanding the function of your protein of interest in a healthy or diseased cell. We hope you find the resources discussed in this article useful for your next localization experiment and invite you to make any fluorescent protein constructs you create in your own work available to the Addgene community.
Download our Markers of Subcellular Localization Poster here!
References
1. Allen Institute Plasmid Pages
2. Cooper GM. 2000. The Cell: A Molecular Approach. 2nd Edition.
3. CureFFI.org. Cell Biology 04: The Secretory Pathway.
4. Dunn, Kenneth W., Malgorzata M. Kamocka, and John H. McDonald. "A practical guide to evaluating colocalization in biological microscopy." American Journal of Physiology-Cell Physiology 300.4 (2011): C723-C742. PubMed PMID: 21209361. PubMed Central PMCID: PMC3074624.
5. Bindels, Daphne S., et al. "mScarlet: a bright monomeric red fluorescent protein for cellular imaging." Nature Methods 14.1 (2017): 53-56. PubMed PMID: 27869816.
6. Media Cybernetics. Colocalization of Fluorescent Probes.
7. Barbier, Mariette, and F. Heath Damron. "Rainbow Vectors for Broad-Range Bacterial Fluorescence Labeling." PloS one 11.3 (2016): e0146827. PubMed PMID: 26937640. PubMed Central PMCID: PMC4777285.
Further Reading
- Microscopy U. Generfal Considerations when Using Fluorescent Proteins.
- Ruusuvuori, Pekka, et al. "Quantitative analysis of dynamic association in live biological fluorescent samples." PloS one 9.4 (2014): e94245. PubMed PMID: 24728133. PubMed Central PMCID: PMC3984138.
- Microscopy U. Basics of FRET Microscopy.
Additional Resources on the Addgene Blog
- Learn More about Plasmids for Endogenous Gene Tagging in Human Cells
- Check Out the Michael Davidson Fluorescent Protein Collection
- Get Tips for Using FRET
Resources on Addgene.org
- Browse the Allen Institute for Cell Science Plasmid Collection
- Check Out Plasmids for FRET
- Check Out the Fluorescent Protein Guide


Leave a Comment