


This post was written by Angelo Nicolaci, a PhD student at Moffitt Cancer Center.
Before generative AI became part of the popular zeitgeist, structural biologists were already harnessing the power of machine learning to better predict protein structures. These predictions of how proteins fold provide valuable insights about their function and how they interact with other proteins, molecules, and substrates. Experimental methods for determining protein structure — such as X-ray crystallography, cryogenic electron microscopy (cryo-EM), and nuclear magnetic resonance (NMR) spectroscopy — are expensive, slow, and often require specialized expertise. Machine learning tools such as AlphaFold can reduce that expense and let scientists focus on validating prediction models with more accessible methods.
What is AlphaFold?
While a plethora of AI-powered protein structure prediction tools exist, AlphaFold, developed by DeepMind (now Google DeepMind), has become a household name in structural biology. AlphaFold burst onto the scene at the Critical Assessment of Protein Structure Prediction (CASP) in 2018. This community-led event has occurred every two years since 1994 and allows researchers to test their prediction models. In CASP13 (2018), AlphaFold achieved outstanding accuracy for 24 of 43 models it was given (Senior et al., 2020).
The original AlphaFold used a neural network to predict distances between pairs of residues. It then folded the chain by optimizing against those predictions, but its accuracy fell well short of structures determined experimentally. AlphaFold 2 replaced that two-stage approach with the Evoformer, a neural network that now forms the core of the program (see Step 2 in the ‘How does AlphaFold work?’ section). The development of Evoformer was the leap that made predictions rival experimental structures.
The most recent iteration, AlphaFold 3, replaces Evoformer with a simpler module called Pairformer, which relies less on the multiple sequence alignment (MSA) and replaces the structure module with a diffusion model. It also broadens the inputs well beyond a single protein chain, allowing you to model complexes containing proteins, DNA, RNA, small-molecule ligands, ions, and some chemical modifications. In practice, AlphaFold 1 is now purely historical. Essentially, everything you'll encounter runs on either AlphaFold 2 or AlphaFold 3, and which one people choose depends on the job.
AlphaFold at the bench: Prediction and experiment together
The most productive uses of AlphaFold sit right at the interface of experimental planning and execution. Predictions work best as starting points for answering questions, but they still require experimental validation.
AlphaFold can now shape the preliminary steps of protein design. Molecular biologists use predictions to decide where to trim disordered termini before cloning into an expression plasmid, to pick domain boundaries that won’t cut through a fold, and to place linkers or purification tags where they’re less likely to interfere with function. A well-chosen construct boundary can determine whether a protein expresses and purifies at all, which can be the difference between advancing a project and a dead end.
Predicted structures also guide the functional experiments that follow. They can help you decide which residues to mutate to test a proposed active site, where to place cysteines for crosslinking or labeling, which surface a binding partner most plausibly uses, and how a disease variant might impact function. In crystallography, known structures of generated models are often used as references to help determine new protein structures. Predicted models have rescued datasets that sat unsolved for years by providing a feasible starting point for structure determination. This includes cases where no suitable homolog existed in the Protein Data Bank (PDB) and experimental phasing had failed.
Notice the pattern in all of these: the prediction does preparatory work. It narrows the options, shortens the list, and tells you where to look. The experiment then does something the prediction could not; it shows you the ligand, the conformation, the modification, or the surprise. That loop (predict, test, and feed what you learn back into the next round) has become the modern structural biology workflow, made more efficient by programs like AlphaFold.
How does AlphaFold work?
AlphaFold predictions run off a neural network. You don't need to understand every detail to use it well, but knowing the basics will help you understand why it works beautifully for some proteins and struggles with others.
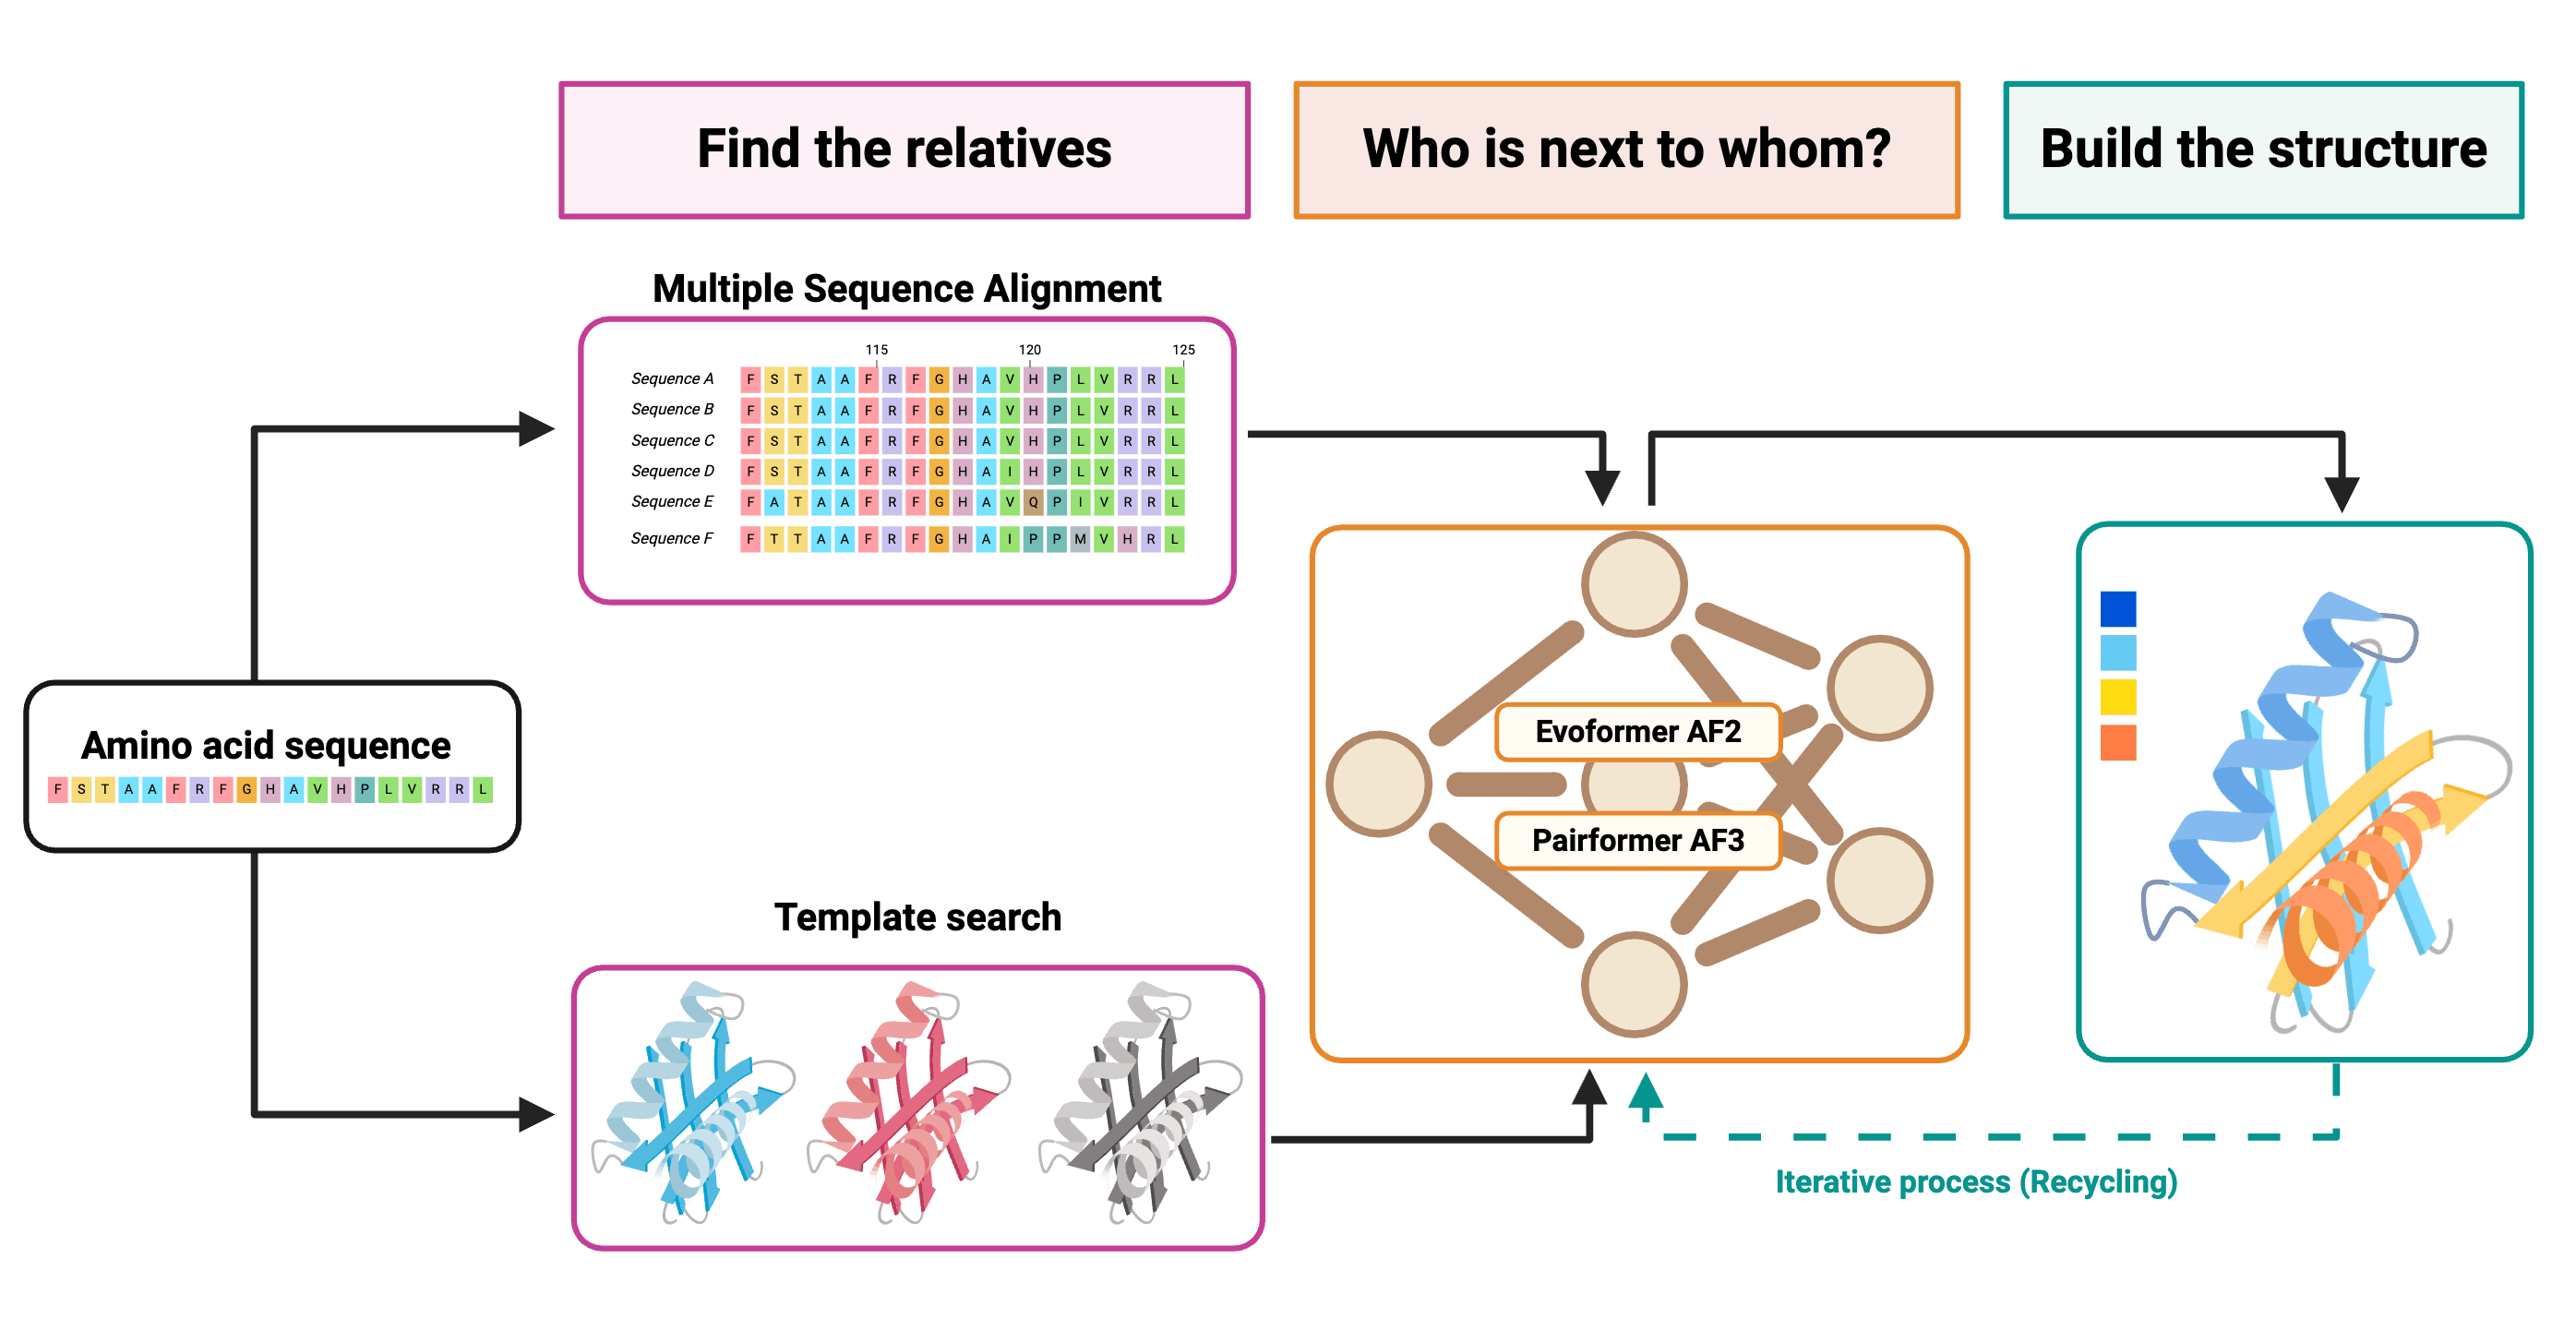 |
| Figure 1: Simplified overview of the AlphaFold pipeline. The process beings by inputting an amino acid sequence. Then the model conducts a multiple sequence alignment (MSA) and template search in known databases (UnitProt). The neural networks — either Evoformer for AlphaFold 2 or Pairformer for AlphaFold 3 — then map out how the residues relate to each other in space and build a predicted structure. This structure is further refined in an iterative process. Created with BioRender.com. |
Step 1: Find the protein relatives
AlphaFold starts by searching huge sequence databases for proteins with sequences similar to yours and lines them up in an MSA. This alignment matters because of coevolution. If two residues touch each other in the folded protein, a mutation in one is often balanced by a mutation in the other over evolutionary time. Patterns of residues that change together hint at which parts of the chain sit closely in 3D.
Step 2: Figure out who is next to whom
The core of AlphaFold 2 is a network called the Evoformer (AlphaFold 3 uses the Pairformer). It passes information back and forth between the MSA and a “pair representation,” essentially a map of how every residue relates to every other residue. Over many layers, it refines its guess about which residues are near each other and how they are oriented in space.
Step 3: Build the structure
The structure module turns that information into 3D coordinates for the backbone and side chains of your protein. The whole prediction is then fed back through the network a few more times (called recycling) to polish the result.
Luckily, AlphaFold carries out all of these steps for you. Your job is simply to provide the basic information of your protein of interest — at minimum, the amino acid sequence. Input the information, and the machines handle the rest! Then, you’ll end up with a series of predictions ranked by score.
Reading your prediction
So, your prediction is done. Now what? The most important thing to know is that every AlphaFold model comes with its own confidence scores. Always check them before drawing conclusions.
pLDDT (predicted local distance difference test)
pLDDT is a per-residue score from 0 to 100 describing how confident AlphaFold is about the local structure around each residue (Figure 2A).
- Above 90 (dark blue): Very high confidence. Backbone and side chains are usually accurate.
- 70–90 (light blue): Confident. The backbone is likely correct.
- 50–70 (yellow): Low confidence. Interpret with caution.
- Below 50 (orange): Very low confidence. These regions are often intrinsically disordered, and the “structure” shown should not be trusted.
Those long, extended loops that wrap loosely around your protein? They are usually low-pLDDT regions where AlphaFold is essentially telling you it doesn't know how to place them.
PAE (predicted aligned error)
pLDDT tells you whether each piece looks right, but not whether the pieces are arranged correctly relative to one another. That's the PAE plot's job: it shows the expected position error between every pair of residues. Dark green squares along the diagonal usually mark well-defined domains. If the area between two domains is light green, AlphaFold isn't sure how those domains sit relative to each other, even if each one alone looks great. A great example for this is the tumor suppressor protein p53 — famously referred to as the Guardian of the Genome (Figure 2B).
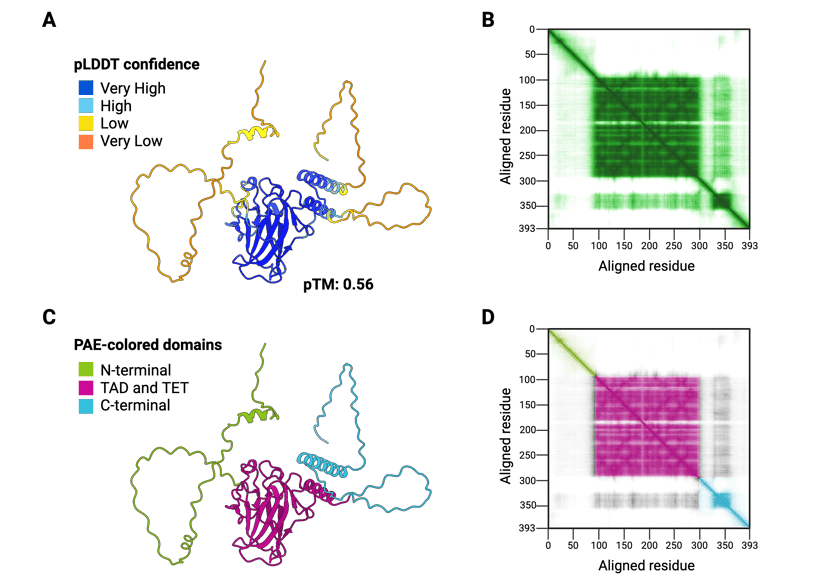 |
| Figure 2: (A) Predicted structure of the tumor suppressor p53 colored by pLDDT, from dark blue (very high confidence) to orange (very low confidence). (B) Example PAE plot for p53. (C) Predicted structure of p53 colored by domain boundaries determined by the PAE plot. (D) Pseudo-coloring of the PAE plot to show the related domain boundaries from panel C. Protein structures visualized using UCSF ChimeraX. Created with BioRender.com. |
pTM and ipTM
Both scores are predictions of the template modeling (pTM) score, a measure of how well the model would superimpose onto the true structure if you had it. Unlike pLDDT, which is local, these are global: pTM asks whether the overall fold and domain arrangement are right for the whole prediction. pTM runs from 0 to 1, with values above about 0.5 indicating that the model probably has the correct overall fold.
For complexes (Figure 3), ipTM (interface pTM) applies the same idea only to the residues at the interface between chains, so it tells you whether the subunits are docked correctly rather than whether each one folded correctly. This is the number to look at when you predict a complex. Scores above ~0.8 generally indicate a reliable interface, while scores below about 0.6 suggest the prediction likely failed; scores in between are uncertain and deserve experimental follow-up.
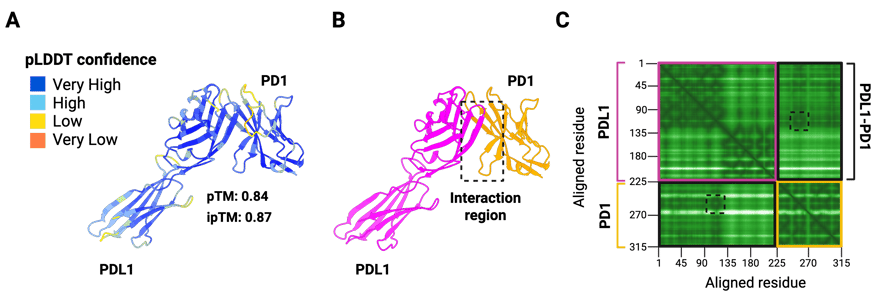 |
| Figure 3: (A) Predicted structure of the PDL1-PD1 complex colored by pLDDT confidence. (B) Same prediction structure colored by protein chain (PDL1 pink, PD1 yellow). (C) PAE plot of the PDL1-PD1 complex. Colored boxes indicate the regions for each part of the complex (PDL1 pink, PD1 yellow, and the interaction of PDL1-PD1 black). Protein structures visualized using UCSF ChimeraX. Created with BioRender.com. |
The two can disagree in informative ways. A high pTM with a low ipTM usually means AlphaFold folded each protein well but couldn't fit them together. This usually tells you that a complex is unlikely to actually form.
AlphaFold has not solved protein folding
AlphaFold did not solve protein folding, and it did not make experimental structural biology obsolete.
What AlphaFold solved is a specific and enormously useful version of the problem, “given a sequence with evolutionary relatives, predict a plausible folded structure.” That is a genuine breakthrough, and it earned Demis Hassabis and John Jumper a share of the 2024 Nobel Prize in Chemistry. However, prediction is not determination. A predicted model contains no experimental evidence — nobody measured anything. Yet it is an extremely well-informed hypothesis, and hypotheses are great starting points for discovery.
These high-accuracy prediction models still have practical limitations:
- One snapshot only. Proteins move. Transporters, receptors, and enzymes cycle between conformations, but AlphaFold usually gives you one, and not always the one you care about.
- Point mutations. AlphaFold was not trained to predict how a single substitution changes stability or folding. A badly destabilizing mutation will often produce a nearly identical model.
- Missing partners. AlphaFold 2 does not model ligands, cofactors, metals, lipids, or post-translational modifications. AlphaFold 3 handles many of these, but accuracy varies and it will not tell you about the ones you forgot to include.
- Few evolutionary relatives. Orphan proteins, rapidly evolving sequences (such as viral proteins), and de novo designed proteins have shallow MSAs and tend to give lower-confidence predictions.
- Antibody-antigen interfaces. While AlphaFold can help in antibody development, it is still learning how to better predict antibody-antigen interfaces. These interactions are shaped by somatic hypermutation rather than coevolution, so predicting how an antibody or single-domain antibody (nanobody) binds its target remains difficult.
- No mechanism. AlphaFold tells you nothing about the folding pathway, the energy landscape, or the physical chemistry of how a chain finds its fold. The underlying biophysical problem remains unsolved.
These limitations are why X-ray crystallography, cryo-EM, and NMR are not outdated. Experimental methods are still what resolve ligand-bound states, catch transient intermediates, define a drug's binding pose at the resolution medicinal chemistry needs, reveal post-translational modifications, and show you the range of complexes and conformations a protein adopts.
(Alpha)Folding into the future
AlphaFold models are a strong starting point, but they don't provide a complete picture. For example, in drug discovery projects, the models don’t give you binding affinity, oral bioavailability, or developability. Every prediction needs experimental validation. In this way, AlphaFold has changed what an experiment is for. AlphaFold has become part of the background infrastructure of molecular biology, and in doing so it has made careful experimental structural biology more valuable, not less. Fewer projects now exist to answer, “what does this protein look like?” and more exist to answer, “what is this protein doing, with what bound, in which state, and why?” Those are better questions, and answering them can provide functional, actionable solutions to real-world problems.
A few years ago, simply getting a model of your protein was an achievement. But with AI-based structure prediction tools like AlphaFold, structure prediction stopped being the destination. Now it's the starting point for experimentation and seeking useful answers.
 Angelo Nicolaci is a PhD candidate in the lab of Jennifer Binning at Moffitt Cancer Center in Tampa, Florida. His projects focus on using yeast display, structural biology, and protein engineering to develop antibody-based cancer therapeutics.
References and Resources
References
Abramson, J., Adler, J., Dunger, J., Evans, R., Green, T., Pritzel, A., Ronneberger, O., Willmore, L., Ballard, A. J., Bambrick, J., Bodenstein, S. W., Evans, D. A., Hung, C., O’Neill, M., Reiman, D., Tunyasuvunakool, K., Wu, Z., Žemgulytė, A., Arvaniti, E., . . . Jumper, J. M. (2024). Accurate structure prediction of biomolecular interactions with AlphaFold 3. Nature, 630(8016), 493–500. https://doi.org/10.1038/s41586-024-07487-w
Bertoni, D., Tsenkov, M., Magana, P., Nair, S., Pidruchna, I., Afonso, M. Q. L., Midlik, A., Paramval, U., Lawal, D., Tanweer, A., Last, M., Patel, R., Laydon, A., Lasecki, D., Dietrich, N., Tomlinson, H., Žídek, A., Green, T., Kovalevskiy, O., . . . Velankar, S. (2025). AlphaFold Protein Structure Database 2025: a redesigned interface and updated structural coverage. Nucleic Acids Research, 54(D1), D358–D362. https://doi.org/10.1093/nar/gkaf1226
Jumper, J., Evans, R., Pritzel, A., Green, T., Figurnov, M., Ronneberger, O., Tunyasuvunakool, K., Bates, R., Žídek, A., Potapenko, A., Bridgland, A., Meyer, C., Kohl, S. a. A., Ballard, A. J., Cowie, A., Romera-Paredes, B., Nikolov, S., Jain, R., Adler, J., . . . Hassabis, D. (2021). Highly accurate protein structure prediction with AlphaFold. Nature, 596(7873), 583–589. https://doi.org/10.1038/s41586-021-03819-2
Meng, E. C., Goddard, T. D., Pettersen, E. F., Couch, G. S., Pearson, Z. J., Morris, J. H., & Ferrin, T. E. (2023). UCSF ChimeraX : Tools for structure building and analysis. Protein Science, 32(11), e4792. https://doi.org/10.1002/pro.4792
Mirdita, M., Schütze, K., Moriwaki, Y., Heo, L., Ovchinnikov, S., & Steinegger, M. (2022). ColabFold: making protein folding accessible to all. Nature Methods, 19(6), 679–682. https://doi.org/10.1038/s41592-022-01488-1
Senior W.A., Evans, R., Jumper, J., Kirkpatrick, J., Sifre, L., Green, T., Qin, C., Žídek, A., Nelson, A. W. R., Bridgland, A., Penedones, H., Petersen, S., Simonyan, K., Crossan, S., Kohli, P., Jones, D. T., Silver, D., Kavukcuoglu, K., & Hassabis, D. (2020). Improved protein structure prediction using potentials from deep learning. Nature, 577(7792), 706–710. https://doi.org/10.1038/s41586-019-1923-7
Varadi, M., Anyango, S., Deshpande, M., Nair, S., Natassia, C., Yordanova, G., Yuan, D., Stroe, O., Wood, G., Laydon, A., Žídek, A., Green, T., Tunyasuvunakool, K., Petersen, S., Jumper, J., Clancy, E., Green, R., Vora, A., Lutfi, M., . . . Velankar, S. (2021). AlphaFold Protein Structure Database: massively expanding the structural coverage of protein-sequence space with high-accuracy models. Nucleic Acids Research, 50(D1), D439–D444. https://doi.org/10.1093/nar/gkab1061
External Resources
- AlphaFold Protein Structure Database — open source database managed by EMBL-EBI, providing open access to over 200 million protein structure predictions covering most of UniProt
- ColabFold — a community-built version of AlphaFold 2 that runs in Google Colab notebooks
- AlphaFold Server — a free web interface for AlphaFold 3 for non-commercial use
- AlphaFold 3 — GitHub code is available for local installation for academic use
Resources on the Addgene blog
- Plasmids 101: Protein Expression
- Celebrating the 2024 Nobel Prize in Chemistry
- 3D Printing Meets CRISPR Cas9
- Split Fluorescent Proteins for Studying Protein-Protein Interactions
Resources on addgene.org
Topics: Molecular Biology Protocols and Tips, Other Plasmid Tools, Protein Expression and Purification



Leave a Comment