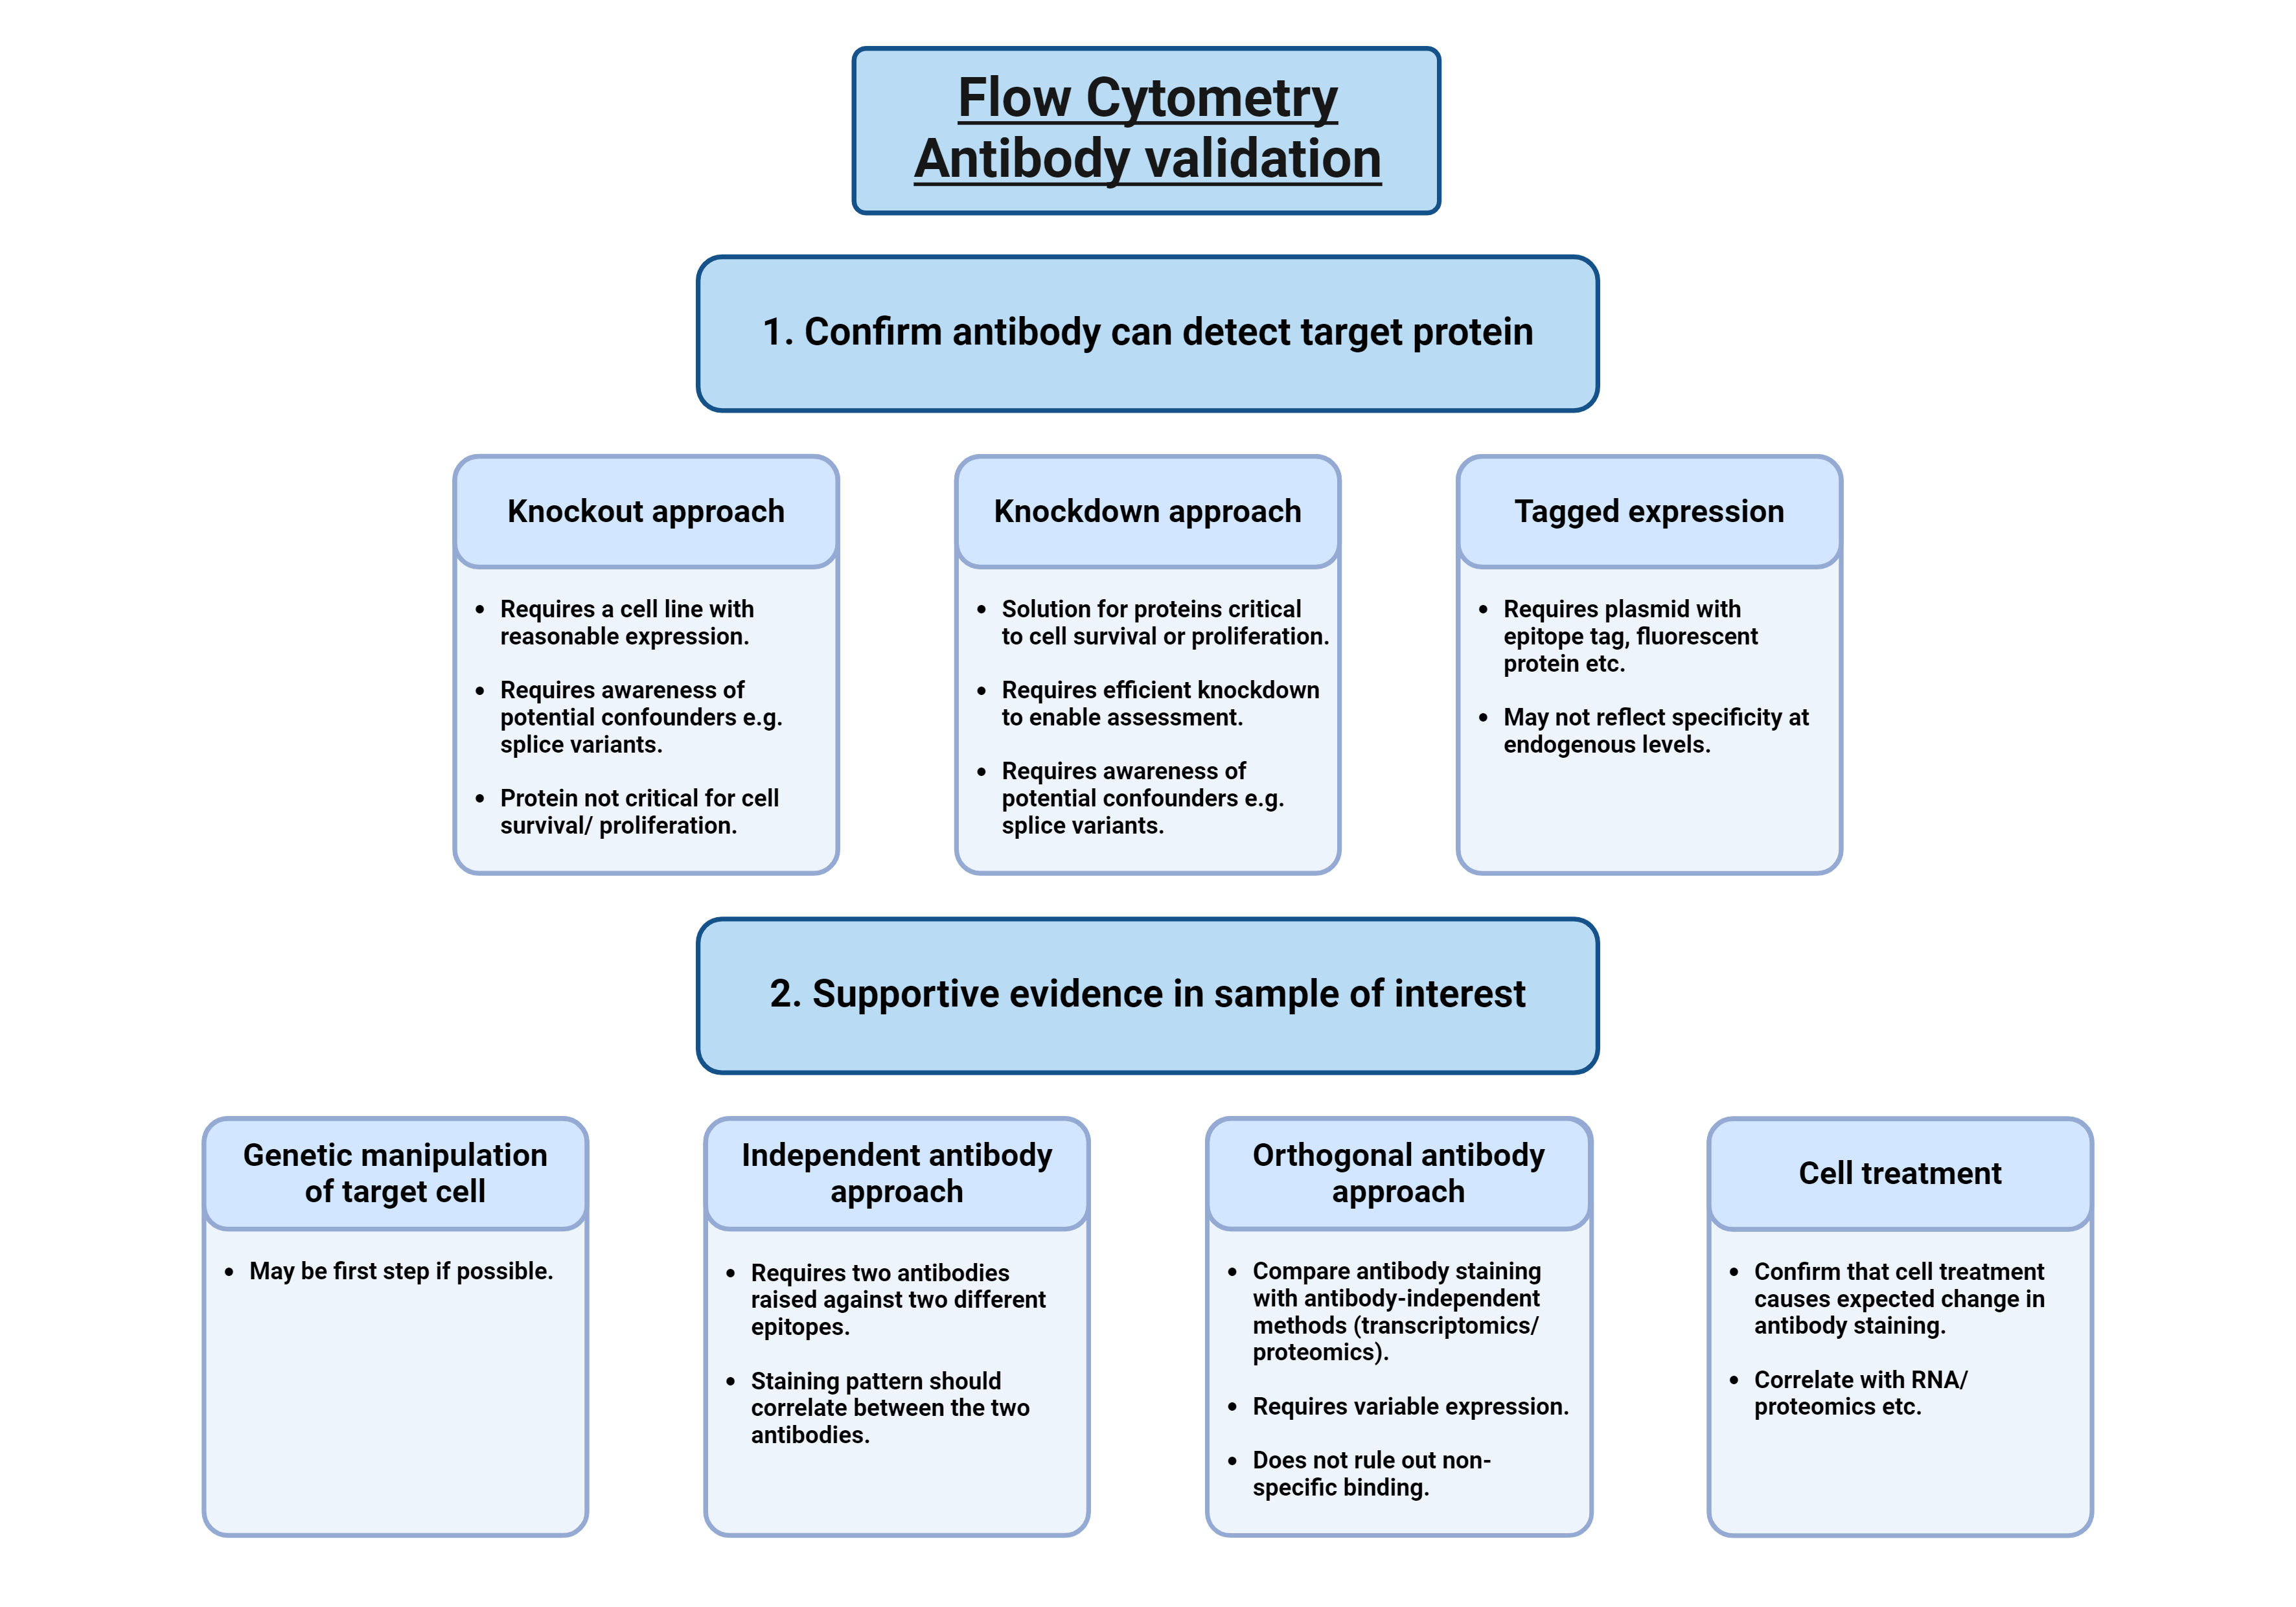
Antibody validation is to confirm (or refute) that the antibody is selectively detecting the target-of-interest in your assay and sample-of-interest. The approaches available broadly map onto the five pillars of antibody validation (see: Uhlen et al., 2016). In this post, we ...
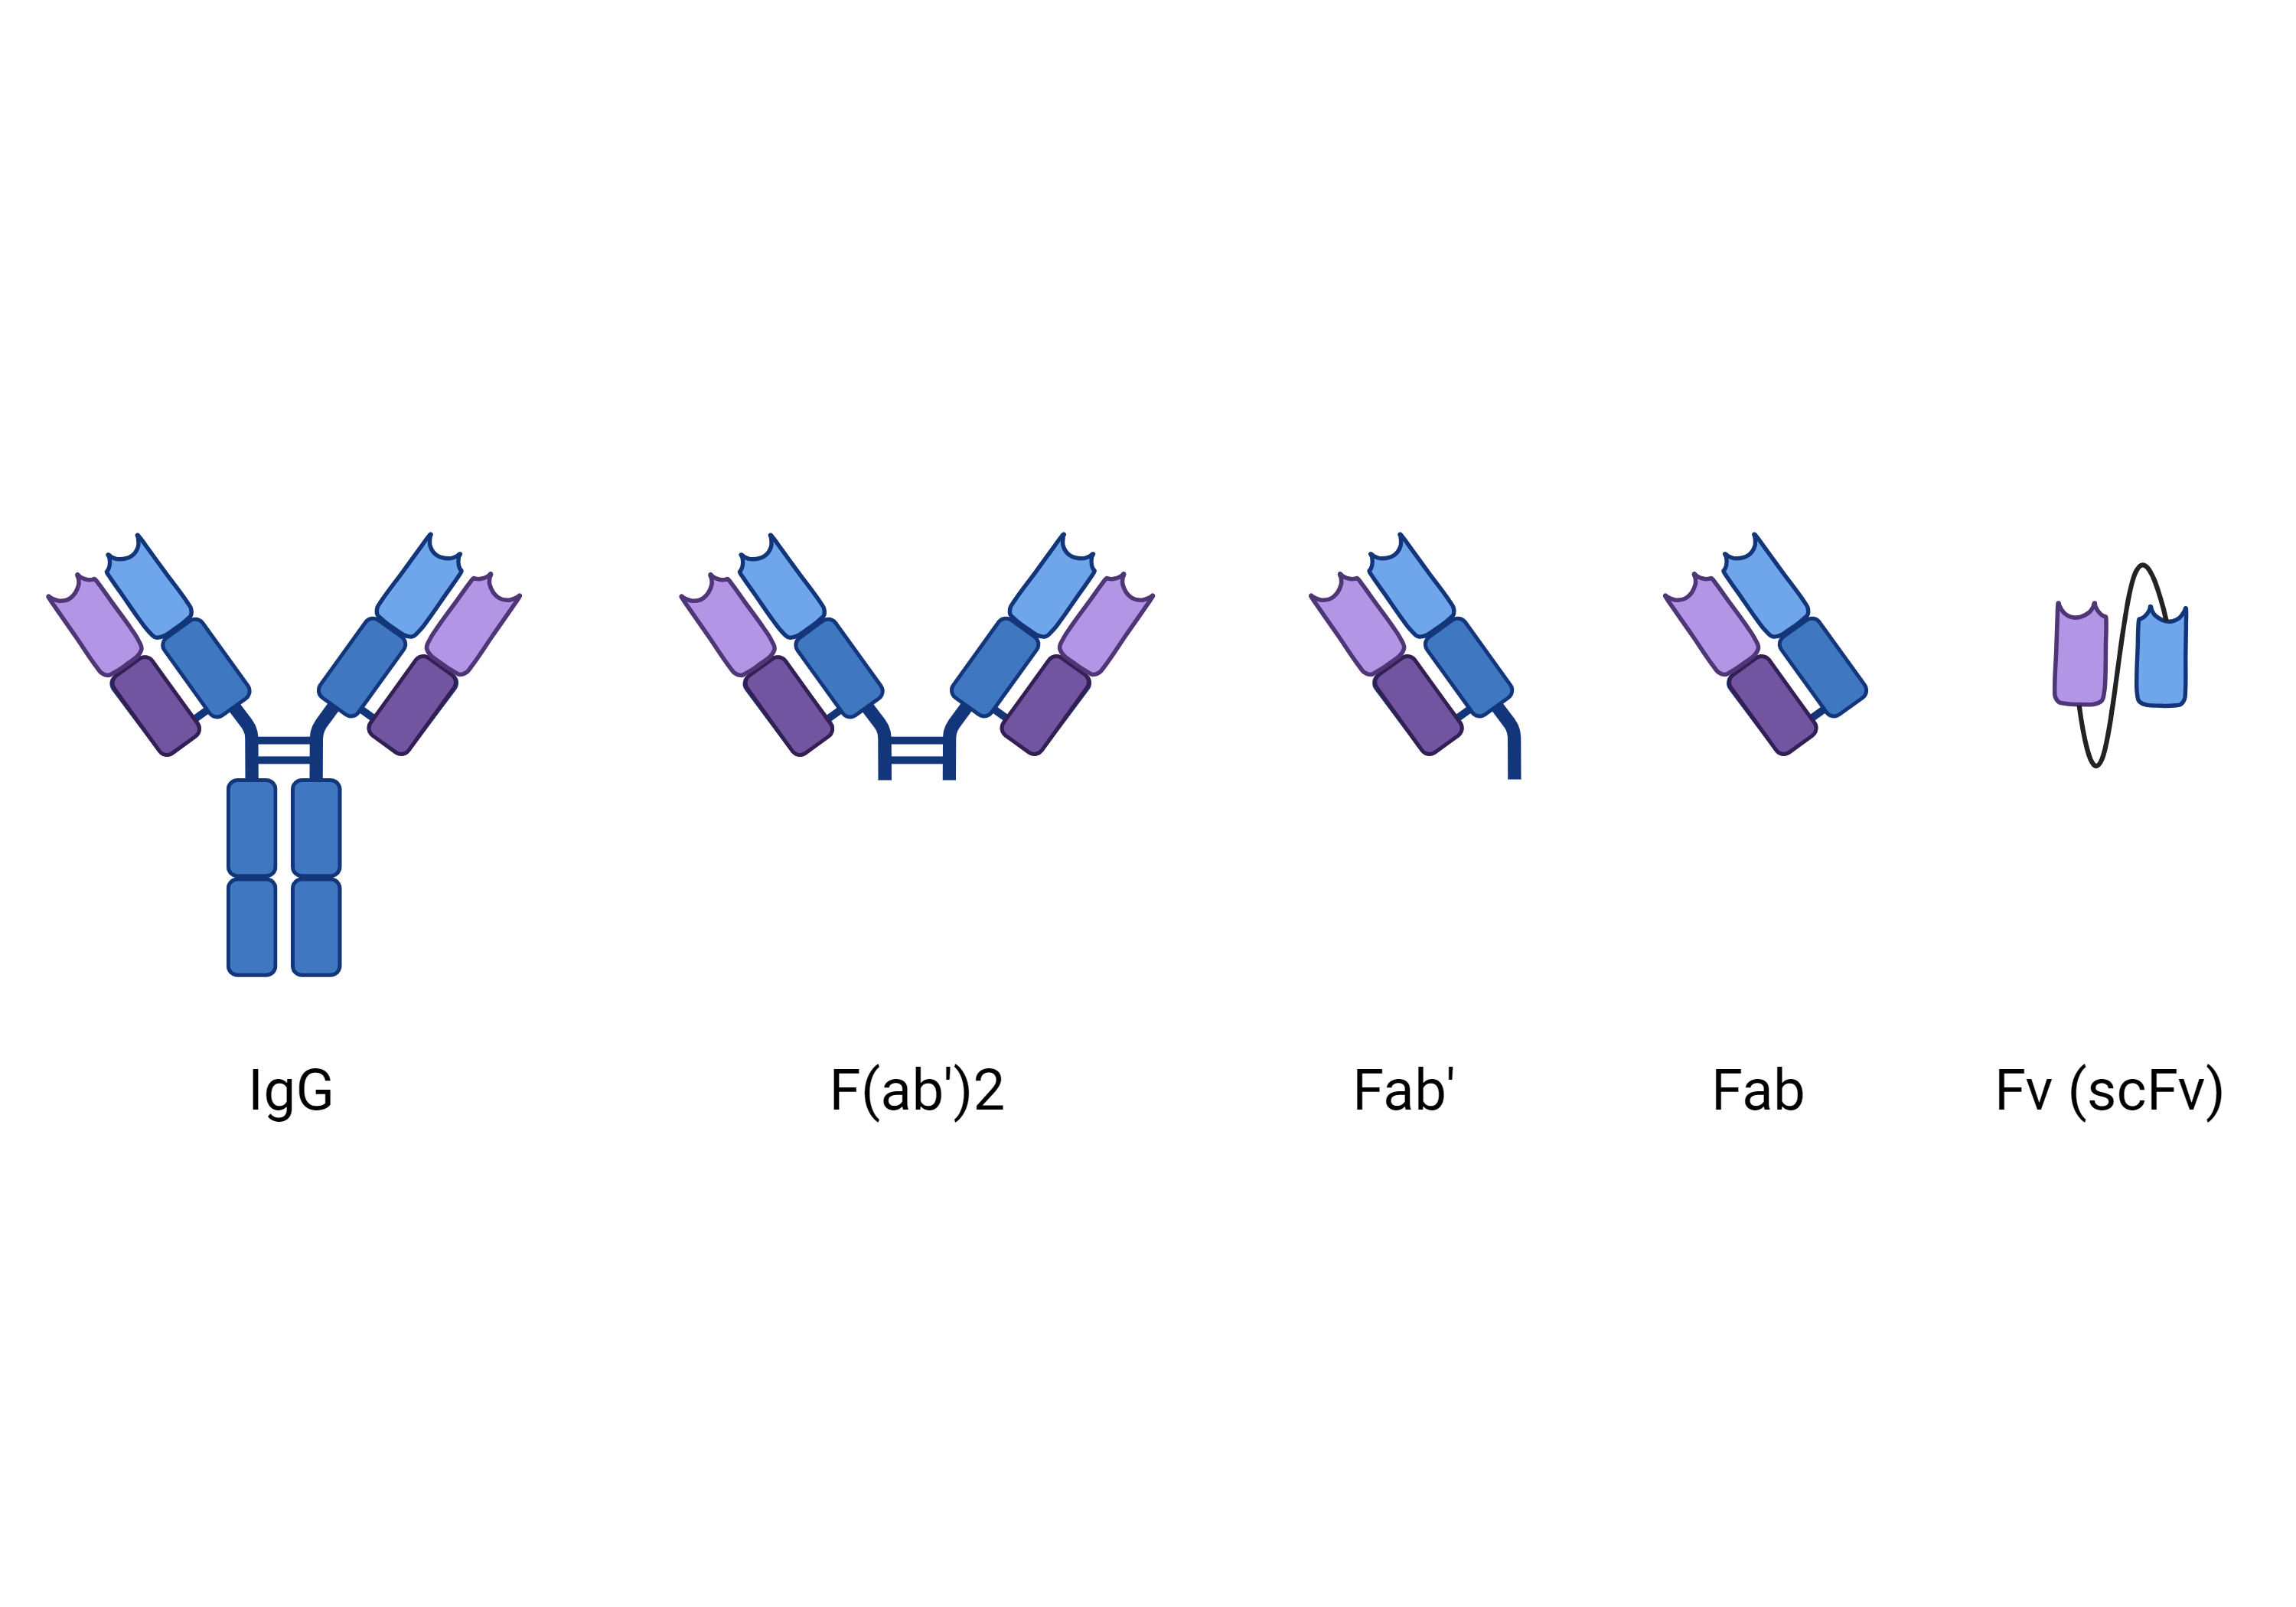
Imagine an antibody. Do you immediately visualize a Y-shaped protein reminiscent of the Addgene mascot Abi? If so, you are not alone. Full-sized antibodies dominate the world of research affinity reagents, and for good reason. However, sometimes you want a tool that is a little ...
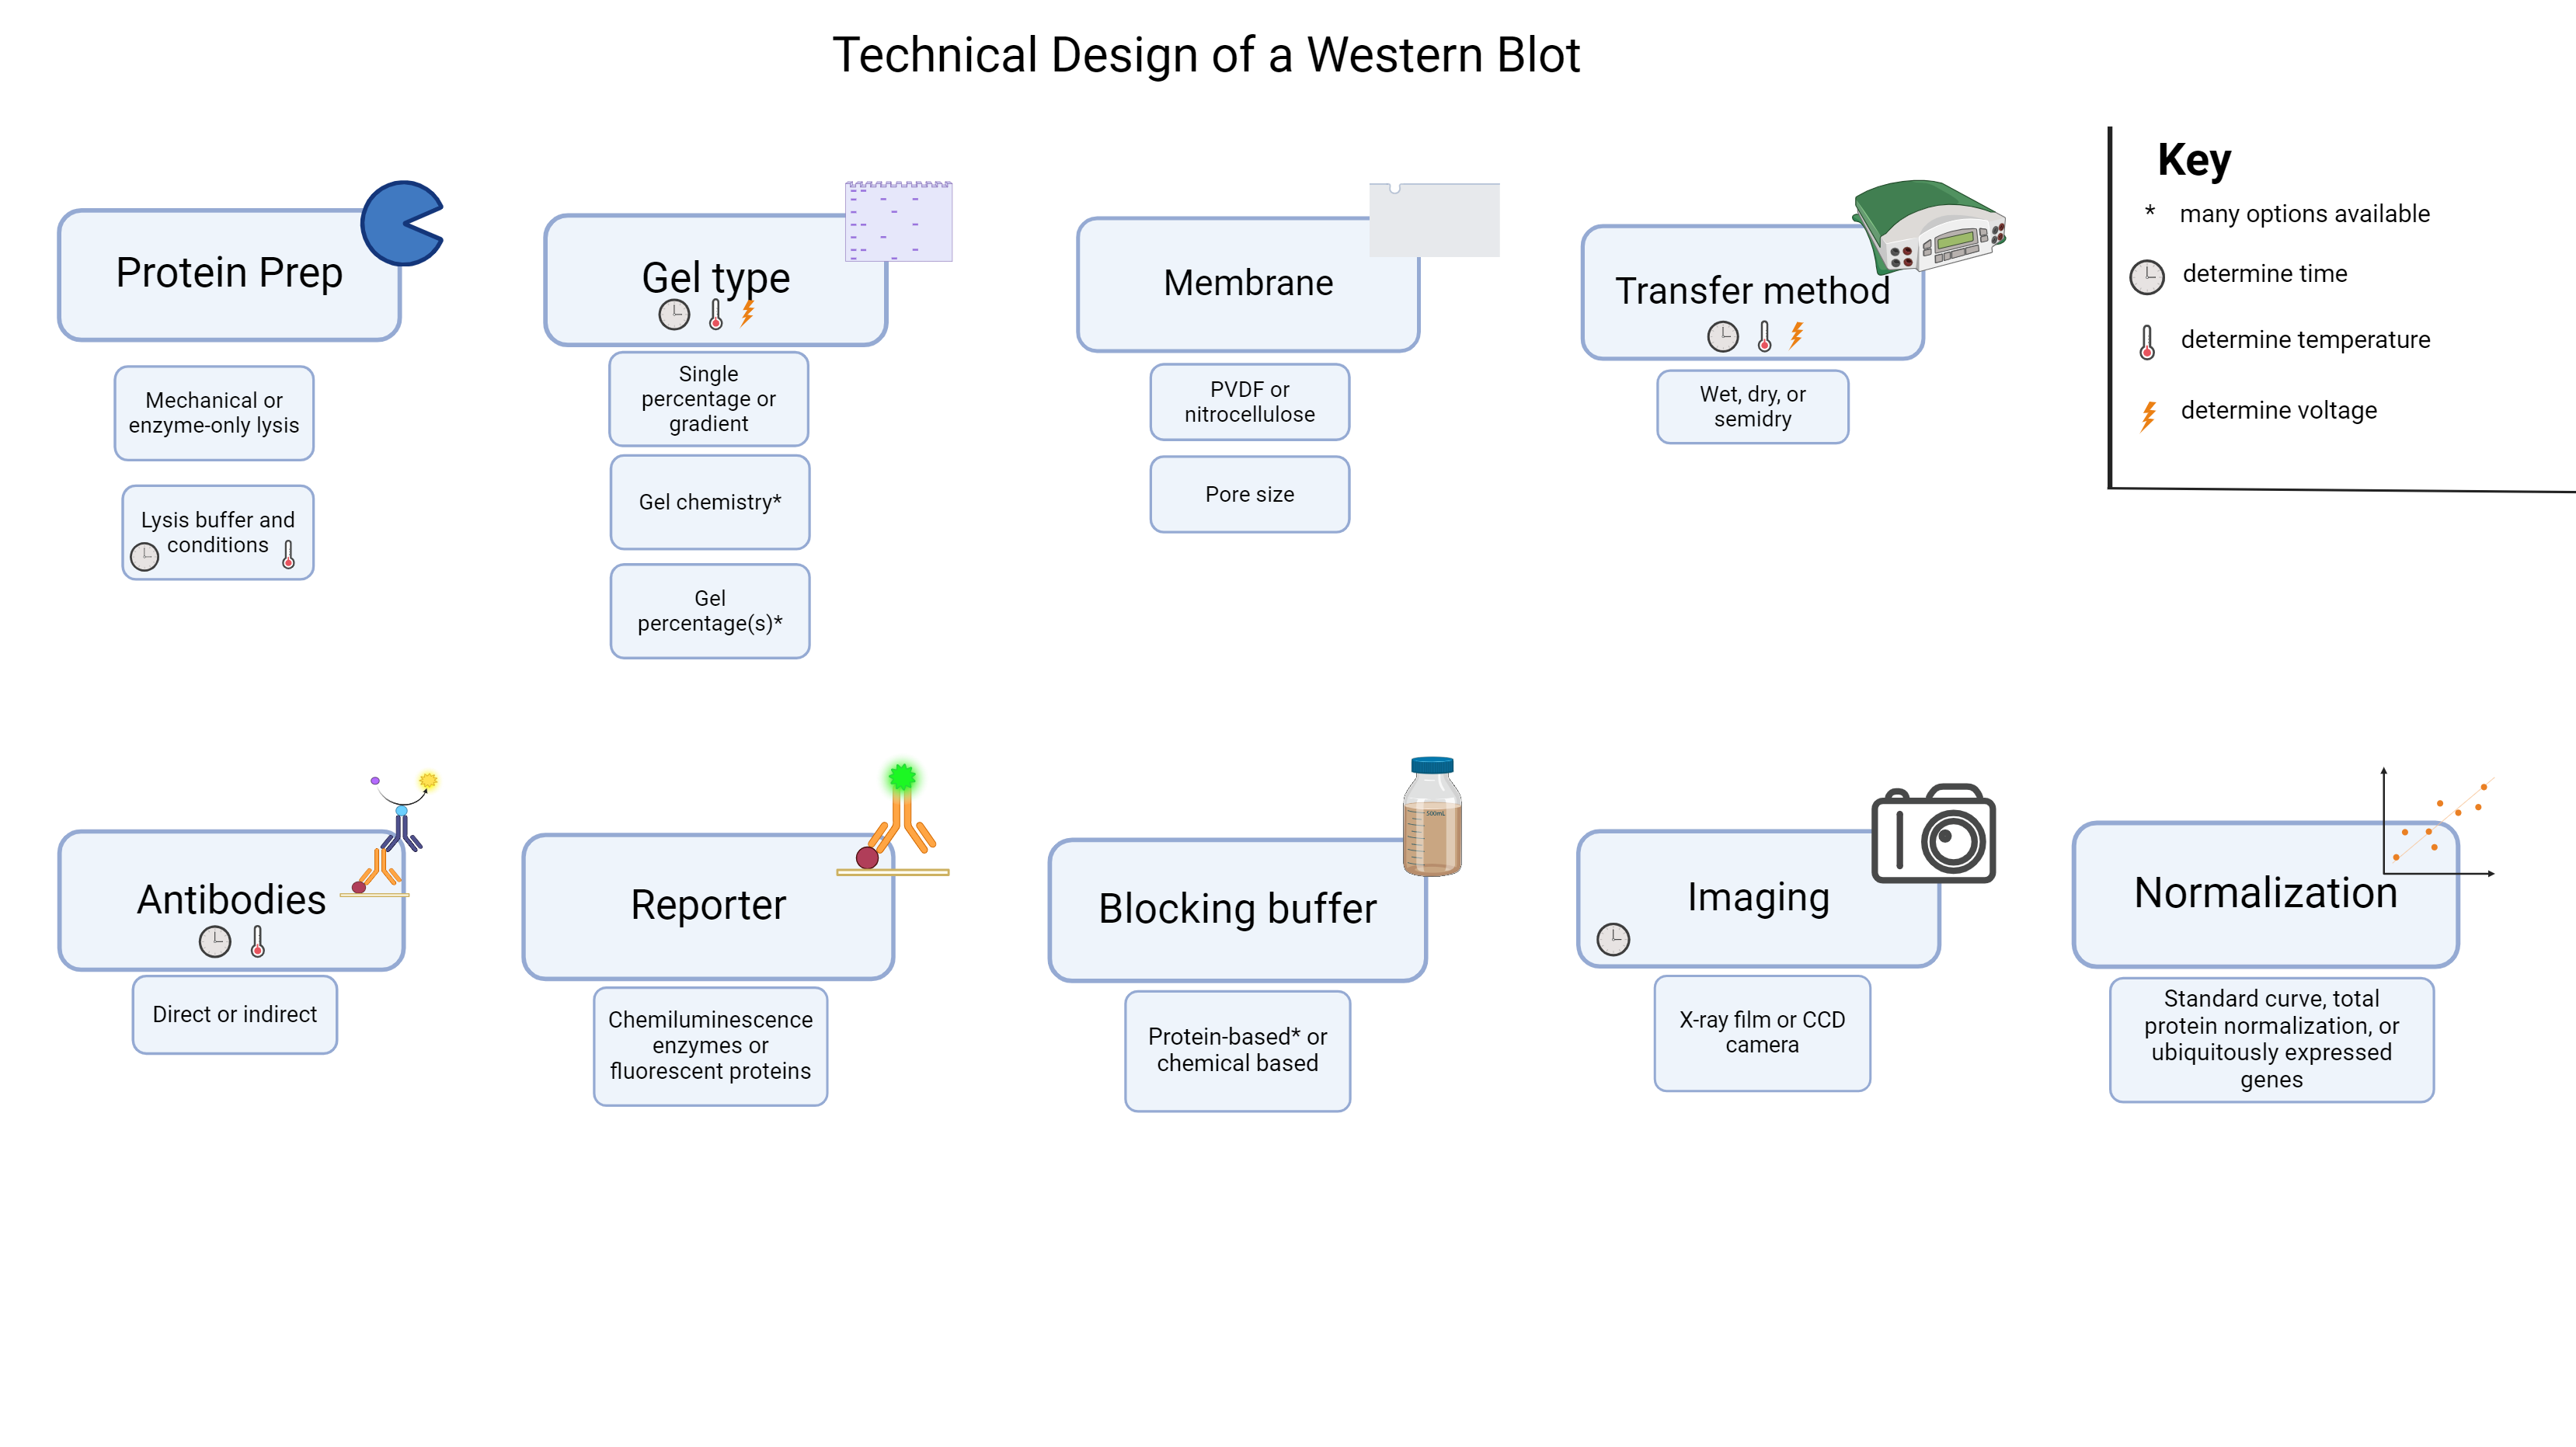
If you’ve ever run a western blot, or thought about running one, you’ll know there’s a lot of choices to make when designing the experiment. What detection method? What membrane? What should you block with?
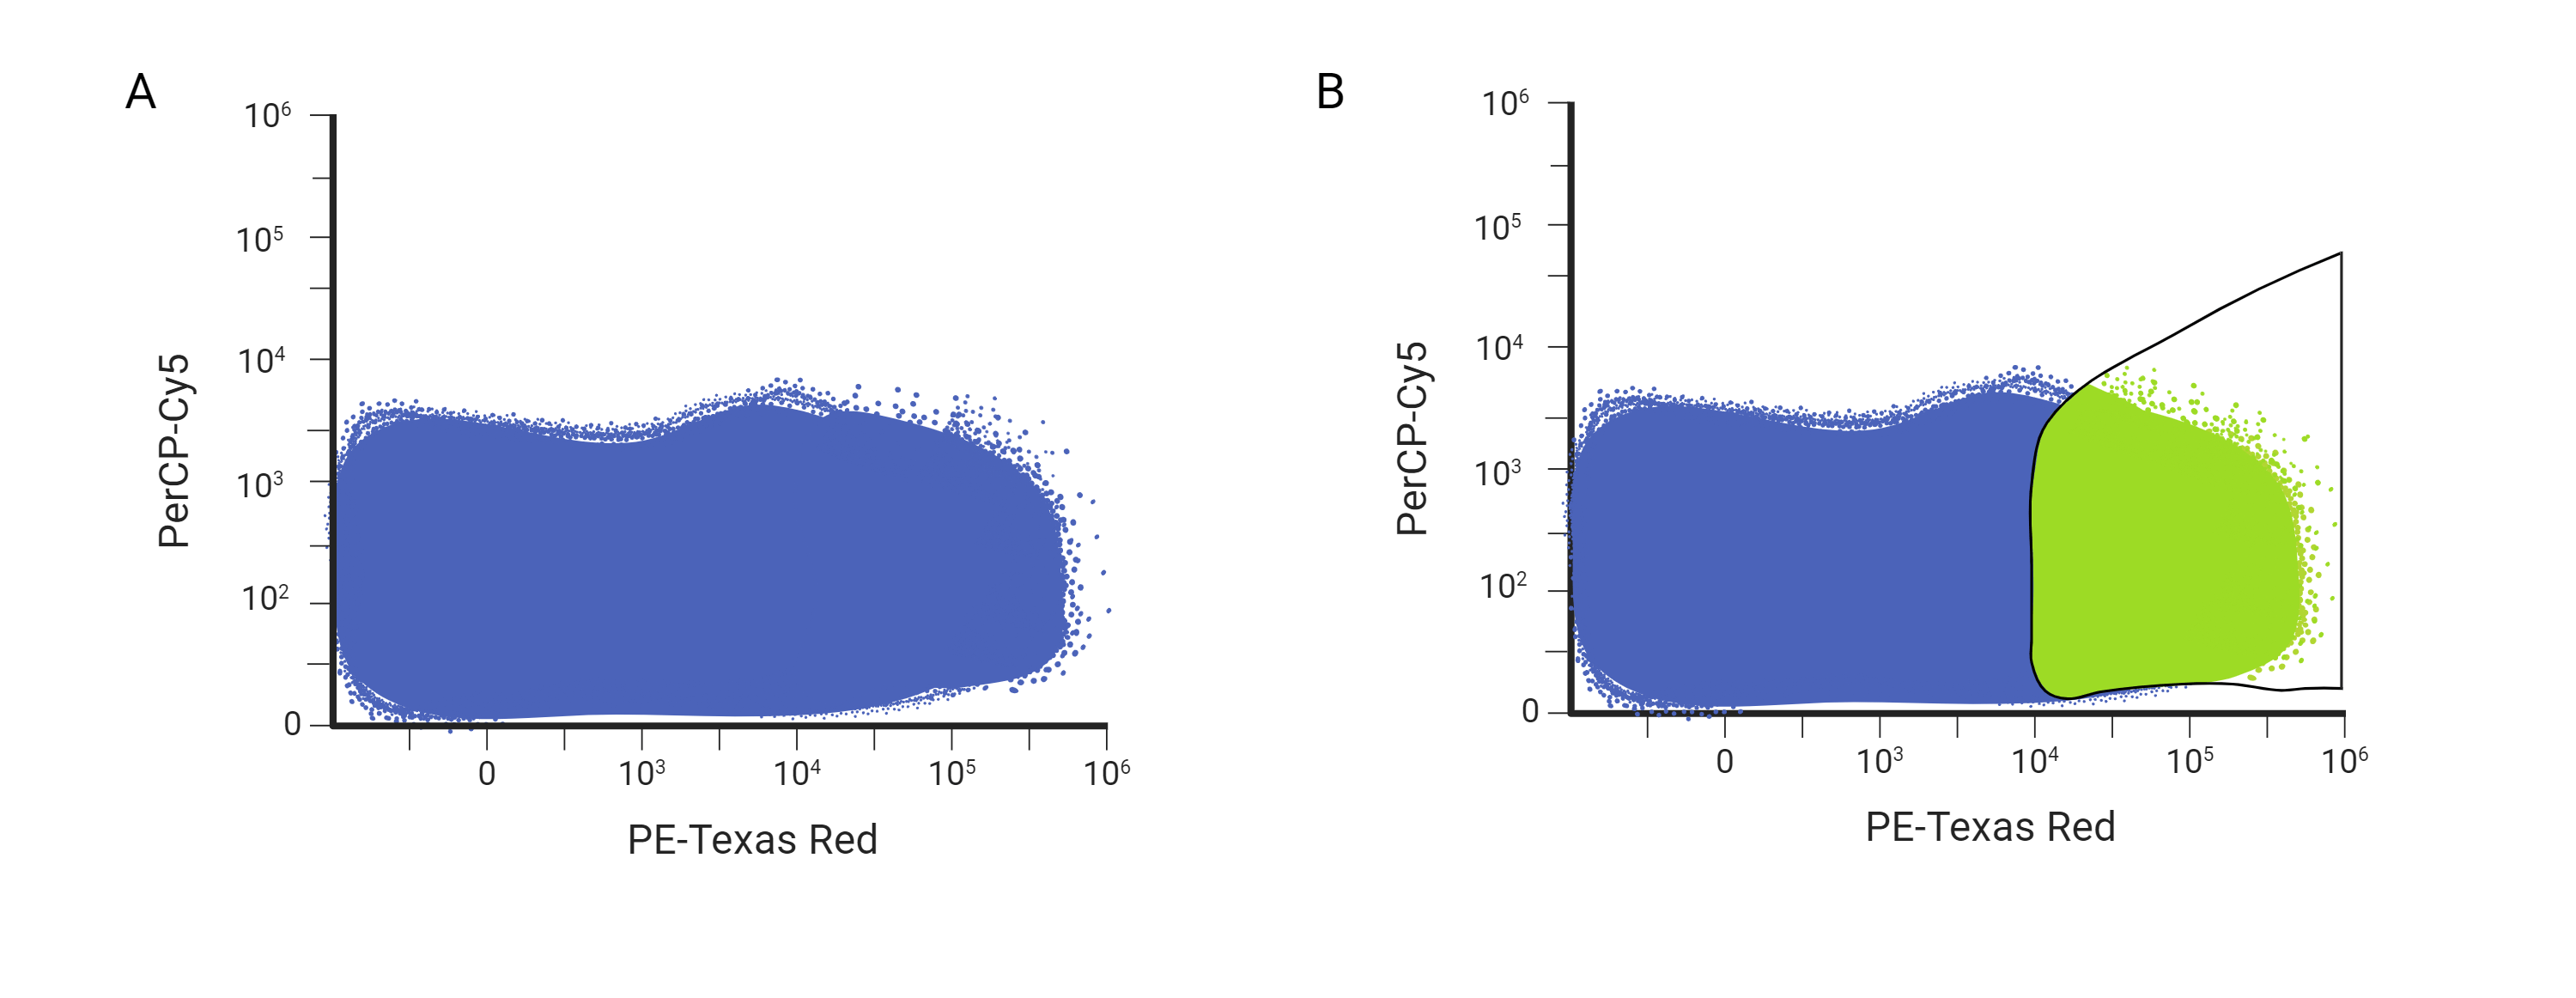
Now that you know how to read flow plots and have designed your first flow panel, you’ll load your samples into the cytometer and see one of two results for your antibody of interest: two clear populations or a huge smear across your FSH vs reporter plot. In this post, I’ll walk ...
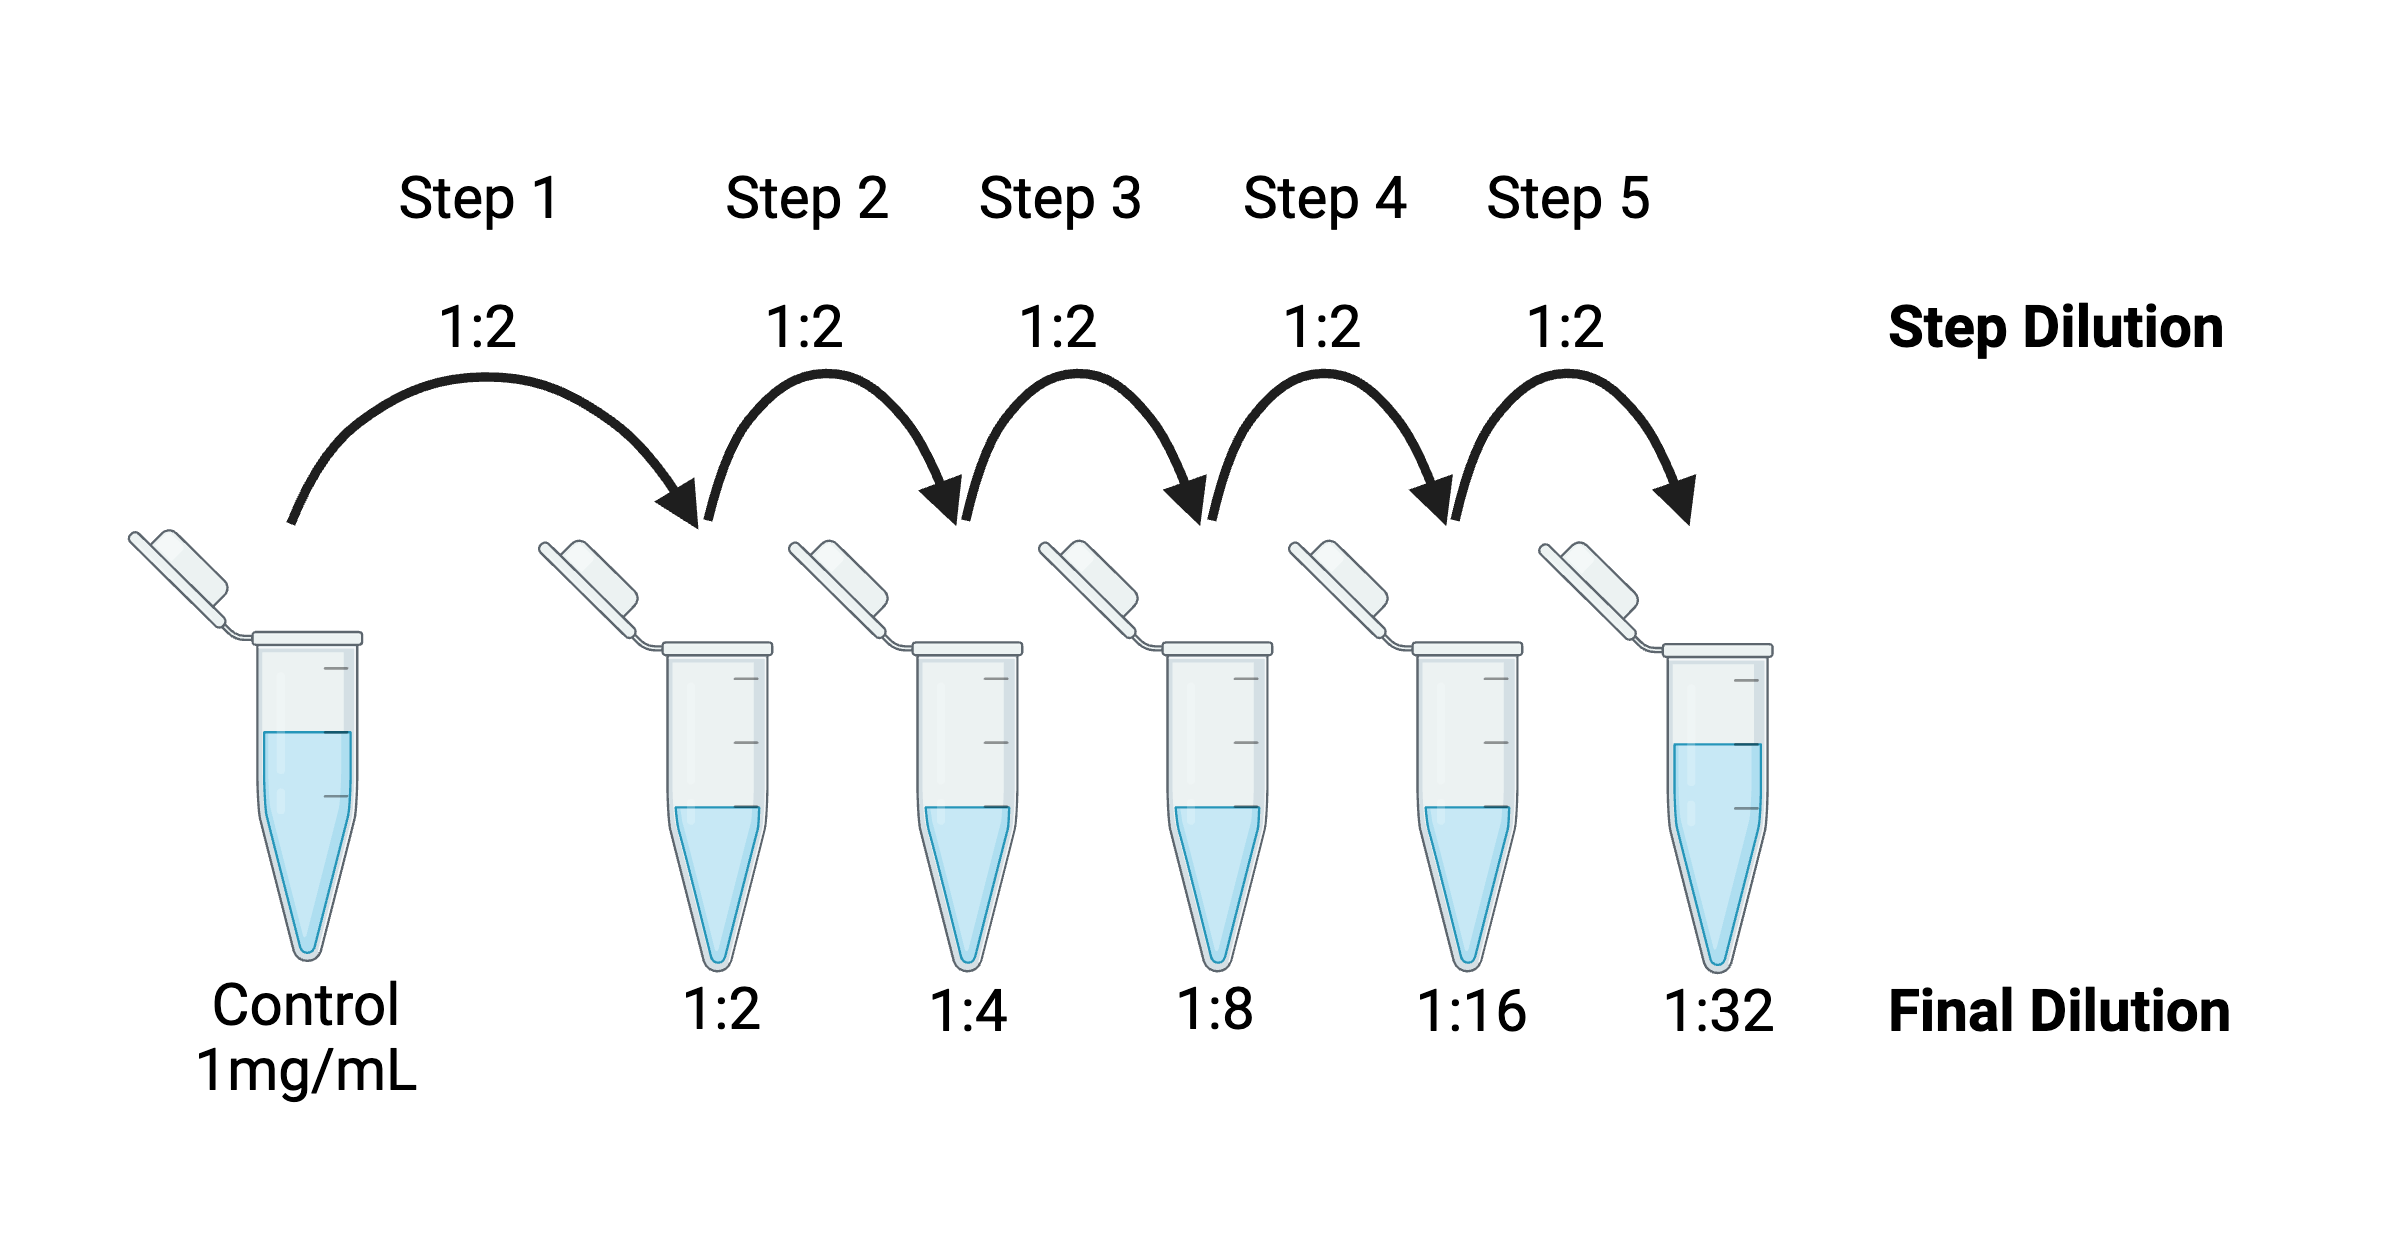
What do a viral vector production facility, food allergy testing lab, and the grad student down the hall from you have in common? All of them rely on standard curves in their day-to-day work. Indeed, viral vector production facilities frequently use qPCR with a standard curve to ...
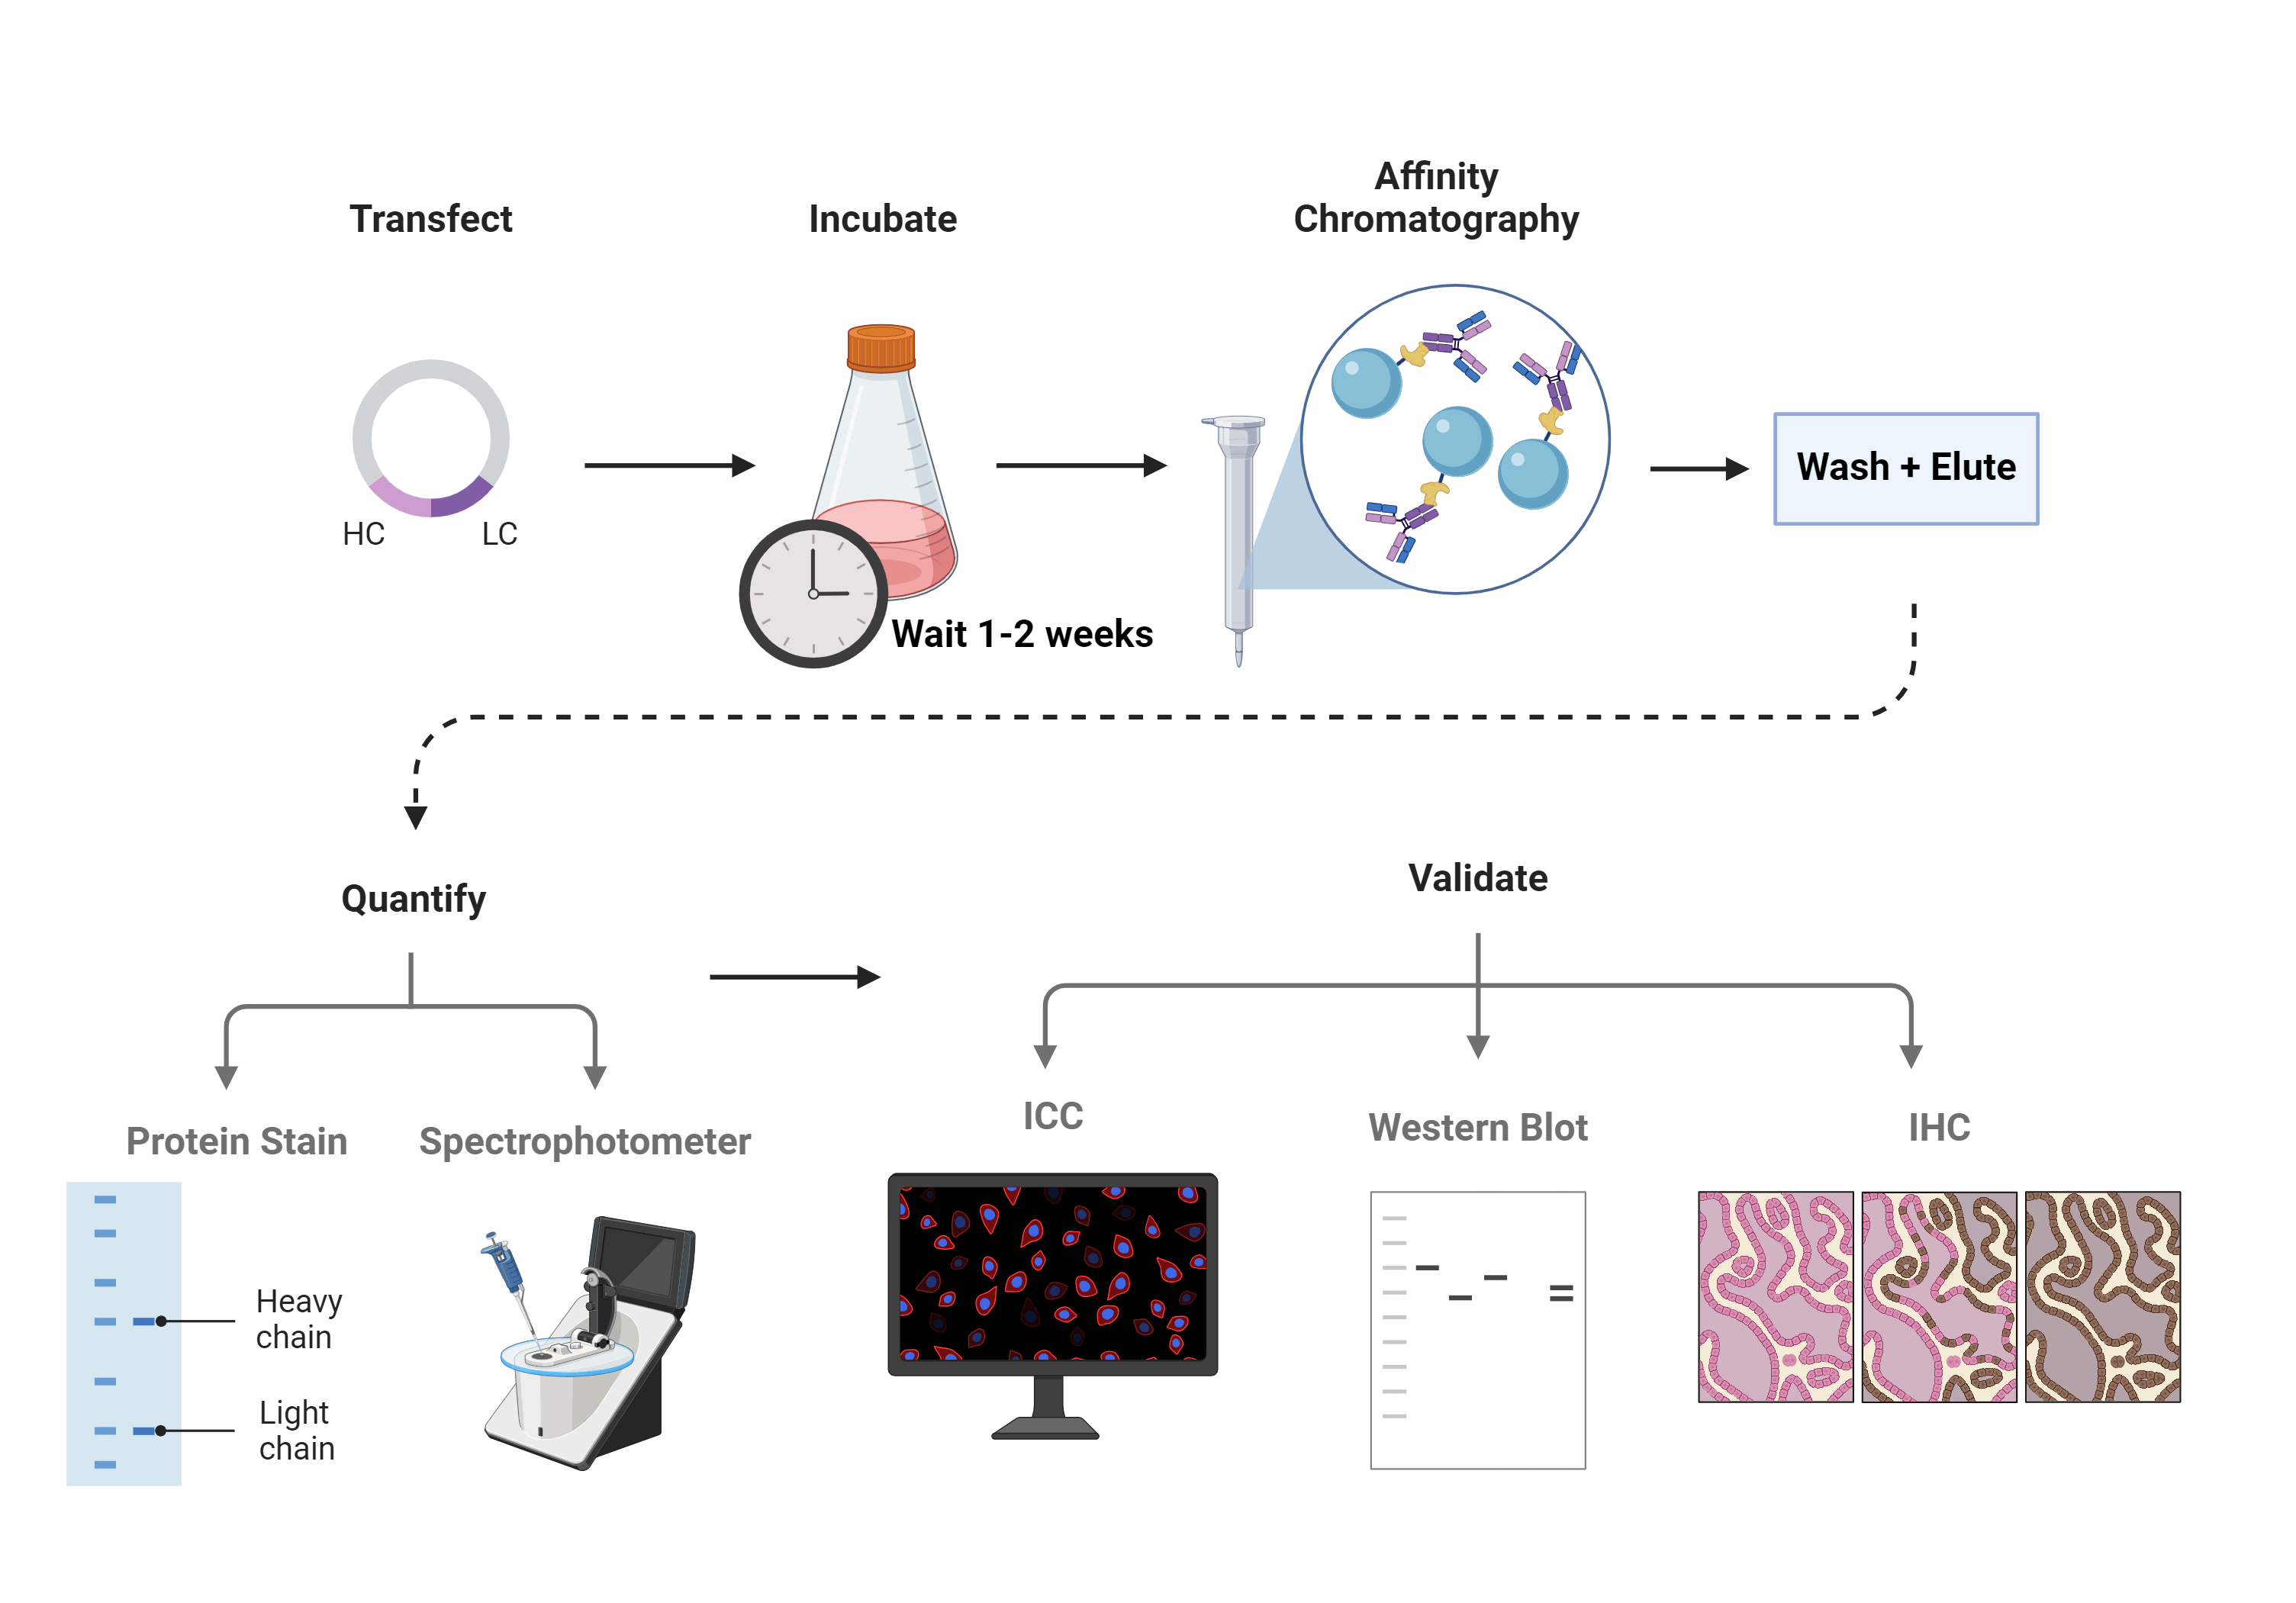
While monoclonal and polyclonal antibodies are readily available from several sources, fewer sources of recombinant antibodies (rAbs) exist (though Addgene has a great collection of ready-to-use rAbs and rAb plasmids!). Since recombinant antibodies conveniently allow for ...
Western blots are a great tool to identify a protein of interest in a complicated solution like cell lysate. But they can be a lot of work — and what if you want to detect more than one protein in your sample? Or what if something weird happened during your western and your ...
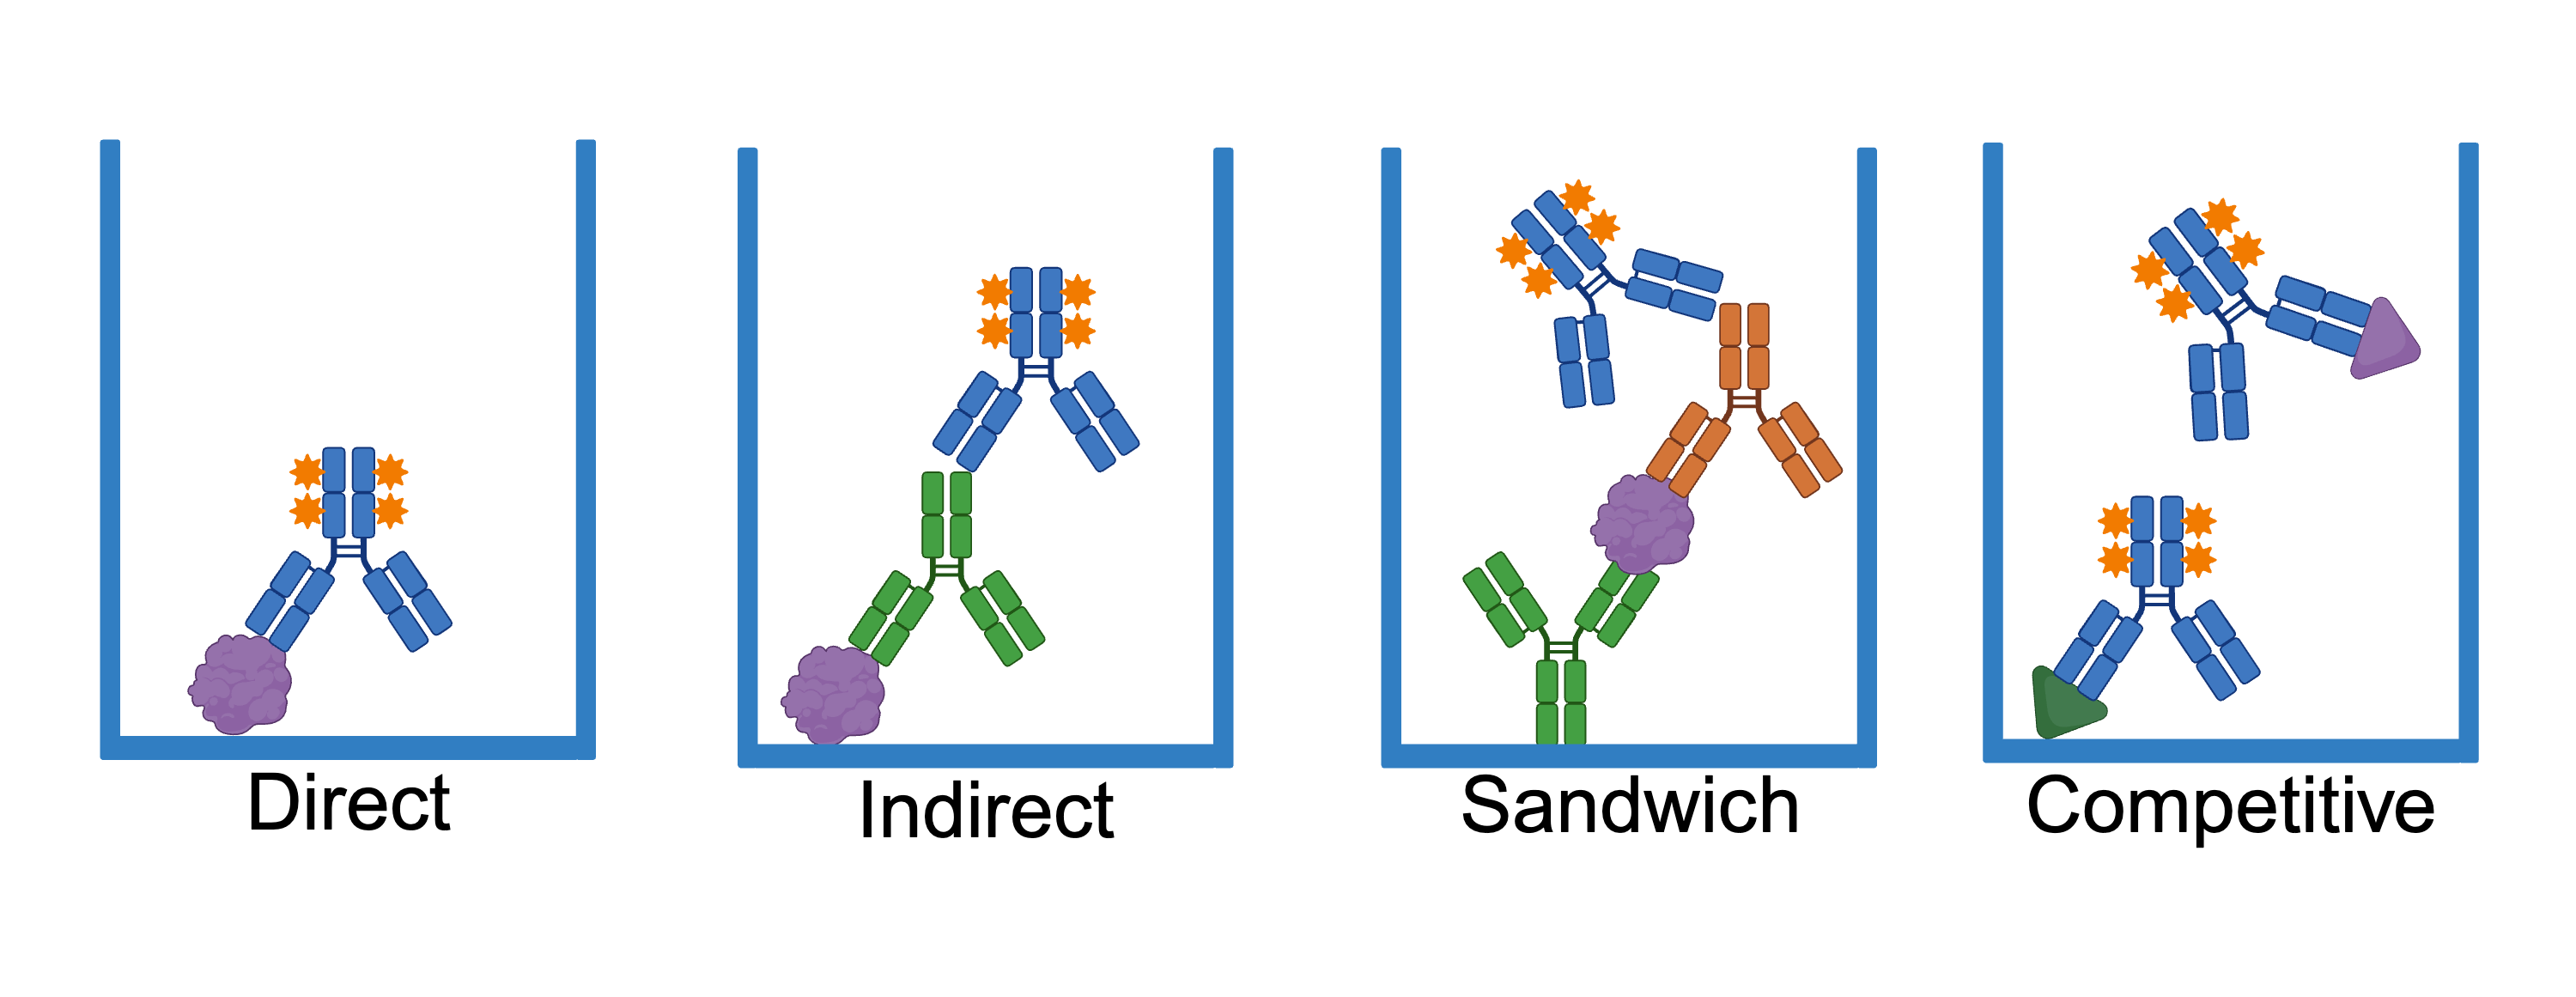
An enzyme-linked immunosorbent assay (ELISA) is a versatile method used to quantify the level of target antigen in a sample. While Engvall et al. originally developed the ELISA assay to measure antibody levels, scientists have since adapted it for a host of different proteins ...