This article was contributed by Jessica Roginsky, Scientific Support Lead at Synthego. Article source: Step-by-Step Guide for Analyzing CRISPR Editing Results with ICE on Synthego’s blog.

CRISPR-based genome engineering has revolutionized the gene editing field by making experimental workflows considerably easier, faster, and more efficient than previous methods. Still, generating reliable results from CRISPR edit data requires the help of robust software tools. As a consequence, a critical step in the gene editing workflow - analyzing the data - is often under-appreciated or over-looked.
Synthego has developed a new tool called ICE (Inference of CRISPR Edits) to solve this problem. This tool was initially created to support the CRISPR analysis needs of Synthego’s scientists, and it’s now free for everyone to use at ice.synthego.com.
We rigorously evaluated the effectiveness of the ICE tool by analyzing thousands of edits performed over multiple experiments and comparing the robustness, accuracy, and speed with existing tools. For example, we examined ICE analysis of Sanger sequencing data alongside the analysis of NGS-based amplicon sequencing data and found that the accuracy of ICE analysis results was highly comparable (within r2=0.96) to that of NGS data.
Advantages of ICE
Determine Editing Efficiency and Types of Edits with Low-Cost Sanger Sequencing
ICE uses Sanger sequencing data to produce quantitative, NGS-quality analysis of CRISPR editing - enabling a ~100-fold reduction in cost relative to NGS-based amplicon sequencing.
To use the tool, you start by uploading your Sanger sequencing files, either one at a time or as a batch of hundreds, and indicate the guide RNA sequence you used. The ICE tool will calculate overall editing efficiency and determine the profiles of all the different types of edits that are present and their relative abundances.
The ICE tool also provides a Knockout score (KO-score) which represents the proportion of cells that have either a frameshift or 21+ bp indel. This score is a useful measure to determine how many of the contributing indels are likely to result in a functional KO of the targeted gene.
Analyze Complex Edits
Traditional Sanger sequencing-based analysis tools are unable to detect or analyze complex edits, such as those generated by multiplexed delivery of multiple sgRNAs. Since multiplexing is commonly used to create functional knockouts or large deletions, the ability to analyze and interpret data about these types of edits is critical to the CRISPR workflow. For a multiplex sample, ICE includes visual representations of all detected edit types in the sample. The visualization helps the researcher see which of the multiplexed sgRNA was involved in a particular edit, and which type of edit was produced.

How ICE works
Following delivery of CRISPR components into target cells, genomic DNA from both edited and unedited (control) populations is PCR-amplified and Sanger sequenced. ICE compares these sequence traces to give a detailed analysis of CRISPR editing. ICE software identifies the percentage of genomes that have been successfully modified with insertions or deletions (indels) and then characterizes the sequence and abundance of each particular indel.
For a complete guide to ICE analysis, including detailed explanation and examples, read the paper on bioRxiv.
Using the ICE tool
Learning how to use the ICE software tool is quick and easy. Simply upload your Sanger sequencing files and provide basic information such as your sample names and guide sequences, and ICE will do the rest. There are no parameters that need optimizing and no complicated steps to learn. For increased flexibility and scalability, the ICE software has two analysis formats: sample by sample analysis, which can compare up to five editing experiments at a time, and batch analysis, which compares hundreds of samples simultaneously.
The current version of ICE software can analyze indels that result from single or multiplex CRISPR-Cas9 double-strand DNA breaks using SpCas9. More features will be added to the ICE software tool soon. To request other nucleases or other features and functionalities, please email support@synthego.com.
Overview of ICE editing analysis
Once the analysis is complete, a new screen appears with a graphical representation of the results and a list of the analyzed samples (see below).
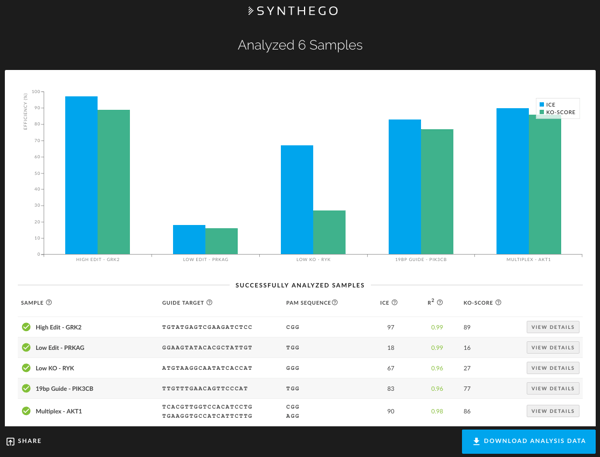
If the sample run had no issues, the analysis window shows a green checked circle in front of the sample name. If there was a minor error during processing, the window shows a yellow checked circle. Typically, a yellow check mark indicates that a particular parameter was automatically adjusted to generate ICE results. If there are no results or there was a processing error, you will see a red exclamation point in front of that sample. You can hover over the yellow or red circles to gather details on the issues associated with each sample.
Successfully analyzed samples will display the following parameters:
- Sample - The unique label name that you provided for each sample.
- Guide Target - This is the user-defined 17-23 nucleotide sequence of the DNA-targeting region of the guide RNA, excluding the PAM sequence.
- PAM Sequence - The Protospacer Adjacent Motif (PAM) sequence for the nuclease used. Currently, ICE is configured for Cas9 fromStreptococcus pyogenes (SpCas9).
- ICE Score - The editing efficiency (percentage of the pool with non-wild type sequence) as determined by comparing the edited trace to the control trace. In the ICE algorithm, potential editing outcomes are proposed and fitted to the observed data using linear regression.
- R2 Value - When the ICE linear regression is computed during generation of the ICE Score, the Pearson correlation coefficient (r) is also computed and reported. The higher the R2 value, the more confident you can be in the ICE score.
- KO Score - Represents the proportion of cells that have either a frameshift or 21+ bp indel. This score is a useful measure for those who are interested in understanding how many of the contributing indels are likely to result in a functional Knockout (KO) of the targeted gene.
The analysis can be sorted by any of the parameters displayed in the summary table. You can also use your browser’s Control+F or Command+F functionality to search for a particular sequence or name. You can perform more in-depth analyses on each sample by clicking on the sample name or on its corresponding bar graph entry. Clicking to initiate the in-depth analysis will open up a new window with three tabs. Each of the three tabs - Contributions, Indel Distribution and Traces - provides particular details about the indel profile of the edited sample.
You can also download the entire analysis as a ZIP file by clicking the Download Analysis Data button on the bottom right of the analysis screen.
ICE analysis details
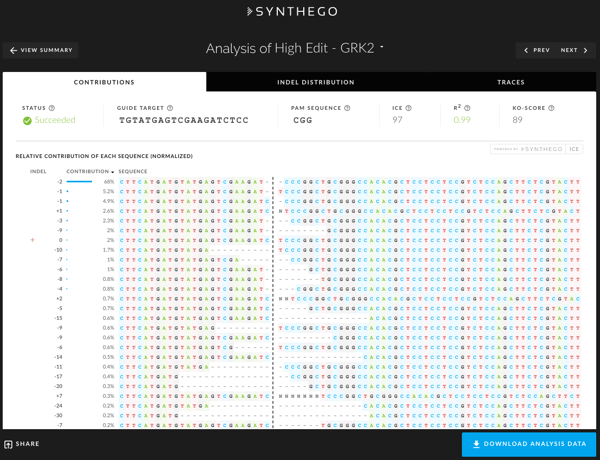
Contributions
The Contributions tab shows the inferred sequences present in your edited population and their relative representation in the edited pool. The black vertical dotted line represents the cut site, and yellow + symbol on the far left marks the wild type sequence. If you are viewing a multiplex sample, the cut site will be aligned to the most 5’ cut site.
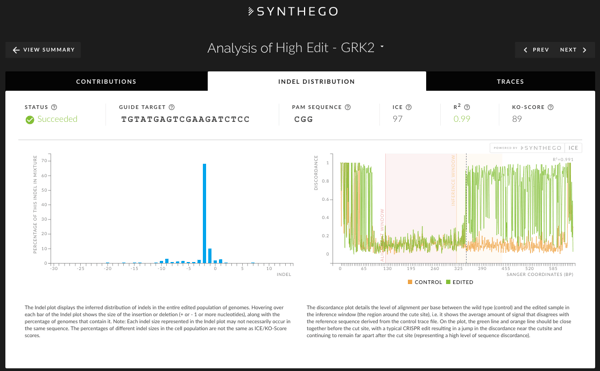
Indel Distribution
In the Indel Distribution tab, you’ll find an Indel plot (left panel) which displays the inferred distribution of indel sizes in the entire edited population of genomes. Hovering over each bar of the indel plot shows the size of the insertion or deletion along with the percentage of genomes that contain the indel.
The discordance plot (right panel) shows the level of disagreement between the non-edited wild type (control) and the edited sample in the region around the cut site. It shows, base-by-base, the average amount of signal that disagrees with the reference sequence derived from the control trace file. On the plot, the green (edited sample) and orange (control sample) lines should be close together before the cut site. A typical CRISPR edit shows a jump in the discordance near the cut site that continues after the cut site, representing a high level of sequence difference.
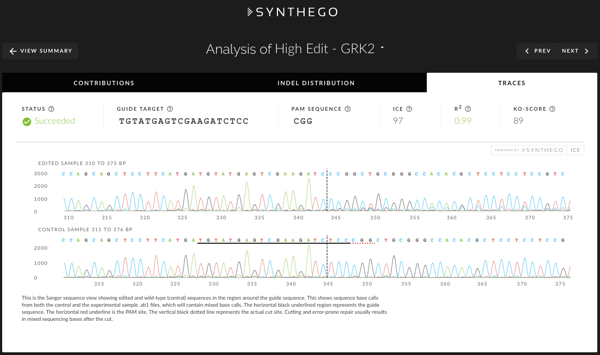
Traces
The Traces tab shows the edited and control, non-edited Sanger traces in the region around the guide binding site(s). The sequence base calls from the .ab1 file are also shown above each trace. The horizontal black underlined region represents the guide sequence, along with the red underlined PAM. The vertical black dotted line represents the cut site. Cutting and error-prone repair typically result in mixed sequencing bases downstream of the cut.
Summary
ICE generates NGS-quality CRISPR editing analysis from Sanger sequencing data. Furthermore, ICE can analyze more types of editing experiments than other Sanger sequencing-based software tools and is also faster and easier to use. ICE is completely free for everyone to use, and we have made the algorithm code open source and free for all non-profit uses. We invite you to try ICE today and let us know how it works for you!
Read more details about the ICE tool in our bioRxiv paper.
The new ICE CRISPR analysis tool is part of Synthego’s full stack Genome Engineering Solutions, which also includes our CRISPR knockout guide design tool, guide validation tool, and guaranteed editing with the CRISPR Gene Knockout Kit.
Please contact us at support@synthego.com if you have any questions, and check out the Synthego blog for more great CRISPR content.
Many thanks to our guest blogger, Jessica Roginsky.
 Jessica Roginsky leads the scientific support team at Synthego. Her work centers around educating and supporting novice to expert-level researchers in achieving consistently successful CRISPR experiments. Jessica is a sci-fi enthusiast, and when she is not guiding CRISPR researchers, she's either day-dreaming about exploring sci-fi worlds or exploring nature in the real world.
Additional Resources on the Addgene Blog
- Browse our CRISPR featured topic page
- xCas9: Engineering a CRISPR Variant with Pam Flexibility
- RNA Editing with Cas13 and REPAIR
Resources on Addgene.org
- Check out our CRISPR guide
- Find CRISPR plasmids for your research
- Find other CRISPR software resources
Topics: CRISPR, Other CRISPR Tools


Leave a Comment