Have you ever wanted to measure expression of your protein of interest in a single cell? Or perhaps, you need to analyze a specific subset of cells in a complex population. Have you spent hours in the biosafety cabinet with cloning rings or following labor-intensive limiting dilution protocols? If this sounds like you, then flow cytometry can help you overcome these challenges and make these types of experiments easier and faster to perform.
Introduction to flow cytometry
Flow cytometry allows users to analyze single cells in a population. Single cells are passed through the path of a laser and interrogated with various visible and fluorescent light sources that allow users to assess a cell’s size, granularity, and target protein composition. It is used for a variety of applications such as measuring target protein expression levels, assessing post-translational modifications, determining cell health, analyzing cell cycle stages, and detecting specific populations of cells in a complex tissue or sample (1). When combined with cell sorters, this technology can be used to isolate a specific subset of cells in a population in a procedure termed fluorescence activated cell sorting or FACS (2). By analyzing single cells instead of the population as a whole, scientists gain statistical power in their observations. However, while flow cytometry provides analysis at the cellular level, it cannot be used for subcellular analysis such as morphology or subcellular localization studies. For these, alternative methods such as fluorescent microscopy must be used. To learn more about the most suitable fluorescent microscopy technique for your study see Addgene’s blog post Which Fluorescence Microscopy Techniques is Best for Me?
An overview of the instrumentation
A flow cytometer combines three systems to analyze single cells from a mixture (3):
- An optics system
- A fluidics system
- An electronics system
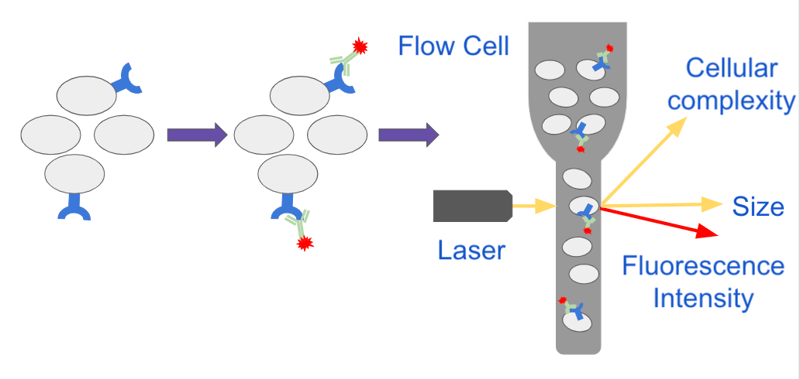
Cells are first resuspended in a pressurized buffer called sheath fluid and transported through tubes or capillaries to a laser. As the cells move through the fluidics system they pass through a flow cell which restricts the size of the stream and forces the cells to line up in single file in a process termed hydrodynamic focusing. This allows each cell to pass through the path of the laser in single-file where it is interrogated by the optical system (Figure 1).
|
|
| Figure 1: Cells expressing a particular surface receptor are stained with a fluorescent antibody against the receptor and analyzed on a flow cytometer. As cells pass through the flow cell the size of the sample stream is reduced forcing the cells to line up in a single file. Single cells pass through the path of a laser and the instrument collects information about the cell’s size, complexity and fluorescence intensity. |
What flow cytometers detect
Cell size and complexity, measured using visible light scatter
The optical system has both visible and fluorescent light sources. Visible light illuminates each cell as it passes through and scatters in different directions. The degree of scatter is captured by detectors and provides useful information about the cell. Light that continues in the same direction as it was initially traveling is called forward scatter (FSC) and provides information about the relative size of the cell; larger cells produce more FSC. Light that scatters sideways to the path that it was initially traveling is called side scatter (SSC) and provides information about the cell’s complexity. A cell with a high degree of internal complexity such as extensive membranes produces a greater SSC.
Protein expression, measured using fluorescent protein fusions
In addition to visible light, flow cytometers can have a variety of fluorescent light sources. When interrogated with a fluorescent light source, a cell expressing the associated fluorophore or stained with the associated fluorochrome, emits a fluorescent signal that is captured by detectors.
The strength of the emitted photons varies from cell to cell depending on the level of fluorescence. A cell expressing high levels of the fluorophore or fluorochrome-stained protein will emit a stronger photon than a cell expressing low levels of the protein. The electrical system converts the fluorescence intensity to a voltage pulse, called an event, and assigns each event to a channel number based on intensity. Higher intensity events are assigned to higher channels. In a typical assay a user will compare the shifting intensity of events. Since intensity positively correlates with expression, the further the shift of a cell from the negative control, the higher the level of expression.
A routine flow cytometry experiment uses 2 or 3 different fluorescent colors each measuring a different target. Flow cytometers however are highly versatile and some can accommodate up to 30 different colors. This lends flow cytometry particularly well to complex experiments looking at a variety of different targets. If you are planning on using fluorescent proteins for your experiment and are unsure which to choose, check out Addgene’s article: Which Fluorescent Protein Should I Use?
However, fusion proteins tag your protein of interest with a fluorescent reporter on the N- or C-terminus of the protein. One downside of fusion proteins is that the tag can alter the structure of the protein. In some cases this can lead to changes or a complete loss of protein function. In addition, the level and timing of expression can also be affected by the tag.
Protein expression, measured using antibody conjugated fluorophores
Fluorescent antibodies get around the challenges of fluorescent protein fusions by binding to the protein in its native state. Antibodies-based flow cytometry can use both direct and indirect staining methods. In direct staining, the primary antibody against a target is conjugated to a fluorochrome. In indirect staining a primary antibody binds to a target and a fluorochrome-conjugated secondary antibody binds to the primary antibody. Direct staining is quicker than indirect staining and eliminates potential non-specific staining that may arise from the use of secondary antibodies. It’s also particularly useful for intracellular staining where binding of large immune complexes may be hindered. Indirect staining can be beneficial when expression levels are low as multiple secondary antibodies can bind to a primary antibody thus amplifying the signal.

Intracellular protein targets, measured by fixing and permeabilizing membranes
For intracellular protein targets, users must first fix proteins within the cells and then permeabilize the cell membrane to allow antibodies to pass through the cell membrane. Formaldehyde fixation creates cross-links between lysine residues thus preserving the protein structure and keeping epitopes intact. It does not, however, permeabilize cells and requires subsequent permeabilization with detergents such as triton-x, saponin, or tween. Take care when using strong detergents like triton-x and tween as extended treatment can lyse cells. Alcohols, like ethanol or methanol, fix and permeabilize in a single step by denaturing proteins and dissolving lipids including those of the cell membrane. In some cases, this can mask epitopes such that immune complexes will no longer recognize them. Sometimes, users will combine methods and fix with formaldehyde first to freeze everything in place followed by alcohol permeabilization. Users should also keep their targets in mind when planning fixation. If staining both cell surface and intracellular proteins in parallel, then stain the surface protein first, fix and permeabilize, and then stain the intracellular target. When using this approach, avoid fixation-sensitive fluorochromes such as phycoerythrin (PE) and allophycocyanin. If assaying a secreted protein, first block the Golgi apparatus with Brefeldin A to inhibit secretion and then follow the typical intracellular staining protocol.
Sorting cells with FACS
In addition to the fluidics, optics, and electronics systems, FACS instruments have specialized components that can divert a subset of cells. During FACS, the sample stream oscillates to generate droplets that are charged as they pass through a metal deflection plate. Each droplet contains a single cell that is assessed for the desired parameter. A droplet containing a cell that is positive for a desired parameter is collected in a tube or plate, while a droplet containing a negative cell is discarded. FACS can be performed aseptically allowing users to culture the cells after collection. Many FACS sorters are compatible with 96-well plates as collection vessels and can sort single cells into each well allowing users to easily isolate and subsequently expand monoclonal cultures.
Interpreting flow cytometry data
To interpret flow cytometry data users will typically start by creating a dot plot of FSC versus SSC that allows them to observe distinct cell populations and rule out dead cells and debris. For example, a whole blood sample will contain a mix of cells including granulocytes, lymphocytes, and monocytes. Due to differences in size and complexity, these cell types will separate into distinct populations on a FSC versus SSC plot (Figure 2).
A user can then “gate” around the specific population that they are interested in and further analyze that subset of cells. An immunologist, for example, might be interested in the lymphocytes and “gate” that population for further analysis. Since different populations of immune cells express unique Clusters of Differentiation cell surface markers (CD) these markers can be targeted with specific fluorescent antibodies during the flow cytometry experiment and will appear as a distinct population. After initially gating the lymphocytes, one could then create a dot plot of CD3 (T cell marker) versus CD19 (B cell marker) to separate the B cell and T cell into distinct populations (Figure 2). An immunologist who studies B cells, might then gate the B cell population and create a histogram of CD19-containing cells versus total cell number to determine the number of B cells in that sample. Alternatively, they could create additional dot plots of various CD markers to further separate the B cell population into progenitor B cells, immature B cells, plasma cells or others.
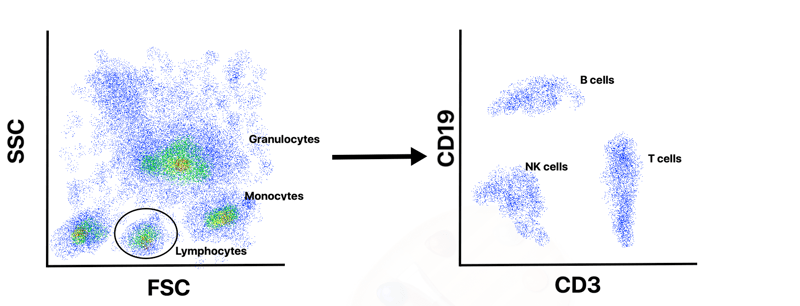 |
| Figure 2: Due to differences in their size and complexity, cells from a whole blood sample will separate into distinct populations of monocytes, lymphocytes and granulocytes in a plot of forward scatter (FSC) versus side scatter (SSC). Users can gate around their desired cell population for further analysis. In this example, the lymphocyte population is selected and analyzed further by plotting CD3 versus CD19 to separate B cells, T cells and natural killer (NK) cells. |
Tips for flow cytometry success
Break up cell clumps
Success in a flow cytometry experiment depends on a variety of factors including sample preparation, staining procedures, and controls. To prevent instrument clogs, ensure that samples are single cell suspensions. For cells that tend to aggregate, pass the sample through a nylon mesh cell strainer to break up clumps before running on the instrument. To sustain cell health and limit debris, keep samples on ice at all times and use gentle pipetting instead of vortexing.
Include proper controls
To ensure accurate data analysis, include a complete set of controls. Ideally, every flow cytometry experiment will have a negative control that does not express the target and a positive control that does. The negative control is critical for determining the background level of non-specific staining.
If you’re using antibodies for detection, include an unstained control with cells that went through the staining procedure minus the antibody. An unstained control allows you to detect any autofluorescence from your target cell type or that has arisen from fixation. Also include an isotype control, an antibody that does not bind to any targets but was raised in the same host species, of the same Ig subclass, and conjugated to the same fluorochrome as your primary antibody. The isotype control allows you to determine the level of non-specific staining associated with the primary antibody. When following an indirect staining protocol, you should also include a secondary antibody control in which the primary antibody has been omitted from the staining protocol. This control allows you to detect background staining arising from the secondary antibody.
It is also recommended that users include a viability control as this will allow you to omit dead or dying cells from your analysis; dead or dying cells tend to have more autofluorescence and nonspecific staining leading to false positives. Numerous dyes can be used for viability controls such as DNA binding dyes and amine reactive dyes. DNA binding dyes, such as propidium iodide, can only enter cells with disrupted membranes as is the case with dead or dying cells. DNA binding dyes are not compatible with protocols that require fixation and permeabilization as these methods require damaging the cell membrane and will cause all cells to stain positive. If fixation and permeabilization are required, as in intracellular staining, consider using an amine reactive dye, such as LIVE/DEAD stain. Like DNA binding dyes, amine reactive dyes can only pass through the membrane of dead cells. Once in the cells, amine reactive dyes interact with free amines in the cytoplasm causing dead cells to fluoresce.
When running a multicolor flow cytometry experiment, users must also prepare sets of controls to aid with compensation. Compensation is the process of correcting spectral overlap that occurs between fluorochromes. For example, FITC dye emits green, yellow and orange photons while PE emits yellow and orange photons. If FITC and PE were being used together in an experiment, you would need a way to determine the relative contribution of yellow and orange from FITC and that from PE. During compensation the signal arising from a specific fluorochrome is removed from all other detectors except its dedicated detector. To ensure proper compensation you must include single-stained samples for each fluorochrome in the experiment. Single-stained samples must be as bright or brighter than any experimental sample. In addition, you should include a panel of “fluorescence-minus one” controls, samples stained with all of the fluorochromes in the experiment except one. The fluorescence-minus one panel will help you set up gating during data analysis.
We hope that this blog has provided you with an overview of flow cytometry for single cell analysis and some useful background information for setting up antibody based flow cytometry experiments.

References and resources
References:
Bonner WA, Hulett HR, Sweet RG, Herzenberg LA (1972) Fluorescence Activated Cell Sorting. Review of Scientific Instruments 43:404–409 . https://doi.org/10.1063/1.1685647
McKinnon KM (2018) Flow Cytometry: An Overview. Current Protocols in Immunology 120: . https://doi.org/10.1002/cpim.40
Picot J, Guerin CL, Le Van Kim C, Boulanger CM (2012) Flow cytometry: retrospective, fundamentals and recent instrumentation. Cytotechnology 64:109–130 . https://doi.org/10.1007/s10616-011-9415-0
Additional resources on the Addgene blog
- Check out other methods using fluorescent proteins
- Learn more about antibodies
Resources on Addgene.org
- Visit the Fluorescent Protein Guide
- Find antibody plasmids for your experiments
Topics: Fluorescent Proteins, Other Fluorescent Protein Tools, Antibodies


Leave a Comment