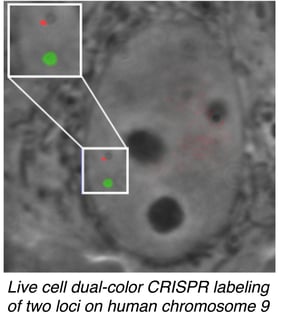
It seems that there’s a new CRISPR advance or technique published every week! One of the newest applications is a colorful system that uses fluorescently labeled Cas9 to label multiple genomic loci in live cells. While other systems can be used to label loci, such as fluorescence in situ hybridization (FISH) or fluorescently labeled TALEs, CRISPR/Cas9’s ease of use and ability to label live cells make this system truly advantageous. This new technique, developed in Thoru Pederson’s lab, brings us one step closer to mapping the 4D nucleome, the organization of the nucleus in space and time, and to understanding how nuclear organization varies across the life of a cell, or how organization may be altered in disease states.
dCas9 gets a colorful makeover
Even without its nuclease activity, catalytically dead Cas9 (dCas9) has many applications, the most well-known being transcriptional activation/repression. dCas9 has also previously been adapted to fluorescently label a sequence matching its gRNA, facilitating the live study of chromatin dynamics at a particular locus. A limitation of this system is the single-color labeling; multicolor labeling would enable the visualization of multiple loci. Such a system could then be used to examine both inter- and intrachromosomal dynamics, and how they change in response to the cell cycle or other stimuli.
 To create a colorful Cas9 toolbox, Ma et al. turned to SpCas9 and its orthologs NmCas9 and St1Cas9. Each ortholog was fused to a different fluorescent protein to create three colors. The specificity of these orthologs is key: due to differences in the PAM sequences required by each ortholog, a gRNA designed for one dCas9 should be specific to that ortholog and not cross-talk with the other orthologs.
Ma et al. tested their dCas9 variants using gRNAs specific for telomeric sequences and showed that different fluorescently labeled dCas9 isoforms are efficiently directed to the proper target sequence. They were also able to label two different pairs of chromosomes using gRNAs specific to sequences on chromosomes 9 and 13.
They next turned their attention to mapping pairs of intrachromosomal loci. The technique successfully resolved loci with physical map distances of 75 and 2 Mbp, with the calculated fluorescent distances correlating with the previously established physical map. In comparing pairs of targets ~2 Mbp apart, they noticed that they could evaluate the degree of chromatin compaction even for this small distance! To the authors’ knowledge, this work represents the first mapping of intrachromosomal loci, a major benchmark in characterizing the 4D nucleome.
Future modifications and applications
Ma et al. developed this technique using standard fluorescence microscopy, and are thus limited by its lower resolution. The combination of this method with superresolution microscopy may improve the resolution, although background signal would be a concern. Another caveat of the study is the method’s sensitivity. The authors estimate that a minimum of 150-200 fluorescent protein molecules is necessary for a detectable signal, limiting the sensitivity of the technique. One potential solution is SunTag, a synthetic scaffold that can be used to recruit multiple protein molecules (and also available from Addgene!) Since the signal level provided by SunTag is so high, cells may be imaged under lower illumination settings, lowering photobleaching and phototoxicity concerns and extending the potential imaging time for this technique.
The NIH Common Fund has made mapping the 4D nucleome a specific priority, as researchers work to increase our understanding of chromatin organization. This fluorescent CRISPR/Cas9-based method is a great step forward in live cell imaging of genomic loci. Ma et al. anticipate that the technique will be applicable to studies of cell cycle progression, epigenetics and cellular reactions to external stimuli. It could also have major applications to cancer, for example, the visualization of chromosomal translocations or chromosomal shattering (chromothripsis). As this study joins the pantheon of useful CRISPR/Cas9 techniques, we at Addgene are excited to see what’s coming next!
References
Multicolor CRISPR labeling of chromosomal loci in human cells. Ma H, Naseri A, Reyes-Gutierrez P, Wolfe SA, Zhang S, Pederson T. Proc Natl Acad Sci U S A. 2015 Mar 10;112(10):3002-7. doi: 10.1073/pnas.1420024112. Epub 2015 Feb 23. Pubmed.
-
Find the plasmids from this publication at Addgene.
Dynamic imaging of genomic loci in living human cells by an optimized CRISPR/Cas system. Chen B, Gilbert LA, Cimini BA, Schnitzbauer J, Zhang W, Li GW, Park J, Blackburn EH, Weissman JS, Qi LS, Huang B. Cell. 2013 Dec 19;155(7):1479-91. doi: 10.1016/j.cell.2013.12.001. Pubmed.
-
Find the plasmids from this publication at Addgene.
A protein-tagging system for signal amplification in gene expression and fluorescence imaging. Tanenbaum ME, Gilbert LA, Qi LS, Weissman JS, Vale RD. Cell. 2014 Oct 23;159(3):635-46. doi: 10.1016/j.cell.2014.09.039. Epub 2014 Oct 9. Pubmed.
-
Find the plasmids from this publication at Addgene.

Topics: CRISPR, CRISPR Visualize


Leave a Comment