By Multiple Authors
Read More
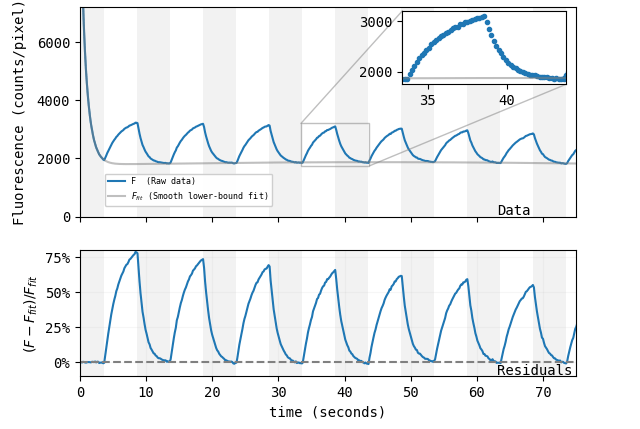
Lots of scientists work to invent novel techniques or to engineer improved tools for familiar applications. But how does one invent a tool for applications that don’t even exist yet? Andrew York, Maria Ingaramo, and their team at Calico Life Sciences recently set out to do just ...
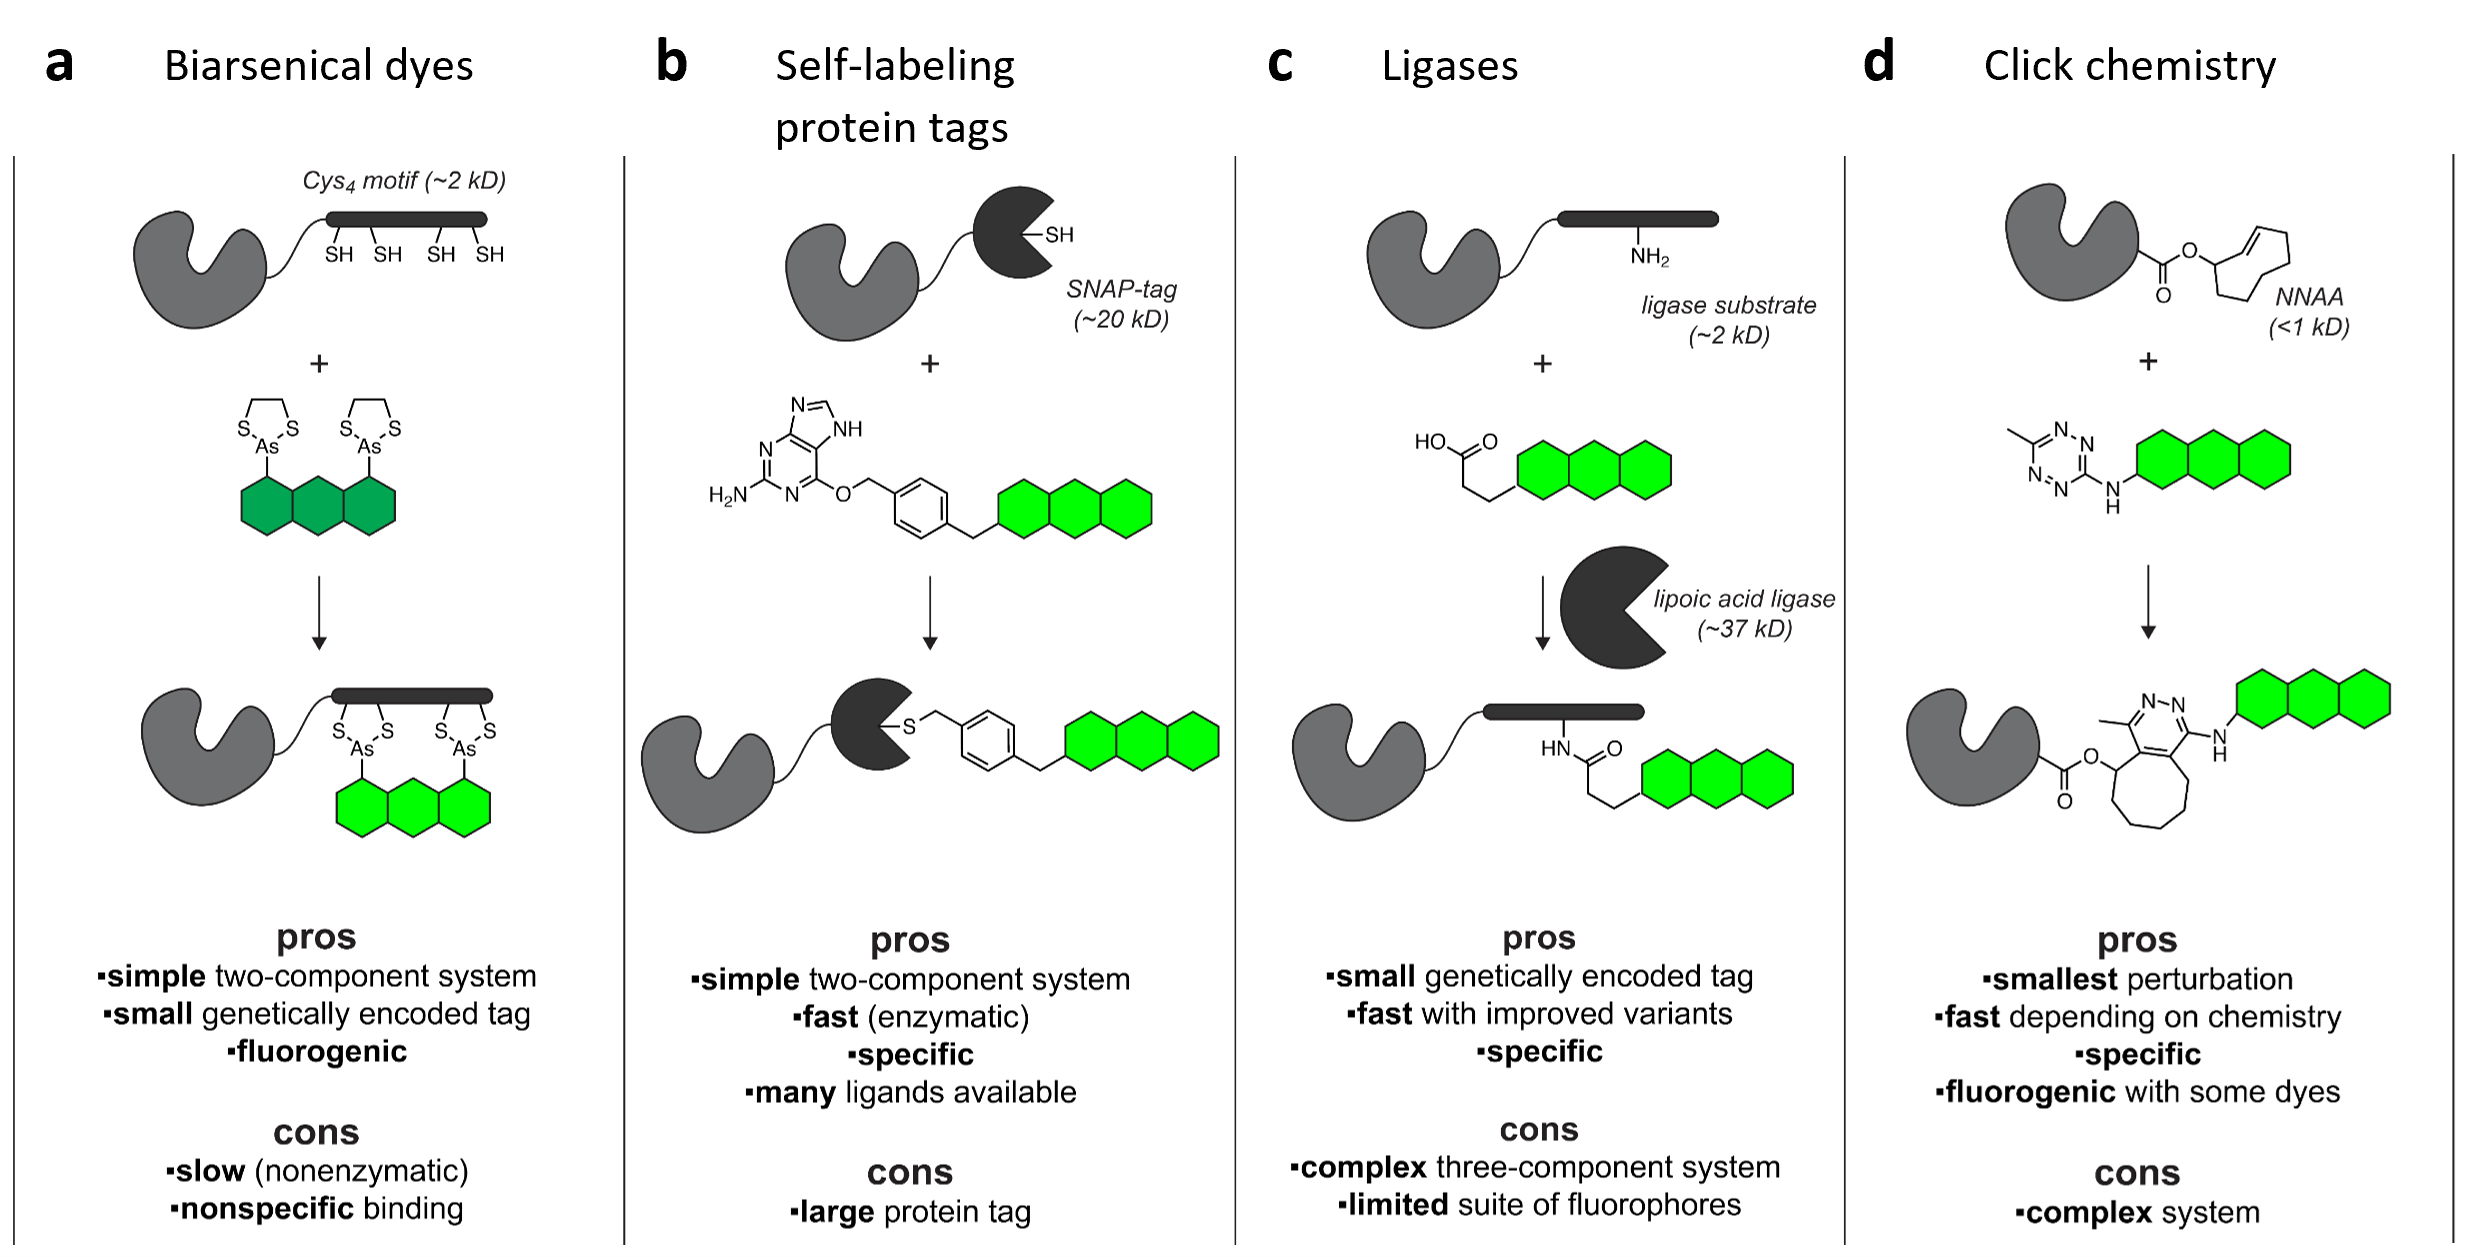
If you take a look in a typical lab freezer, you’ll probably find lots of different plasmids containing the same protein of interest tagged with different fusion proteins for different experiments over the years — a green fluorescent protein, a red fluorescent protein, a fancy ...
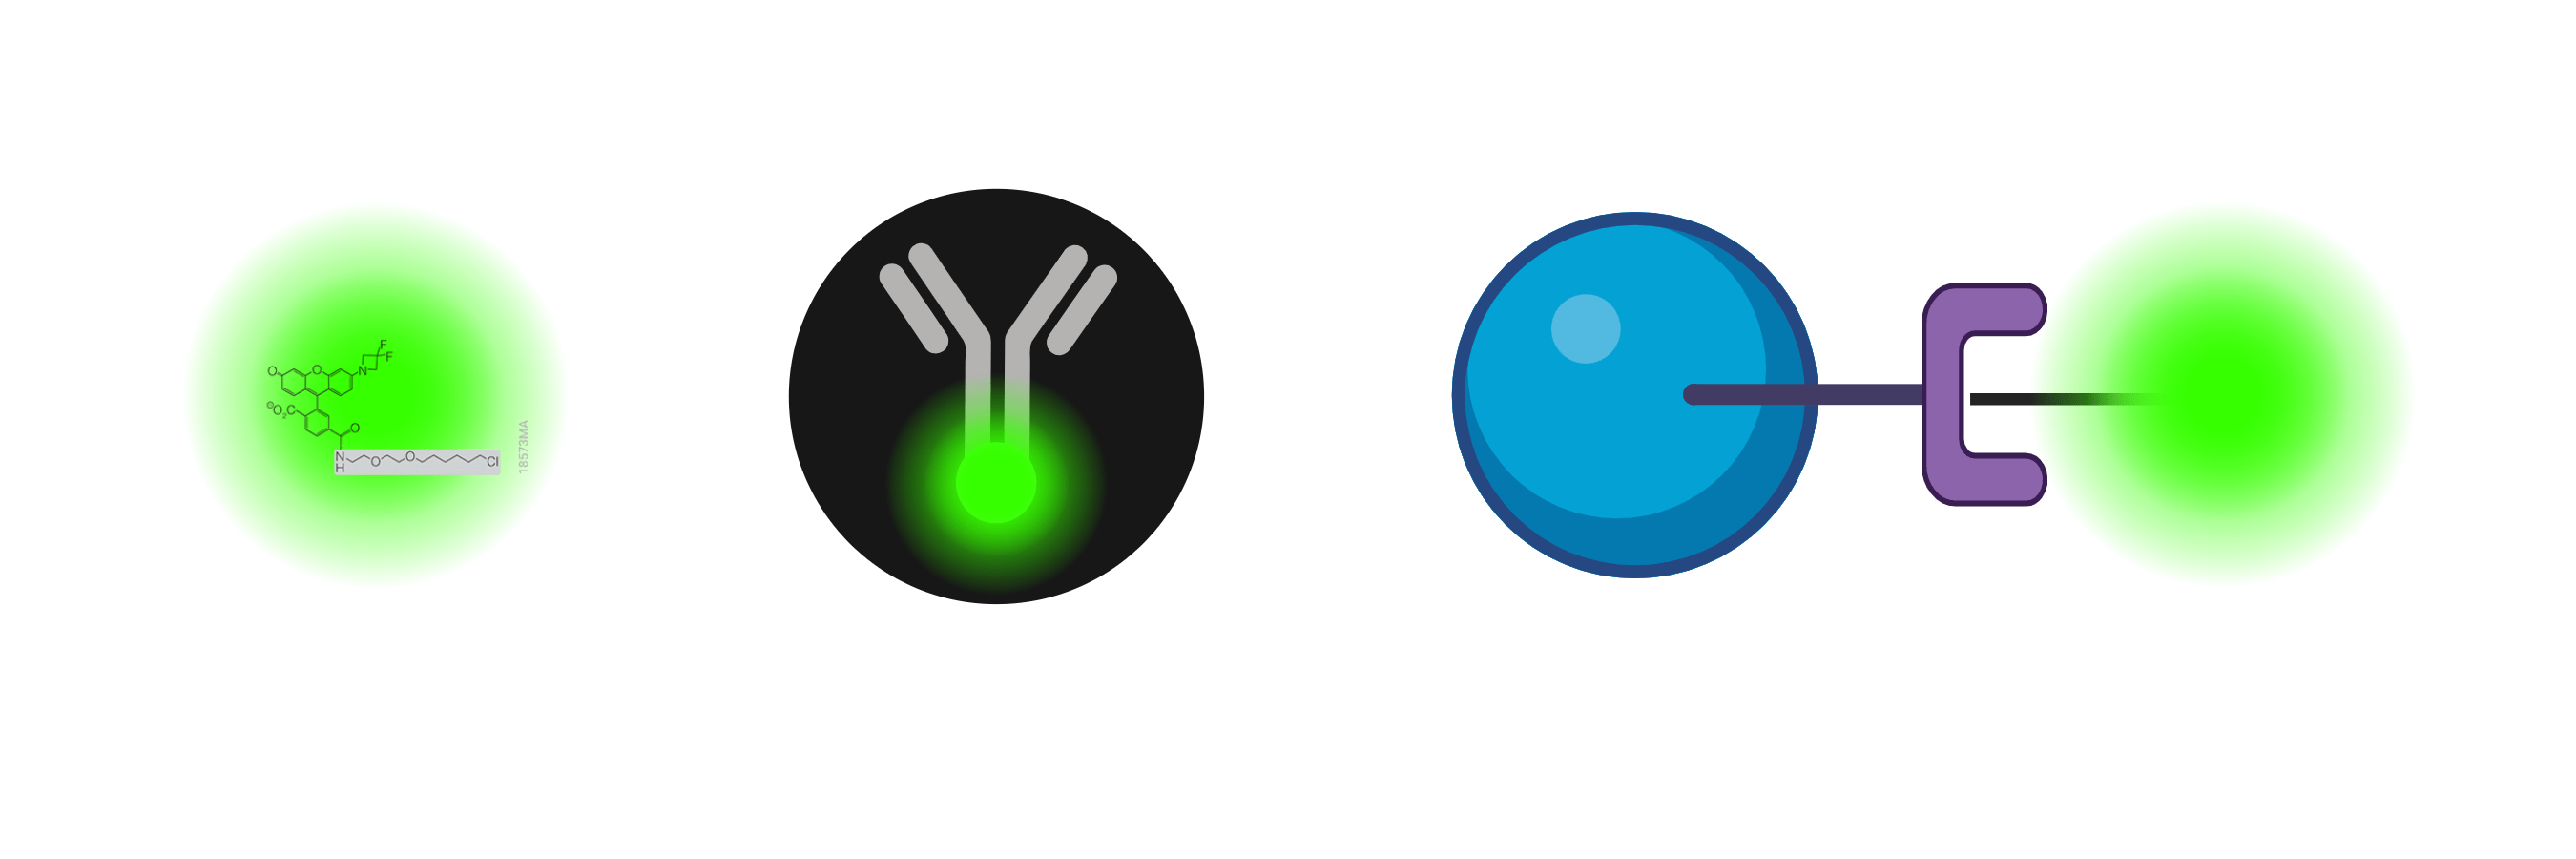
Throughout their history, fluorescent dyes have enabled the visualization of both organic tissues and cell cultures, opening biological interiors to many inquisitive scientists. Seeing inside these specimens has offered illumination on biochemical processes that are crucial in ...
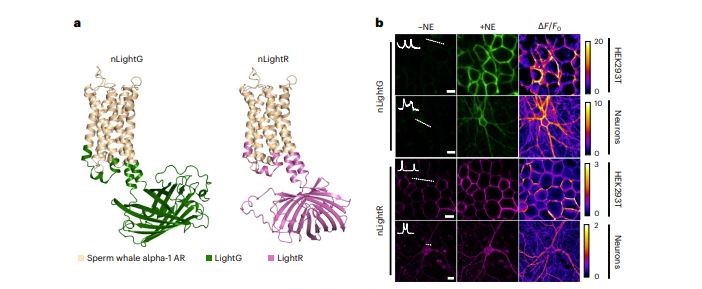
Neuromodulators like dopamine and norepinephrine have important functions in the brain but have been difficult to study without biosensors to directly visualize their activity. In 2019, the first generation of norepinephrine sensors was developed, named GRABNE, which helped ...
Here at Addgene’s headquarters, the skies are getting dark and wintry with the end of year approaching. We’re always looking for something to brighten our day, whether it’s memories of summer or just a bright new plasmid. One area with lots of bright new plasmids is our ...
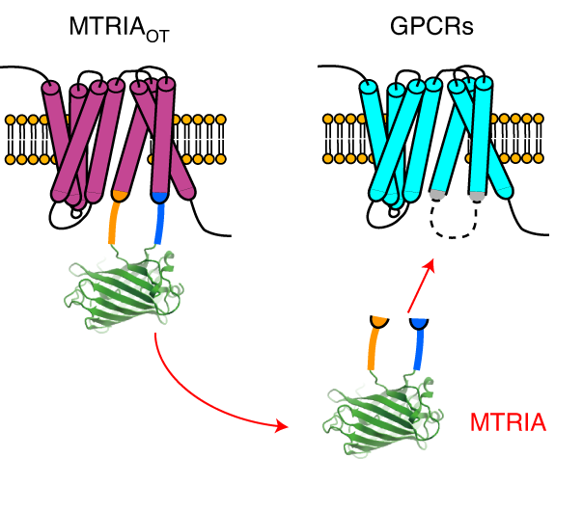
Many, many techniques are available to assess protein-protein interactions. One popular approach is to fuse a protein of interest to each part of a split fluorescent protein (FP) and measure the signal produced when the candidate proteins’ interaction brings the pieces of the FP ...
This post was contributed by guest blogger Daria Shcherbakova, a faculty member at Albert Einstein College of Medicine. Several sets of near-infrared fluorescent proteins (NIR FPs) and biosensors have been created recently. As developers of many of these probes, we decided to ...