


So you want to do some microscopy to look at your favorite protein. Good thing your lab has an old GFP-tagged plasmid in the freezer and you don’t need to clone a new construct, right? Not so fast! There’s a whole wide world of options beyond GFP, with a dazzling array of new and improved fluorescent proteins (FPs) worth considering. In this post, we’ll explore how these modern FPs can help you upgrade your next imaging experiment.
Why should you move on from the good ol’ GFP you know and love? It’s not about just being trendy; in fact, GFP comes with a number of limitations, and you might be missing out on better data that a new construct would deliver. Modern FPs can bring major gains like brighter signal, reduced toxicity, and enhanced stability, uncovering hidden features in your samples or enabling completely new kinds of experiments (Gest et al., 2026).
You’ll need to choose your FP carefully though. Some will perform better for one application but perform poorly under another condition you want to test later. Others might seem good in theory but actually disrupt your protein of interest and leave you with a totally misleading result. So how can you make the best choice? We’ve covered the basics in the blog before, but it’s time for a deeper dive and an updated look at your options. (Or jump to the end for a few quick recommendations.)
Pro-Tip
The open-source community resource FPbase has cataloged over 1,000 fluorescent proteins, documenting key characteristics and references for each. You can compare related FPs, find source data, build spectra viewers for your microscopes, and more!
What to consider when choosing an FP
Unfortunately, there’s no such thing as “the best fluorescent protein” (though EGFP and mCherry would definitely win a popularity contest). As with many things in life, it’s all about navigating tradeoffs. For decades, researchers have been engineering new FPs, searching for new ones from wild sources, and even designing new proteins de novo. But efforts to improve one property (like stability) often come with a sacrifice in some other property (like brightness).
To help you navigate these tradeoffs, let’s explore some of the key properties of FPs. And in each section, we’ll share examples of recently developed tools that might be just what you need.
 |
|
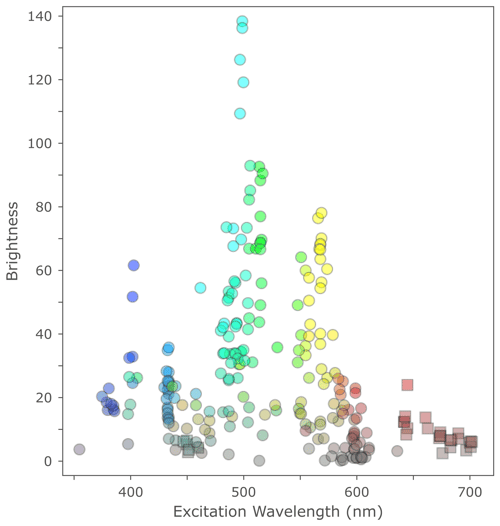
Figure 1: Fluorescent proteins’ theoretical brightness across the spectrum. Image obtained from FPbase. Explore an interactive chart with more details and other properties at https://www.fpbase.org/chart/. |
Wavelength
Most FPs have excitation and emission peaks within the visible light range (380–750 nm), or just beyond in the UV or near-infrared (near-IR) wavelengths. The color you choose will often be dictated by your microscope’s setup (for example, limited availability of lasers or filter sets) or if you’re combining multiple colors in the same experiment. Many of the most popular FPs have excitation peaks clustered around 480–500 or 550–580 nm, conveniently coinciding with commonly accessible lasers and filter sets, but you can find good FPs all across the spectrum (Figure 1).
Note that red illumination is typically less damaging to live samples than blue or UV. Far-red and near-IR FPs are especially preferred for imaging in whole organisms because these wavelengths penetrate deeper into tissues and exhibit less background signal.
Brightness
Using a bright FP is especially important if you’re imaging targets with low copy number, or if you want to minimize illumination of your sample to reduce phototoxicity. An FP’s brightness can be calculated theoretically from its extinction coefficient and quantum yield, but in reality, the practical brightness can be substantially different.
Pro-Tip
Practical brightness depends not only on intrinsic factors like maturation efficiency and sample conditions like pH, but also on hardware like your illumination source, filter set, and detector. If you image an FP that’s supposed to be twice as bright as another, but it’s poorly expressed or its excitation/emission spectra aren’t well matched to your microscope’s filter set, you won’t “see” that improvement at all; it may even look worse than the other FP.
Green and red FPs are generally the brightest overall (Figure 1). Electra2, mTurquoise2, mStayGold, mGold2, mScarlet3, and miRFP670nano3 are among the brightest FPs available in their respective color ranges. AausFP1 might just be the brightest FP discovered to date (theoretically about five times brighter than EGFP!), but it hasn’t been as widely characterized and used as these others, and it’s a dimer. Note there are three different monomeric versions of StayGold available (referred to as mStayGold, mStayGold(E138D), and mBaoJin) each with slightly different properties (Goedhart & Gadella, 2024).
But brightness isn’t everything — if your target is very highly expressed or you’re just looking at some major features at the cell or tissue level, maybe you don’t need to maximize brightness and you’re better off prioritizing other properties.
Read more about practical brightness
Oligomer or monomer?
Many FPs naturally form dimers or larger oligomers. Since this can often be problematic, monomeric versions have been engineered by mutating residues at the interface (usually indicated by the “m” in the name, for instance mEGFP being the A206K mutant of EGFP). Oligomerization might not matter if you just want a cytoplasmic marker or expression reporter to make the cells visible, but it has been known to cause experimental artifacts with fusion proteins.
Pro-Tip
If you’re using non-monomeric GFP or EGFP fusions (not sure? the A206K mutation makes it monomeric), switch to mEGFP or something even better (see suggestions below). If something looks different upon switching to the mEGFP fusion, don’t blame the “m” for causing problems — you might have been observing an artifact in the old version without realizing it!
Some FPs have been turned into “tandem dimer” constructs (like tdTomato or tdStayGold) encoding two copies of the FP together so that the dimerization occurs locally to avoid the problems of intermolecular dimers. Tandem dimers have the added bonus of doubling your brightness per protein and can be great options for cytoplasmic markers or lineage tracing. But they also double the bulk, so be careful when using these as fusion proteins. And note that typically only monomeric forms are suitable for FRET, incorporation into biosensors, split FP assays, and other applications (Goedhart & Gadella, 2024).
Read more about the problems of FP oligomerization and aggregation
Photostability
Repeatedly absorbing and emitting photons can be rough on a protein. All that excitement eventually destroys the chromophore, a process known as photobleaching. As molecules get damaged and stop fluorescing, your sample will gradually get dimmer the longer you illuminate it. Some FPs photobleach quickly after just a few cycles of excitation and emission, while others are more stable and can cycle through thousands or millions of events over minutes. Increasing photostability has been one of the major targets of FP engineering efforts, but it is a challenge to improve stability without sacrificing other properties like brightness.
 |
|
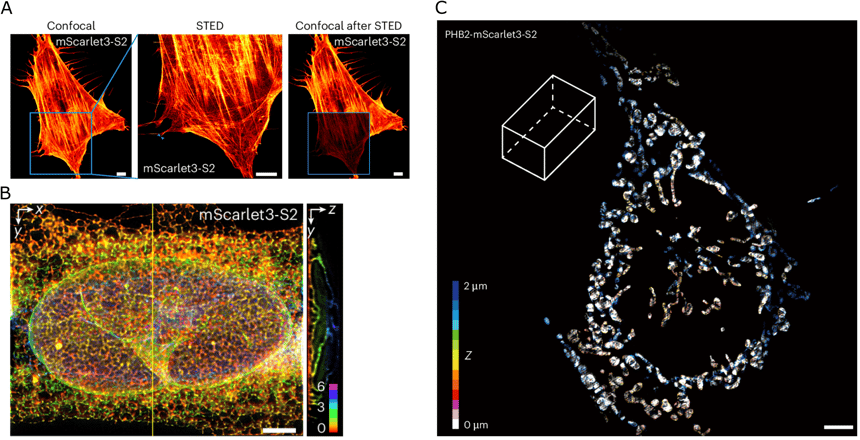
Figure 2: Super-resolution imaging with mScarlet3-S2. A) Actin structures in U-2 OS cells labeled with Lifeact fused to mScarlet3-S2, imaged with confocal (left and right) and stimulated emission depletion (STED) microscopy (middle). Scale bar, 5 μm. B) 3D STED imaging of endoplasmic reticulum labeled by mScarlet3-S2 in U-2 OS cells. Scale bar, 5 μm. C) Color-coded 3D distributions of mitochondria (labeled with PHB2-fused mScarlet3-S2 and imaged with 3D SIM) in a fixed COS-7 cell. Scale bar, 10 μm. Reproduced from Ding et al. (2026) under CC BY-NC-ND license. |
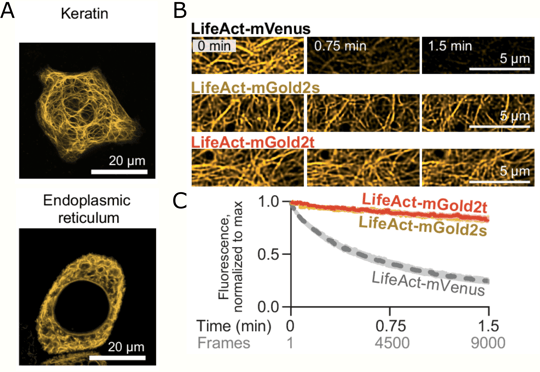
It’s especially important to use an FP with good photostability if you want to track structures or particles over time, or if you want to use super-resolution imaging techniques that rely on high-power laser illumination (Figure 2, Figure 3). mStayGold and mBaoJin, Electra2, mGold2, mRuby3, and mScarlet3-S2 all combine strong brightness with good photostability — though if you want a red FP to just capture a few quick snapshots and don’t need to maximize stability, mScarlet3 is brightest.
Read more about photostability
pH stability
FPs with lower pKa values will retain fluorescence when in an acidic environment. This property is more important for certain applications than others, for example imaging in lysosomes or synaptic vesicles. If you need robust stability against pH for your target, try mTurquoise2, Gamillus, mScarlet3-H, or mScarlet3-S2.
Size
Big fusion proteins may be more disruptive to your target’s native function. Or they might be fine, depending on your target and application. Remember that tandem dimers (like tdTomato) may be suitable as expression reporters or cytoplasmic markers, but their added bulk can be problematic for use as fusions. GFP and its relatives are around 27 kDa. Some especially small FPs to try include miniGFP (12.6 kDa), UnaG (15.6 kDa), and miRFP670nano3 (17.1 kDa) — or combine the self-labeling NovoTag (13–15 kDa) with Janelia Fluor dyes (Tran et al., 2026).
Maturation time
Before it can fluoresce, a newly synthesized FP has to fold and its chromophore has to properly form. For some FPs this takes just a few minutes, but others take hours or even days. A short maturation time is important if you want a rapid reporter of your target protein’s expression — you don’t want to be waiting around for hours before you can see the product. Plus, longer maturation time means lower and more variable signal in rapidly dividing cells.
Some notable rapidly-maturing FPs include mTagBFP2, mStayGold, mNeonGreen, mGreenLantern, mGold2, and mScarlet-I3. If you’re imaging in bacteria, try mLychee, mLemon, mJuniper, and mChartreuse for an optimized palette of bright, fast-maturing, and stable FPs.
 |
|
Figure 3: Bright and stable yellow fluorescent proteins mGold2s and mGold2t. A) HeLa cells expressing mGold2s-Keratin (upper) or mGold2s-Calnexin (lower) imaged with laser-scanning confocal microscopy. Scale bars, 20 μm. B) Total internal reflection fluorescence structured illumination microscopy (TIRF-SIM) imaging of COS-7 cells expressing LifeAct fused to mVenus, mGold2s, or mGold2t. C) Quantification of photostability under TIRF-SIM imaging. Images adapted from Lee & Lai et al. (2025) under CC BY-NC-ND license. |
Toxicity
Some FPs might not be tolerated at high levels of expression in the cell, and intense, prolonged illumination can cause damage to the sample itself (Icha et al., 2017). If your cells are developing problems during imaging, try switching to a brighter FP with less intense illumination or one at a different wavelength. Trial and error (and checking the literature) might be necessary to figure this out in your system.
Biliverdin and cofactors
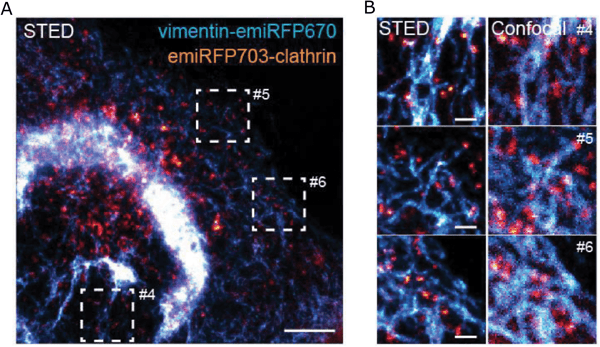
Some FPs rely on a small molecule cofactor to function. For example, many near-IR FPs (Figure 4) require biliverdin (BV). Others need flavin or another metabolite. BV is abundant in mammals, flies, zebrafish, plants, and cyanobacteria, but its availability can vary between cell types. Bacteria and C. elegans typically do not have BV so it needs to be supplemented, or you can coexpress a heme oxygenase (Zhang et al., 2023).
 |
|
Figure 4: Multicolor imaging with near-IR FPs. U2OS cell expressing vimentin-emiRFP670 (cyan) and H2B-emiRFP703 (orange) were imaged with STED (A, B) and confocal microscopy (B). Scale bars, 5 µm (A), 1 µm (B). Image reused from Matlashov et al. (2020) under CC BY license. |
Other factors to consider
Many other factors will contribute to your imaging experiment’s success. You’ll need to decide on or design the fusion construct (read more about making the right fusion), expression method (endogenous tagging, viral delivery, transient transfection, etc.), expression level (high, low, or inducible), and imaging modality (certain applications require properties like photoswitching). And if you need it, some FPs have been engineered to be especially robust to other conditions, such as heat or chemical fixation. If you really need the absolute maximum brightness and stability (for example, for some super-resolution applications) you might want to consider self-labeling proteins with chemical dyes (Grimm & Lavis, 2022).
Always be aware that FP properties tested in vitro may differ in vivo, and they can vary between cell types or conditions. Check the literature for reports characterizing FPs in your specific host — studies in mammalian cells (Cranfill et al., 2016), fungi (Botman et al., 2019; 2026; Van Genechten et al., 2020), C. elegans (Cao et al., 2024; Ko & Mizumoto, 2025), zebrafish (Tschanz et al. 2025), bacteria (Fraikin et al., 2025), and more show that the “best-performing” FP varies across organisms. Codon-optimization or other interventions to improve expression can make big differences too.
While it’s important to review the literature and compare theoretical performance to find the optimal construct for your needs, you might just have to try it yourself. Start by identifying the properties most critical for your needs, then test multiple FPs to see which works best for you. Compare different fusion constructs like N- and C-terminal fusions (even the linker sequence might make a difference!), and include proper controls to make sure the FP hasn’t disrupted some critical function by driving its mis-localization, blocking the interaction with a binding partner, or altering other properties (Dörner et al., 2026). And even better: share the data from these side-by-side comparisons when you’re ready to publish your results, so that others can learn too!
When you’re ready to get cloning, check out Addgene’s collection of FP backbone plasmids or search for existing constructs with your chosen FP. Looking to start your experiment right away? Thousands of FP expression plasmids are also available through Addgene’s Transfection-Ready DNA Service.
Conclusions
Now, before you dig that decades-old GFP fusion out of the lab freezer, take some time to think about what your experiment really needs. Upgrading to a new FP might just help your experiment be the best it can be. Here are some quick suggestions to get you started:
Fluorescent protein design is an active area of research relying on many disciplines. New discoveries from natural sources, computational approaches, directed evolution, and improved screening methods have led to impressive advances in recent years (Gest et al., 2026). Researchers keep coming up with new and improved FPs, so keep an eye on our Hot Plasmids blog series where we often highlight the best and brightest new FPs.
Ultimately, side-by-side comparisons, careful controls, and thoughtful characterization will help you choose the best FP for you. Do you have a favorite new FP you’ve tried recently? Let us know in the comments!
Thanks to Joachim Goedhart (Associate Professor at the University of Amsterdam) for helpful review and comments in preparing this blog post.
References and Resources
Original articles for fluorescent proteins mentioned in this post
- mTagBFP2: Subach et al. PLoS One. 2011
- Electra2: Papadaki et al. Sci Rep. 2022
- mTurquoise2: Goedhart et al. Nat Commun. 2012
- mCerulean3: Markwardt et al. PLoS One. 2011
- StayGold: Hirano et al. Nat Biotechnol. 2022
- mStayGold: Ando et al. Nat Methods. 2024
- mStayGold(E138D): Ivorra-Molla et al. Nat Biotechnol. 2023
- mBaoJin: Zhang et al. Nat Methods. 2024
- mNeonGreen: Shaner et al. Nat Methods. 2013
- mGreenLantern: Campbell et al. Proc Natl Acad Sci U S A. 2020
- AausFP1: Lambert et al. PLoS Biol. 2020
- Gamillus: Shinoda et al. Cell Chem Biol. 2018
- miniGFP: Liang et al. Front Bioeng Biotechnol. 2022
- UnaG: Kumagai et al. Cell. 2013
- mGold2s and mGold2t: Lee et al. Nat Commun. 2025
- hfYFP and mhYFP: Campbell et al. Nat Methods. 2022
- mScarlet3 and mScarlet-I3: Gadella et al. Nat Methods. 2023
- mScarlet3-S2: Ding et al. Nat Methods. 2025
- mScarlet3-H: Xiong et al. Nat Methods. 2025
- mRuby3: Bajar et al. Sci Rep. 2016
- miRFP670nano3: Oliinyk et al. Nat Methods. 2022
- emiRFP670, miRFP680, emiRFP703, miRFP713, and miRFP720: Matlashov et al. Nat Commun. 2020
- mLychee, mLemon, mJuniper, and mChartreuse: Fraikin et al. Sci Adv. 2025
References
Botman, D., de Groot, D. H., Schmidt, P., Goedhart, J., & Teusink, B. (2019). In vivo characterisation of fluorescent proteins in budding yeast. Sci Rep., 9(1), 2234. https://doi.org/10.1038/s41598-019-38913-z
Botman, D., de Groot, D. H., Wehrens, M., van Rossum, K., Yska, S., van der Kieft, B., Albert, V., Minghetti, N., Goedhart, J., & Teusink, B. (2026). Side-by-Side Systematic Characterization of Novel FPs in Budding Yeast. ACS Synth Biol., 15(4), 1312–1326. https://doi.org/10.1021/acssynbio.5c00676
Cao, W. X., Merritt, D. M., Pe, K., Cesar, M., & Hobert, O. (2024). Comparative analysis of new mScarlet-based red fluorescent tags in Caenorhabditis elegans. Genetics, 228(2), iyae126. https://doi.org/10.1093/genetics/iyae126
Cranfill, P. J., Sell, B. R., Baird, M. A., Allen, J. R., Lavagnino, Z., de Gruiter, H. M., Kremers, G. J., Davidson, M. W., Ustione, A., & Piston, D. W. (2016). Quantitative assessment of fluorescent proteins. Nat Methods, 13(7), 557–562. https://doi.org/10.1038/nmeth.3891
Ding, Y., He, W., Wang, K., Xue, F., Zheng, K., Zhao, S., Qi, D., Li, T., Xia, P., Pan, L., Chen, L., Chen, Z., Yuan, L., & Xu, P. (2026). A highly photostable monomeric red fluorescent protein for dual-color 3D STED and time-lapse 3D SIM imaging. Nat Methods, 23(1), 143–152. https://doi.org/10.1038/s41592-025-02962-2
Dörner, K., Gut, M. J., Overwijn, D., Cao, F., Siketanc, M., Heinrich, S., Beuret, N., Meyer, J., Sharpe, T., Lindorff-Larsen, K., & Hondele, M. (2026). Fluorescent protein and peptide tags alter condensate formation and dynamics in vivo and in vitro. EMBO Rep., 27(1), 89–121. https://doi.org/10.1038/s44319-025-00626-y
Fraikin, N., Couturier, A., Mercier, R., & Lesterlin, C. (2025). A palette of bright and photostable monomeric fluorescent proteins for bacterial time-lapse imaging. Sci Adv., 11(16), eads6201. https://doi.org/10.1126/sciadv.ads6201
Gest, A. M. M., Mehta, S., & Zhang, J. (2026). Recent developments of fluorescent proteins and biosensors driven by cross-disciplinary insights. Nat Methods, 10.1038/s41592-026-03268-7. Advance online publication. https://doi.org/10.1038/s41592-026-03268-7
Goedhart, J., & Gadella, T. W. J., Jr (2024). Breaking up the StayGold dimer yields three photostable monomers. Nat Methods, 21(4), 558–559. https://doi.org/10.1038/s41592-024-02223-8
Grimm, J. B., & Lavis, L. D. (2022). Caveat fluorophore: an insiders’ guide to small-molecule fluorescent labels. Nat Methods, 19(2), 149–158. https://doi.org/10.1038/s41592-021-01338-6
Icha, J., Weber, M., Waters, J. C., & Norden, C. (2017). Phototoxicity in live fluorescence microscopy, and how to avoid it. BioEssays, 39(8), 10.1002/bies.201700003. https://doi.org/10.1002/bies.201700003
Ko, S., & Mizumoto, K. (2025). Comparison among bright green fluorescent proteins in C. elegans. MicroPubl Biol., 2025, 10.17912/micropub.biology.001447. https://doi.org/10.17912/micropub.biology.001447
Lambert T. J. (2019). FPbase: a community-editable fluorescent protein database. Nat Methods, 16(4), 277–278. https://doi.org/10.1038/s41592-019-0352-8
Lee, J., Lai, S., Yang, S., Zhao, S., Blanco, F. A., Lyons, A. C., Merino-Urteaga, R., Ahrens, J. F., Nguyen, N. A., Liu, H., Liu, Z., Lambert, G. G., Shaner, N. C., Chen, L., Tolias, K. F., Zhang, J., Ha, T., & St-Pierre, F. (2025). Bright and photostable yellow fluorescent proteins for extended imaging. Nat Commun., 16(1), 3241. https://doi.org/10.1038/s41467-025-58223-5
Tran, L., Klein, S., Juergens, D., Sharma, S., Decarreau, J., Lee, G. R., Wang, Y., Chen, W., Bera, A. K., Kang, A., Woods, J., Joyce, E., Vafeados, D. K., Roullier, N., Li, X., Liu, B., Bo, Y., Muratspahić, E., Brown, T. A., Grimm, J. B., … Baker, D. (2026). De novo design of orthogonal far-red, orange, and green fluorophore-binding proteins for multiplexed imaging. Science, 393(6813), 813–819. https://doi.org/10.1126/science.aeb0822
Tschanz, A., Matus, D. Q., & Swinburne, I. (2025). Systematic comparison of mStayGold and mGold2 variants for live imaging in zebrafish. MicroPubl Biol., 2025, 10.17912/micropub.biology.001847. https://doi.org/10.17912/micropub.biology.001847
Van Genechten, W., Demuyser, L., Dedecker, P., & Van Dijck, P. (2020). Presenting a codon-optimized palette of fluorescent proteins for use in Candida albicans. Sci Rep., 10(1), 6158. https://doi.org/10.1038/s41598-020-63308-w
Zhang, H., Papadaki, S., Sun, X., Wang, X., Drobizhev, M., Yao, L., Rehbock, M., Köster, R. W., Wu, L., Namikawa, K., & Piatkevich, K. D. (2023). Quantitative assessment of near-infrared fluorescent proteins. Nat Methods, 20(10), 1605–1616. https://doi.org/10.1038/s41592-023-01975-z
Additional resources on the Addgene blog
- Choosing Your Fluorescent Proteins for Multi-Color Imaging
- Quick Guide to Near-Infrared Fluorescent Proteins
- A Practical Approach to Choosing the B(right)est Fluorescent Protein
- When is a Monomer not a Monomer? The Top Three Ways Your Favorite Fluorescent Protein Oligomerizes in Cells
- Choosing the B(right)est Fluorescent Protein: Aggregation Tendency
- Choosing the B(right)est Fluorescent Protein: Photostability
- Fluorescent Proteins 101: GFP Fusion Proteins - Making the Right Connection
- Live and Let Dye: Self-Labeling Protein Tags
Resources on addgene.org
- Fluorescent Proteins: Empty Backbones
- Fluorescent Proteins: In Vivo Imaging
- Michael Davidson Fluorescent Protein Collection
- Botman-Teusink Yeast Fluorescent Protein Collection
- Transfection-Ready DNA Service
External Resources
Topics: Imaging and More, Fluorescent Proteins



Leave a Comment