This post was written by Professor Mark Howarth, investigator at the University of Cambridge. His research focuses on protein innovations for therapeutic and vaccine design. We all want tools that expand what we can achieve, but are simple to pick up and work well the first ...
It takes a village! While you usually hear this phrase when discussing raising children, it can also be applied to research. Sharing knowledge and tools is the best way to help propel research forward and have the biggest impact. We should know — Addgene has built its foundation ...
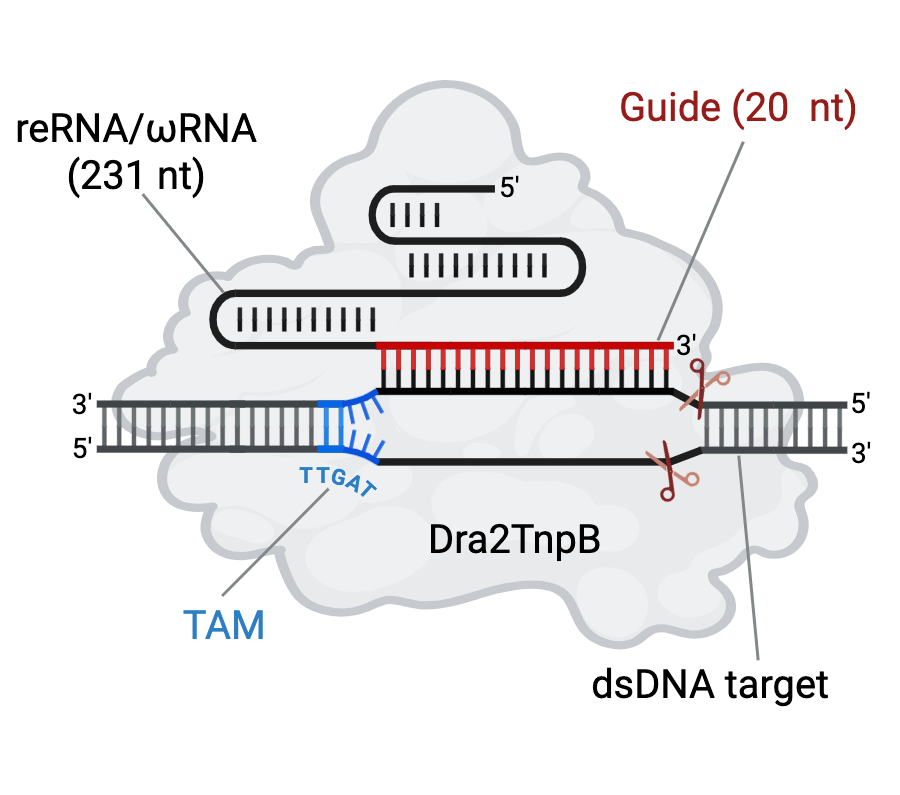
This blog post was written by Dr. Kutubuddin Molla, investigator at ICAR-Central National Rice Research Institute. When it comes to genome editing, CRISPR is a name that resonates with nearly every biologist, academic, and researcher. Among the most well-known CRISPR-associated ...
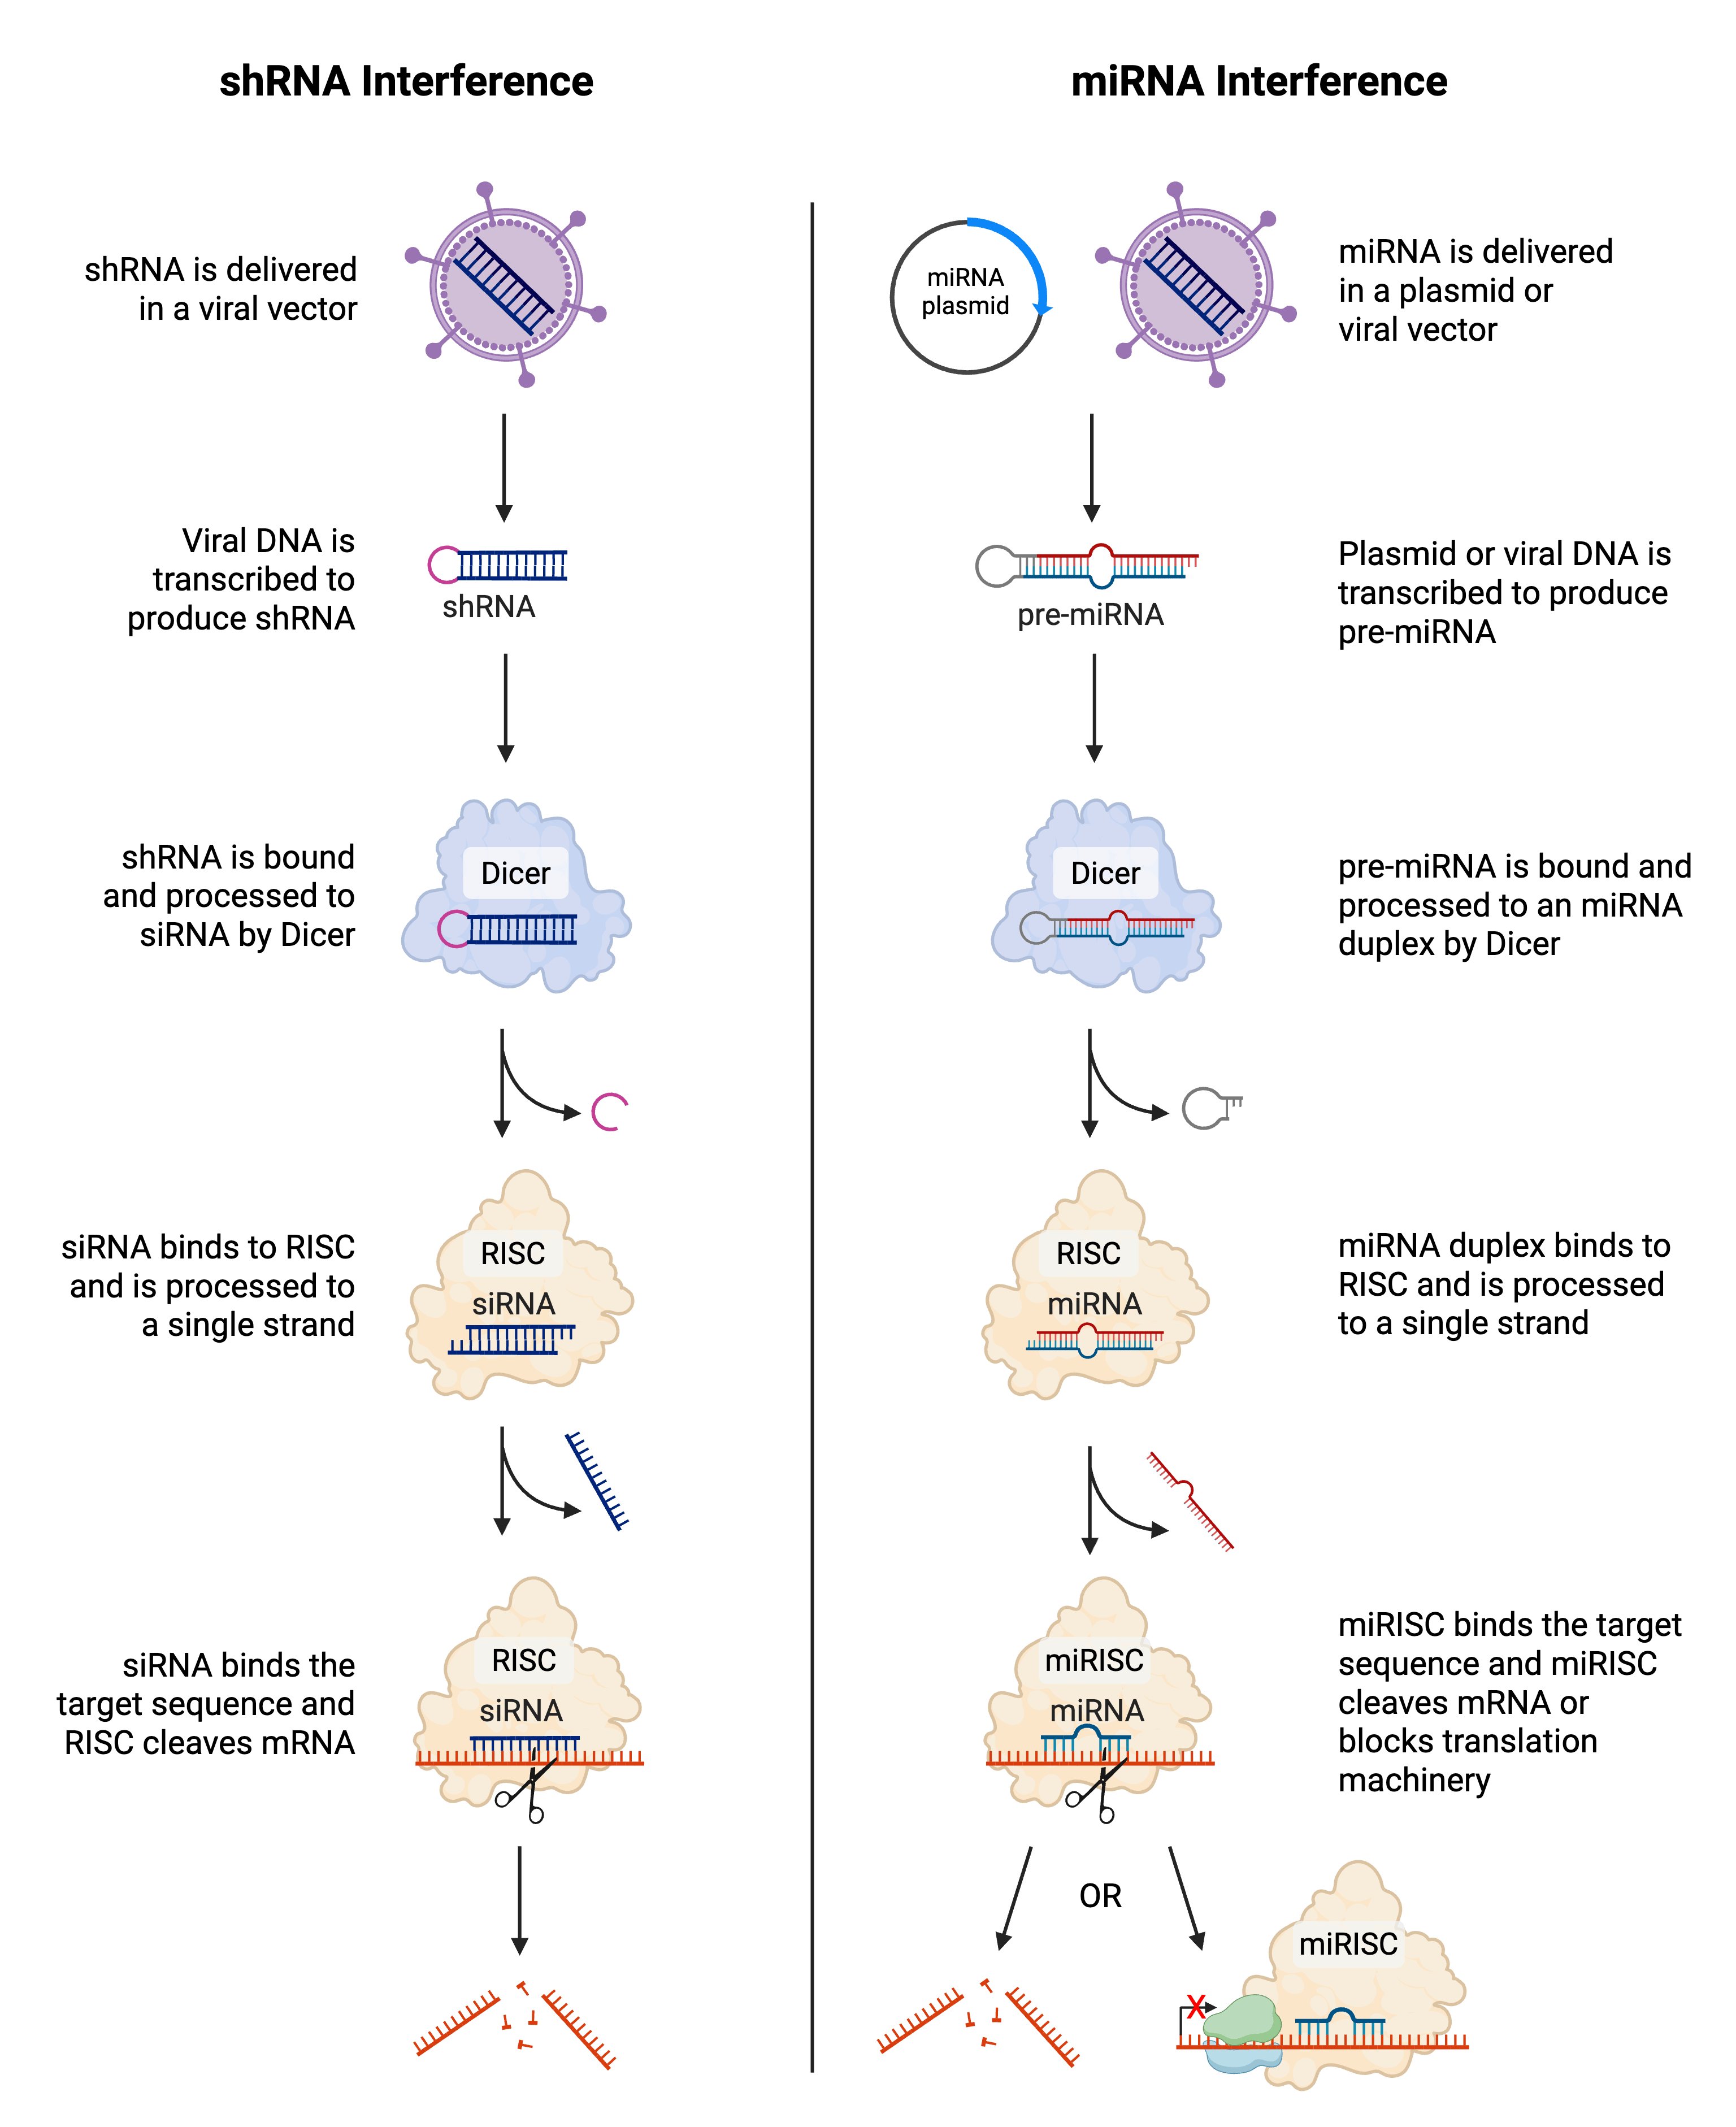
An oldie but a goodie — a phrase used to refer to something that has fallen out of fashion but is still useful and most importantly, effective. In the research world, there is a myriad of tools this could be applied to. When it comes to altering gene expression, CRISPR ...
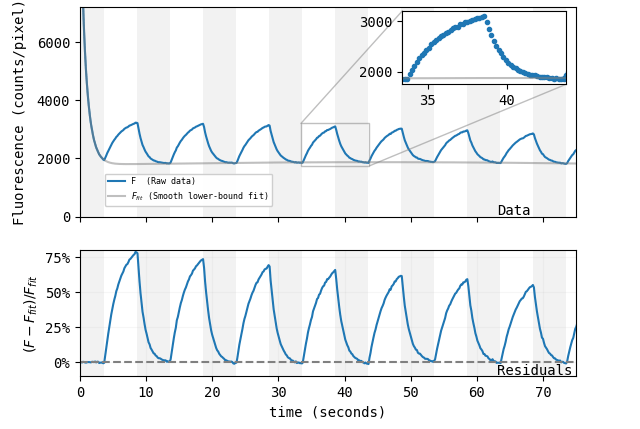
Lots of scientists work to invent novel techniques or to engineer improved tools for familiar applications. But how does one invent a tool for applications that don’t even exist yet? Andrew York, Maria Ingaramo, and their team at Calico Life Sciences recently set out to do just ...
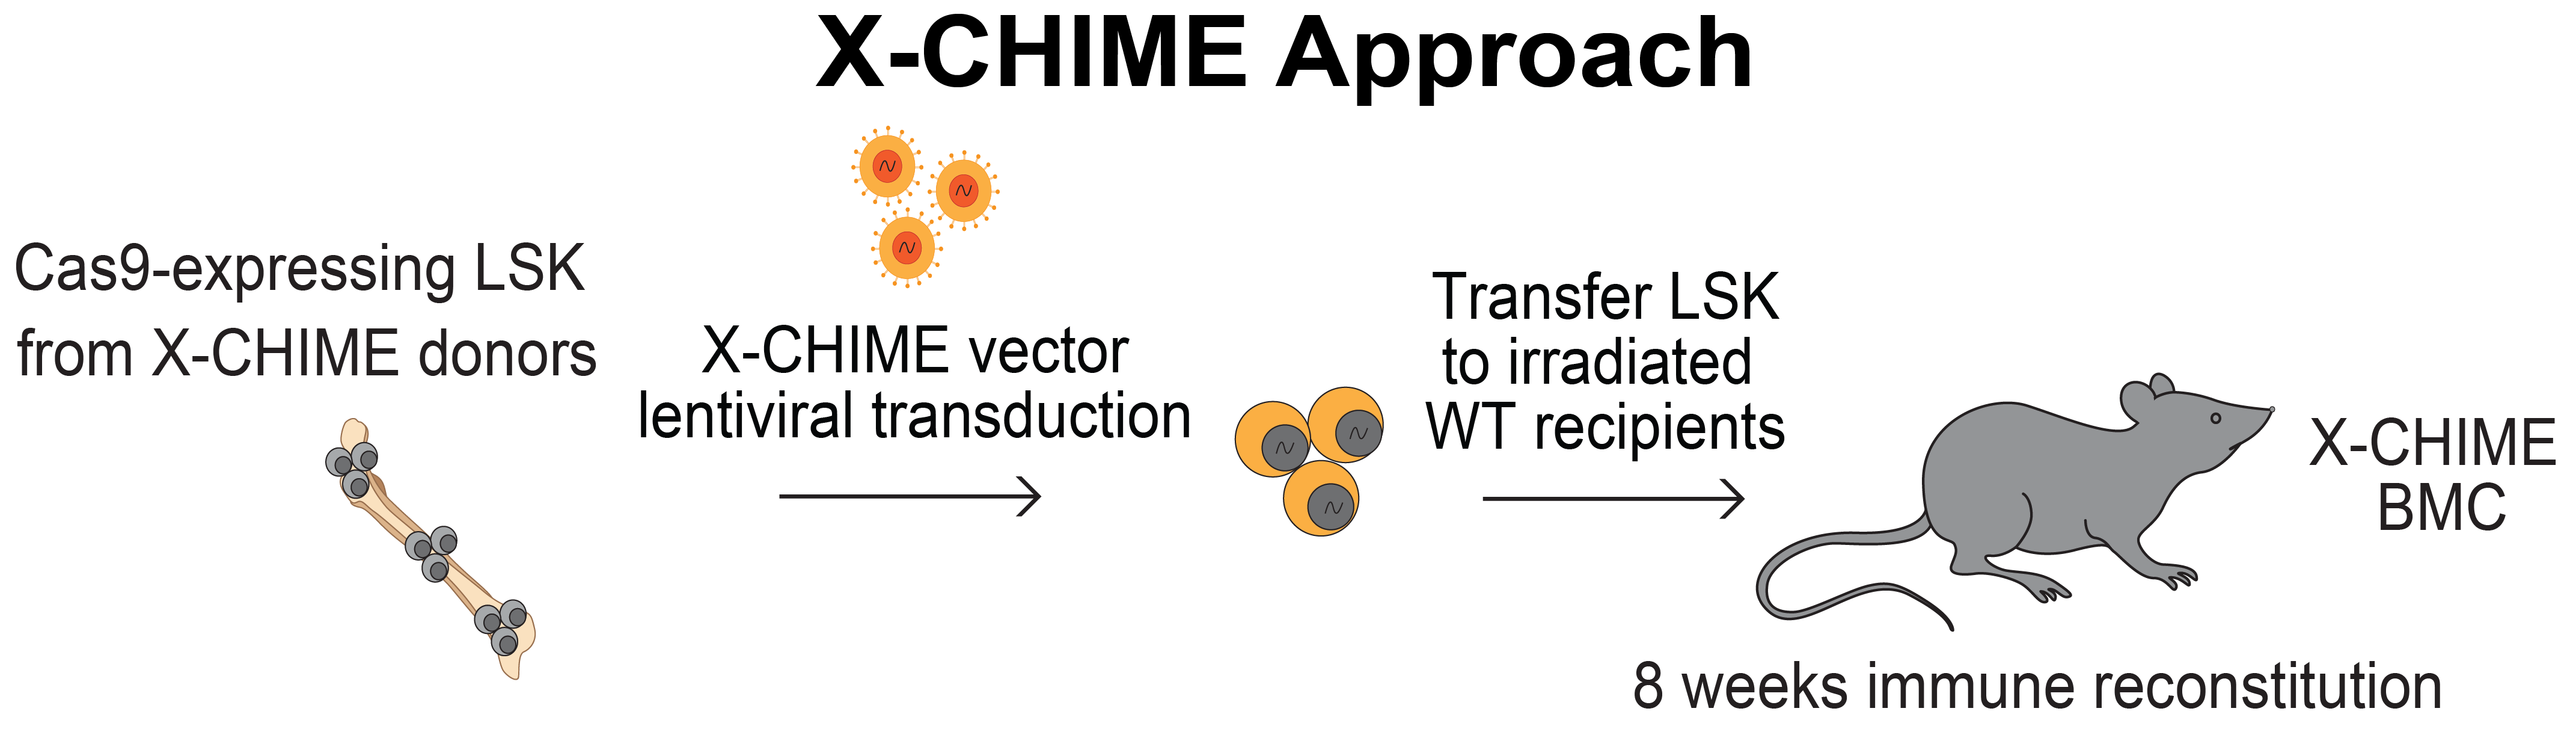
Annotation of genes in immune cells typically involves the creation of germline knockout mice, which is time-consuming, as it only changes one gene at a time. CRISPR-based systems enable gene knockout in immune cells in a high-throughput manner, but these systems have not been ...
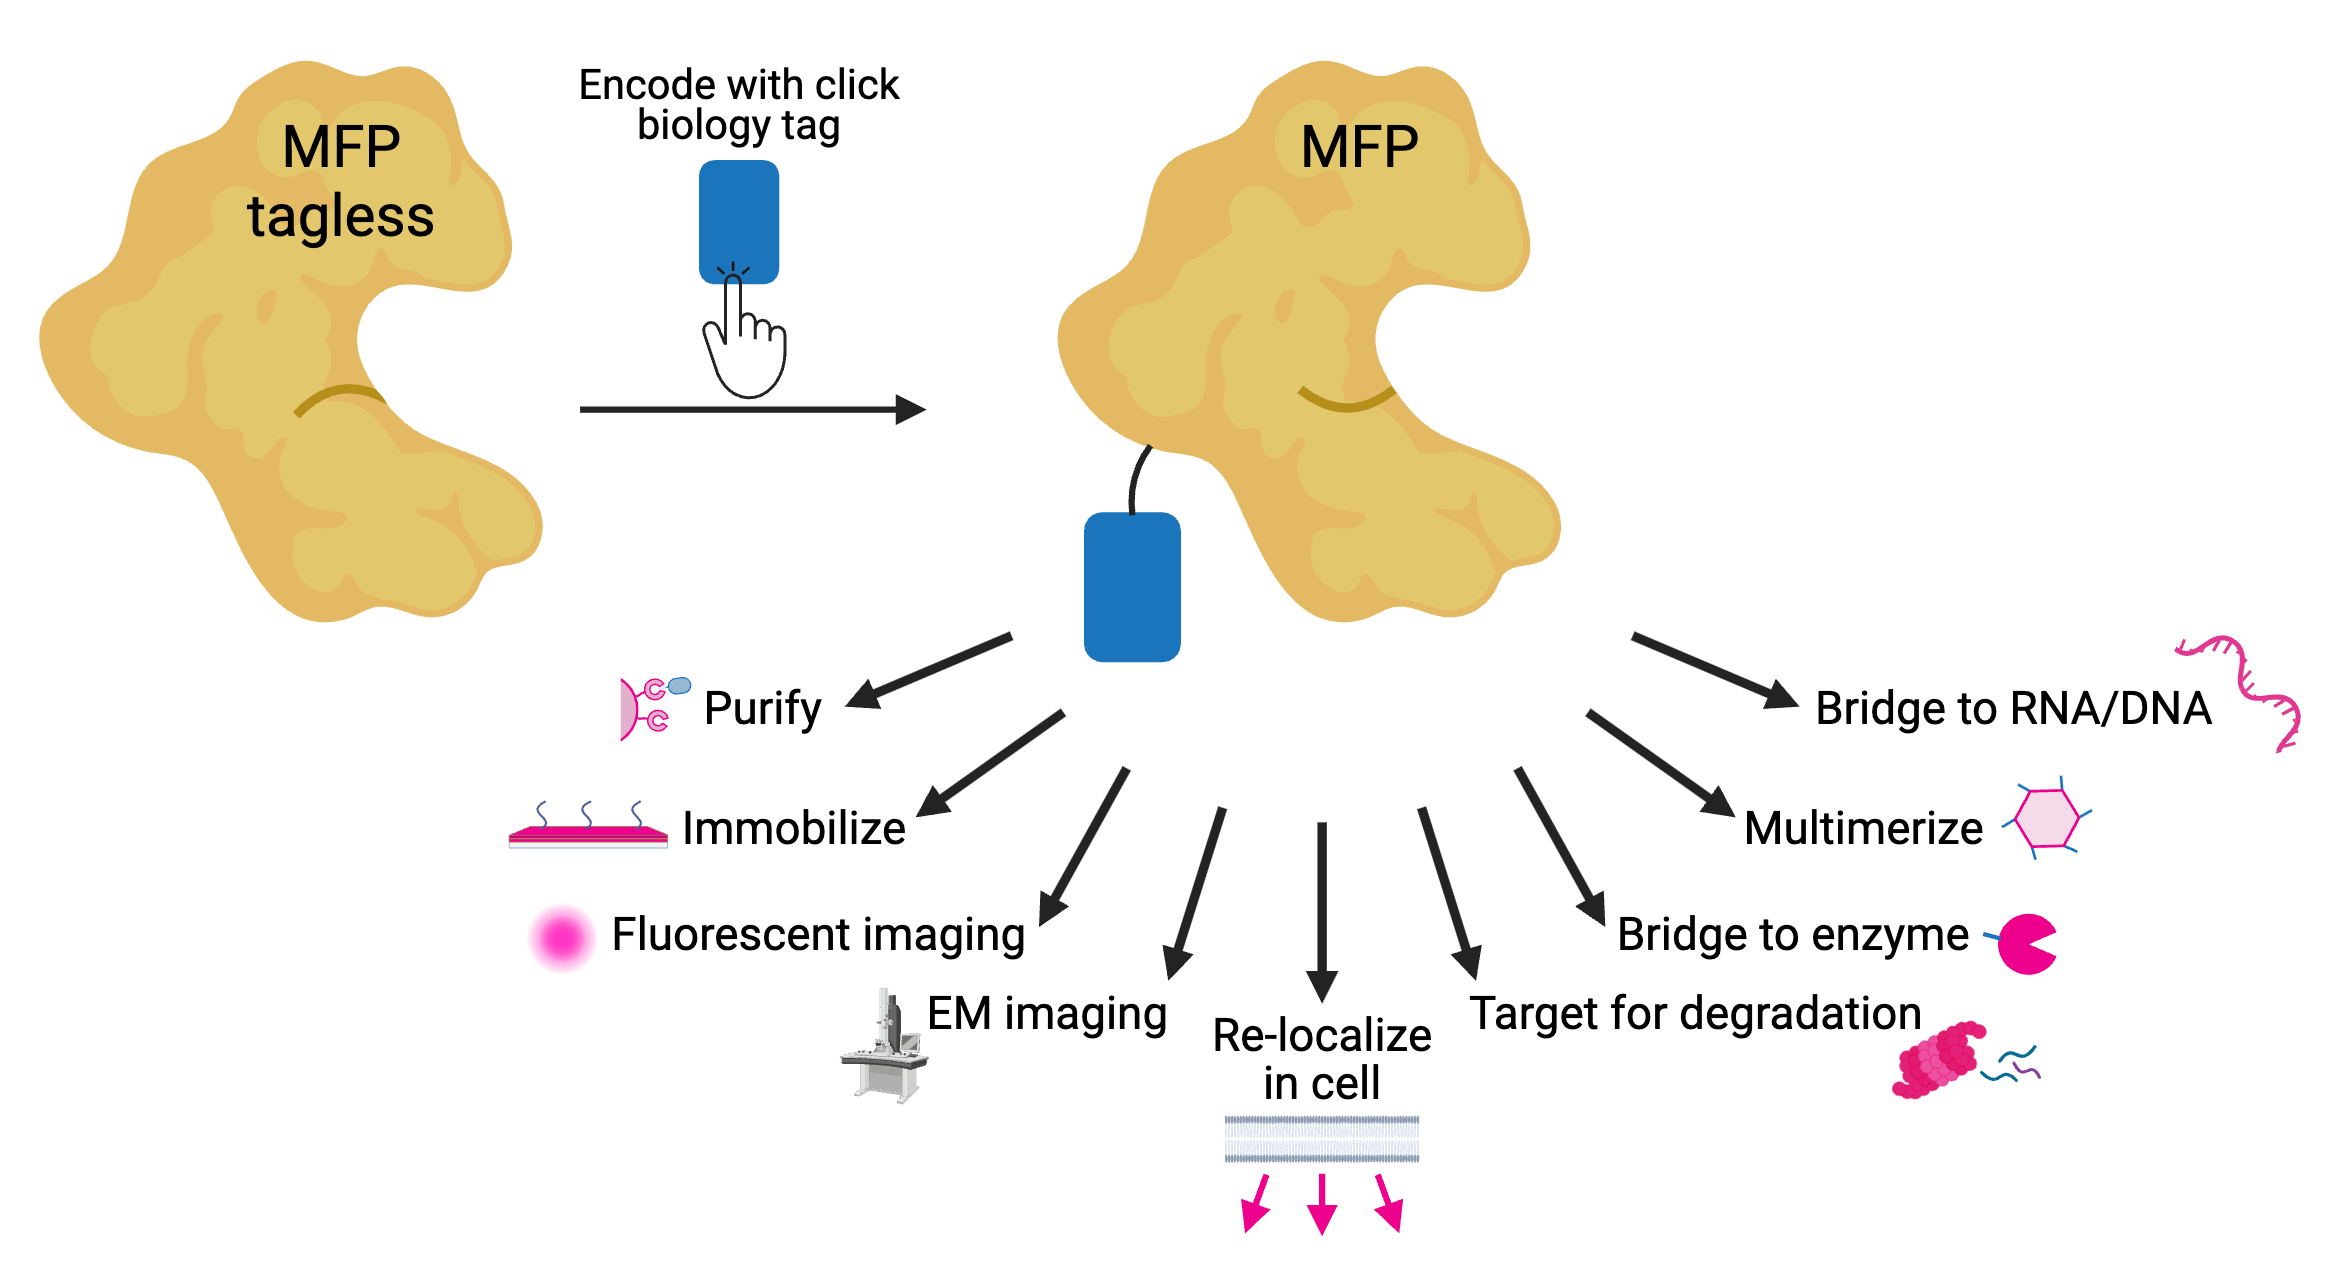
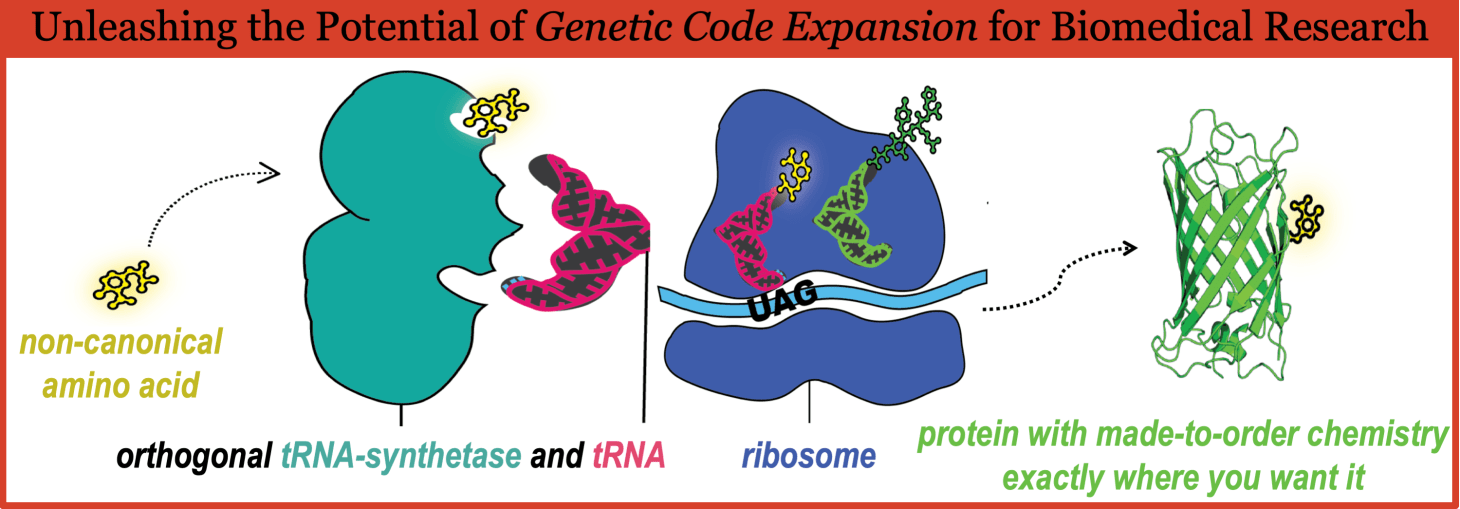
If you study proteins, you’re probably quite interested in the canonical 20 amino acids. But in your quest to learn more about your protein of interest, you may find the available amino acids a bit…limiting. It may be time, then, to look towards genetic code expansion (GCE): ...
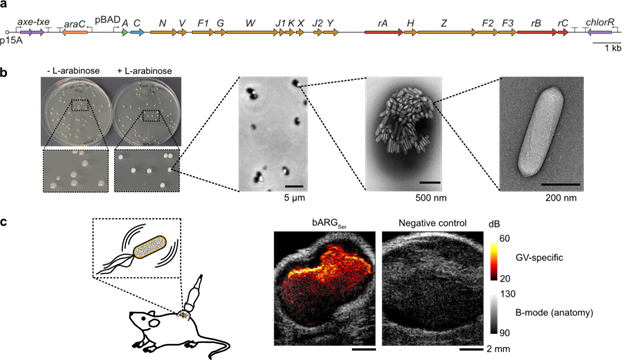
What are Acoustic Reporter Genes (ARGs)? Fluorescent and bioluminescent reporter genes are widely used to study gene expression in cells. But these reporters have limited use in vivo because they are based on light which is very easily scattered by tissue. Ultrasound, on the ...