By Guest Blogger
Read More
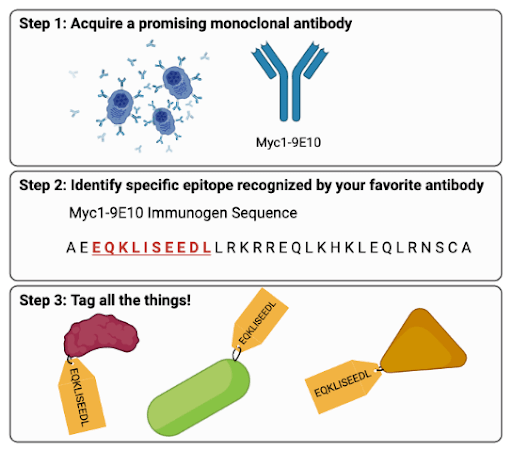
Do you ever wonder about the origins of some of the common techniques or tools you use in the lab? Take for instance, the commonly used Myc-tag. Who first started using it in protein tagging experiments? Why Myc? When did the commonly used anti-c-Myc [9E10] antibody come into ...
Sleigh bells, please! It's time to announce the winners of the 2022 #DeckTheLab contest!
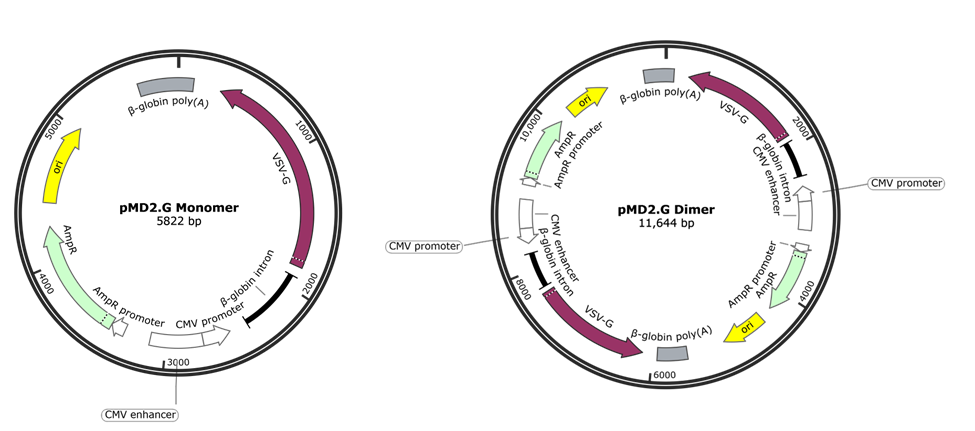
When performing restriction digests on plasmids at Addgene, we sometimes observe something odd in our uncut DNA control: a band or two appear on an agarose gel at notably higher molecular weights than expected, given the size of the plasmid. This is seen only in the uncut DNA; ...
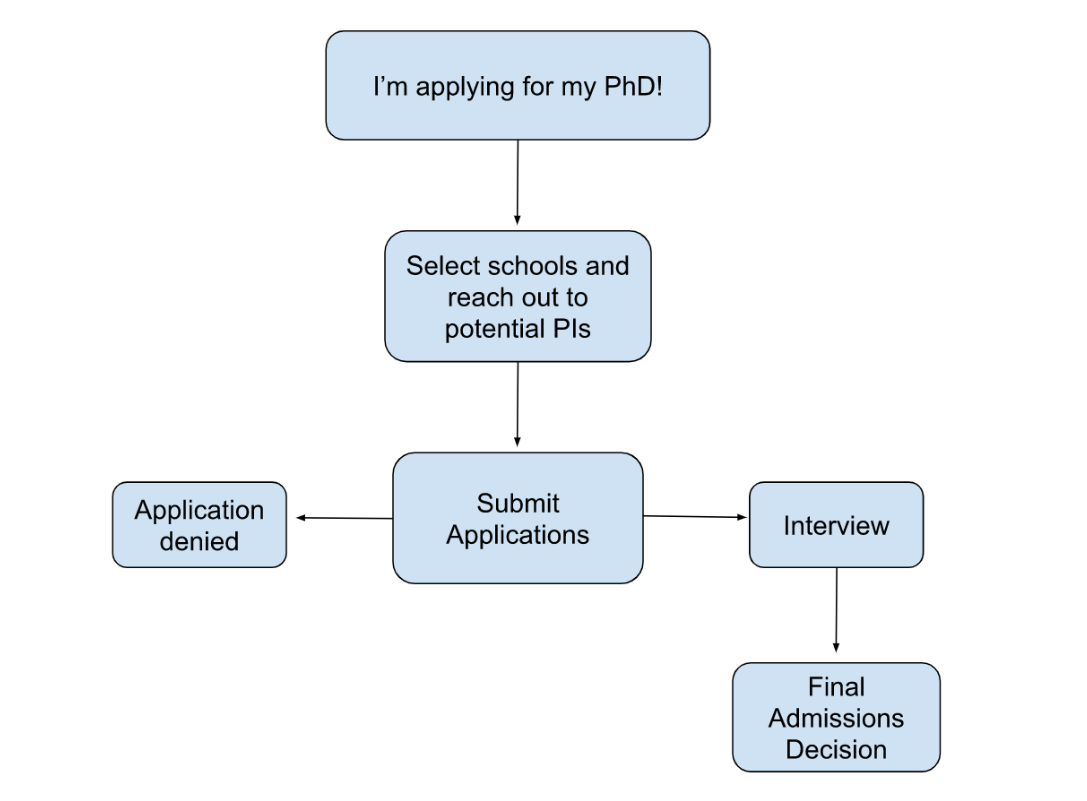
Every student about to graduate shares the same nightmare: the question “So, what comes next?” For those finishing up an undergraduate education or ending a Master’s program, the answer might be to continue in academia and pursue a PhD. However, if you’re anything like me, the ...
Every year we celebrate the 12 Days of CRISPR with some of the latest and greatest in CRISPR tools and resources! Ready to sing along with this year's lineup? Right! We're ready to, so let's get started!
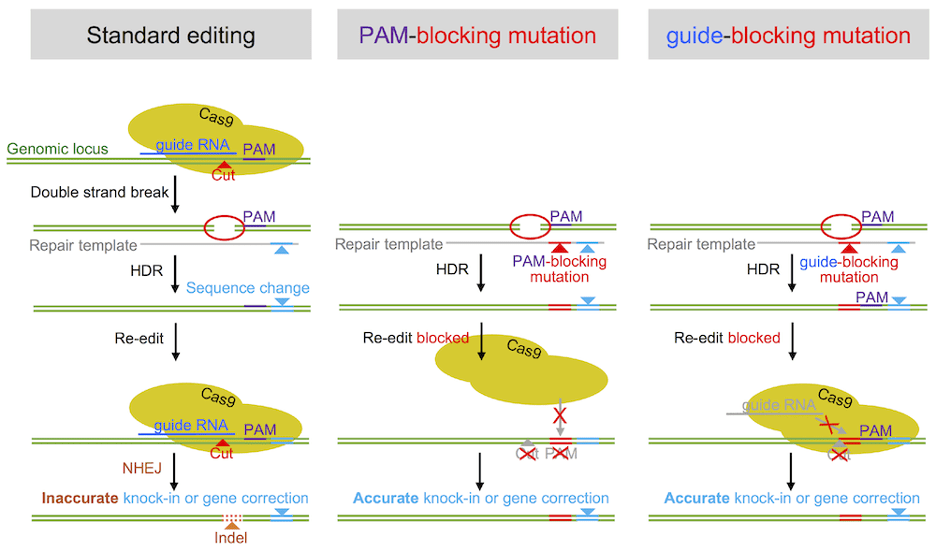
Taking the road less traveled and generating a knock-in cell line instead of a knock-out? We’ve got you covered in this blog, with tips and tricks for harnessing the homology-directed repair pathway, designing the best donor DNA, and avoiding common mishaps in this class of ...
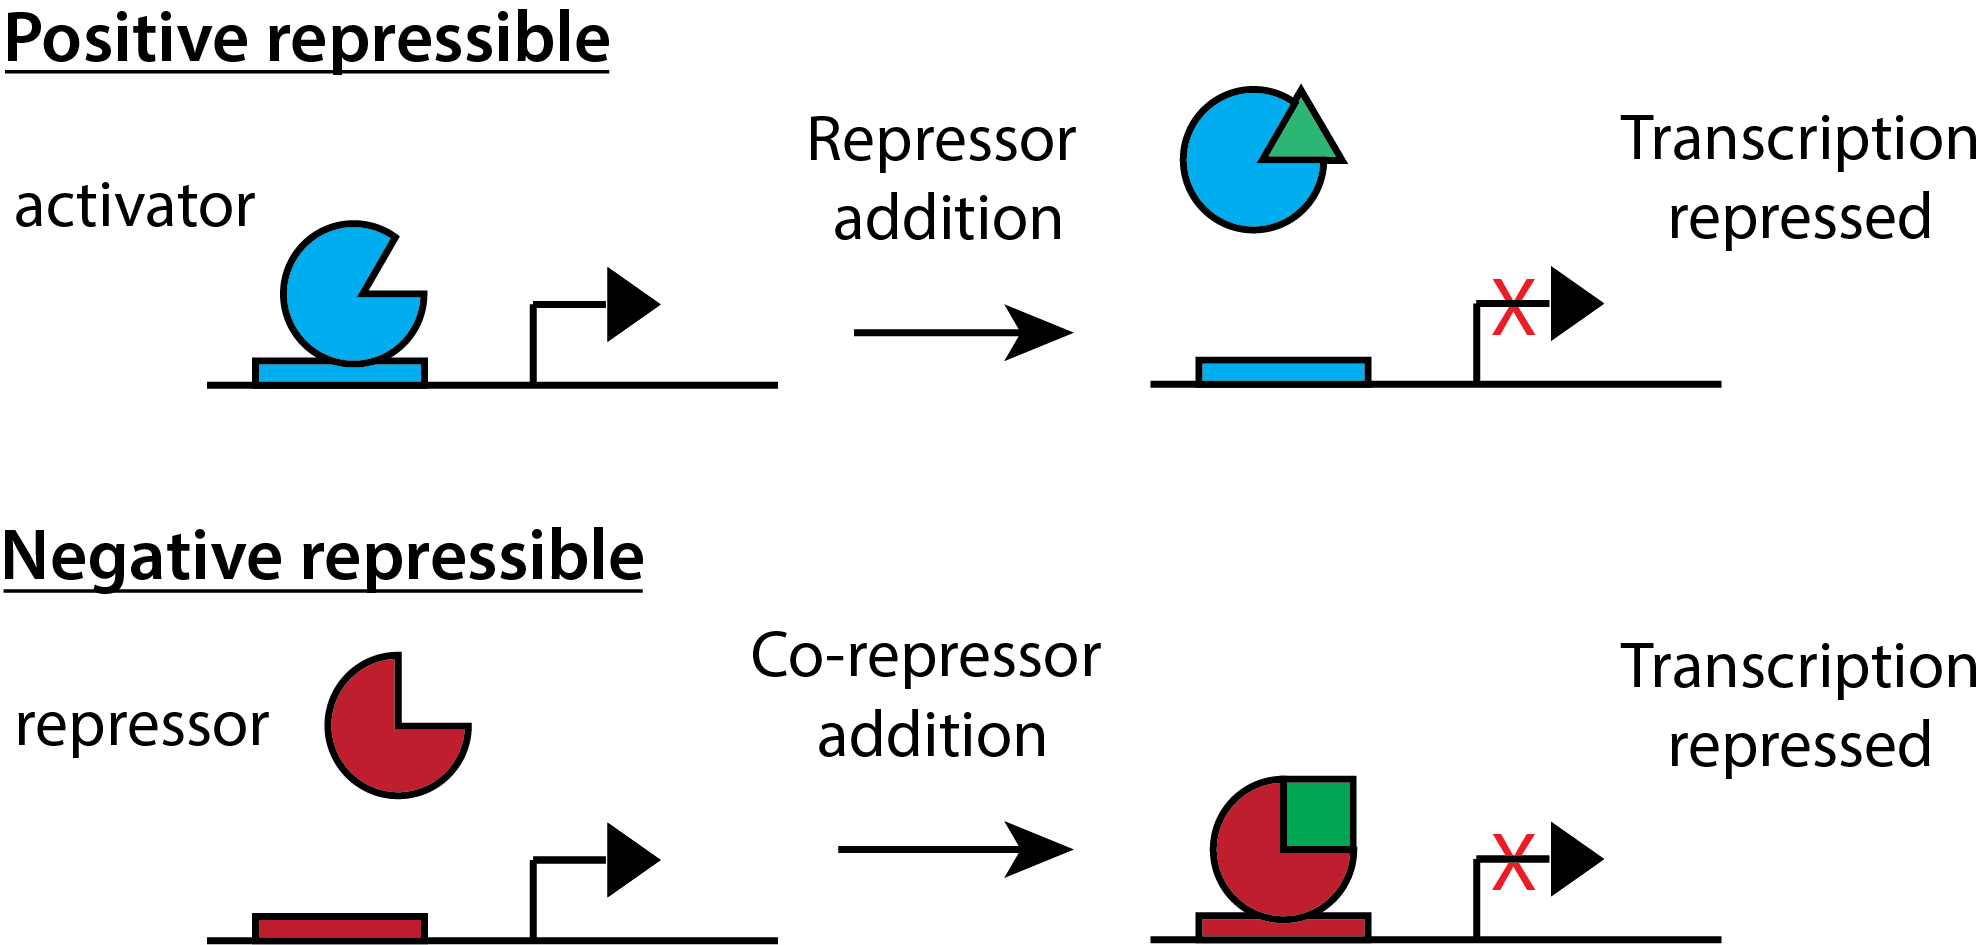
Promoters control the binding of RNA polymerase and transcription factors. Since the promoter region drives transcription of a target gene, it therefore determines the timing of gene expression and largely defines the amount of recombinant protein that will be produced. Many ...