

In meetings, in surveys, on Twitter - there is one thing we've heard over and over from our users: "Please, please improve your plasmid maps!" After thoughtful design, vetting, and tweaking, we’re excited to announce that our plasmid and sequence displays are now powered by GSL Biotech's SnapGene Server Software. With the backing of SnapGene’s sequence viewer software and extensive feature library, our updated plasmid and sequence displays are now much easier to interpret and analyze at a glance. For a quick look at just how much things have improved, check out the example below. Our old map is on the left while the SnapGene powered map is on the right (click here to see the new map in action). Read on to learn more about the improvements we’ve implemented and how they’ll make it easier for you to find the plasmids you need. We'll be monitoring and improving the maps further after this initial launch so stay tuned for more updates.


Overview of SnapGene powered plasmid maps at Addgene
Three factors make our SnapGene powered plasmid maps far easier to navigate. These practical and effective changes will give you the ability to find the plasmid with the features you need quickly.
- SnapGene’s Feature Library - SnapGene’s software seamlessly identifies a variety of common plasmid features such as antibiotic resistance genes, selectable markers, promoters, origins, tags, and certain ORFs. Their sophisticated detection algorithm easily and precisely identifies plasmid features that differ by only a few nucleotides, such as the fluorescent proteins EGFP and mEGFP. Many of these features, such as Cas9, weren’t detected by our in-house software. In fact, SnapGene’s feature library includes nearly 3x as many features as could be detected by our in-house software and also eliminates many of the extraneous ORFs that cluttered our old plasmid maps.
- Clearly Annotated Features, Enzymes, and Primers - The new maps have the identities of most features labeled directly on them making them much easier to quickly identify.
- Improved Restriction Enzyme Handling - SnapGene’s software positions restriction enzyme annotations throughout the map at locations better aligned to their precise positions within the plasmid. The list of enzymes that can be detected is 5x greater than our previous mapping software and now includes Type IIS restriction enzymes that are commonly used for Golden Gate cloning or for CRISPR gRNA cloning.
With this more functional display, you can start thinking about your next cloning experiment early on.
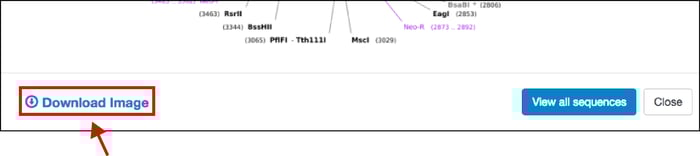 Beyond these simple but powerful display improvements, when you click on any plasmid map, you also have the ability to to download the static image file (PNG, see above) for your own reference or to paste directly into your notebook. This will make it easier for you to share plasmid information with colleagues, or explain plasmid features to a lab member when you’re not at your computer.
Maps, sequences, & downloadable .gb & .dna files
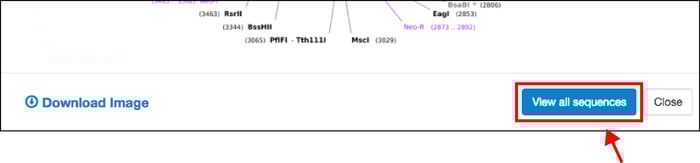 Once you’ve identified a plasmid that you want to learn more about, updates to our sequence analyzer will allow you to dive into the details. Click on the “View all sequences” button to find all available sequence information from Addgene depositors and our own sequencing results:
 On this page you can download an annotated GenBank File or a SnapGene file for the sequences listed. You can then analyze the sequence in your sequence viewer of choice. If the depositor provided a custom annotated GenBank file, this can be found on the main plasmid page under the "Resource Information" section.
Analyze your plasmid sequence
For more immediate, high-level analysis, you can click directly on the “Analyze Sequence” button to pull up an interactive plasmid map powered by SnapGene and gain access to additional tooltip information and sequence analysis tabs including:
-
Maps
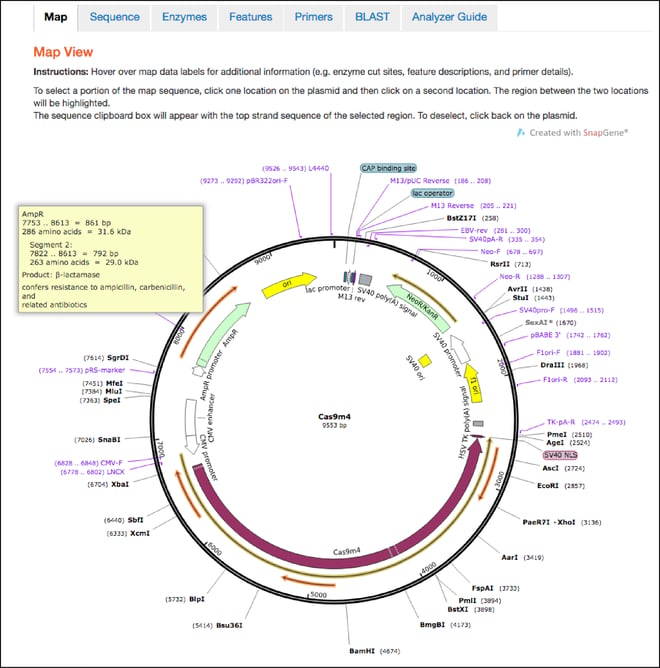
- This is the first tab you’ll land on after clicking the “Analyze Sequence” button. The maps hosted here retain all the features shown in the static maps discussed above, but also have interactive functionalities. You can now hover over any feature, enzyme, primer, or ORF to learn more information about it. For example, if you hover over the ampicillin resistance gene, you’ll find the full name of the gene, the name of its gene product, and a description of its function. You can also click one location in the plasmid and then a second location to select the sequence between the two locations and send it to the clipboard for copy and paste functionality.
-
Sequence
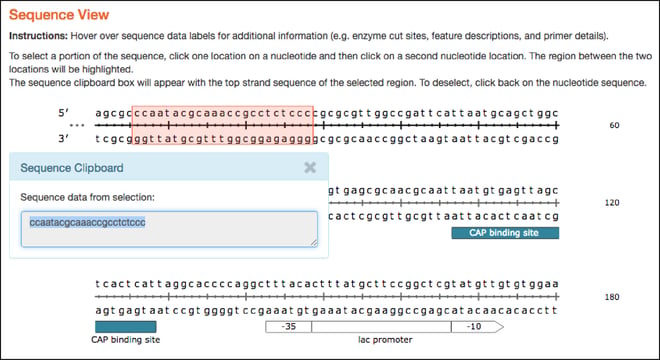
- Similar to the plasmid maps, the linear sequences hosted here are now interactive and have similar hover over features. As with the map tab, clicking on two separate locations in the linear sequence selects the sequence between the two locations and sends it to the clipboard for copy and paste functionality.
-
Restriction Enzymes
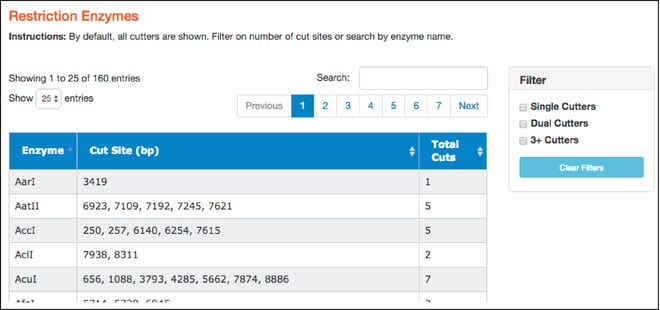
- Here you'll find a table of restriction enzymes that cut the given sequence. The table includes enzyme names, the locations where the enzymes will cut (in basepairs), and the total number of times they cut. Use the filters on the right to find single, dual, and 3+ cutters. You can also sort enzymes by clicking on column heads. Clicking on a particular restriction enzyme here also highlights it in the “Map” and “Sequence” tabs.
-
Features
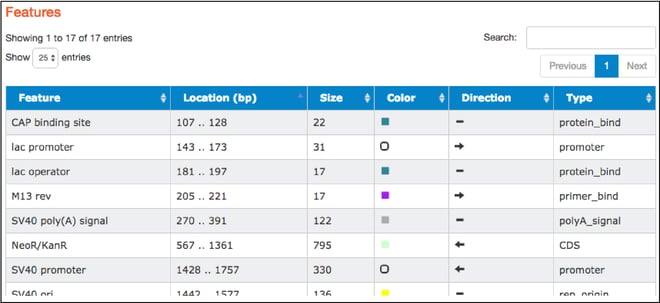
- The table found here lists the common features detected in the plasmid sequence. The table includes feature names, locations, sizes, colors used to indicate them on the map, direction (if relevant), and types. Types listed are standard GenBank feature types. Clicking on a particular feature here also highlights that feature in the “Map” and “Sequence” tabs.
-
Primers
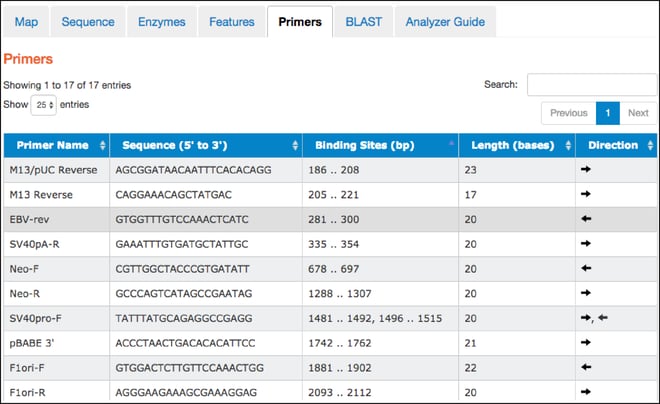
- This tab contains a table listing commonly used primers detected in a given nucleotide sequence. The table includes primer names, sequences, binding site locations, lengths, and direction. Clicking on a particular primer here also highlights it in the “Map” and “Sequence” tabs.
-
BLAST
- Use the Basic Local Alignment Search Tool (BLAST) via the NCBI website to determine similarity between a given sequence and nucleotide (BLASTN) or protein (BLASTX) sequence databases. Additionally, align a custom nucleotide sequence against a given sequence using BLAST2. See this blog post for tips on using BLAST to verify plasmids.
-
Analyzer guide
- A quick guide to all of the tabs listed above and their functions.
We hope that these updates will make it much easier to browse the repository and quickly identify the plasmids and features you need for your next experiment. We would like to extend our thanks to you (our community of scientists) for suggesting these changes, and the SnapGene and Addgene software development teams for working tirelessly to implement these improvements. Let us know what you think about the updates in the comments section below and keep checking in at blog.addgene.org for additional enhancements that will further improve the map displays and functions.
Topics: Addgene News, Using Addgene's Website


Leave a Comment